|
Economic news was mixed this past week but more negative than positive. More importantly, markets were mesmerized and paralyzed by the public bantering by opposing sides in Washington on whether to raise the debt ceiling and by the lack of progress as the earlier stated deadline of August 2 looms closer.
 Equities were weighed down all week by political wrangling and lack of progress on lifting the federal debt ceiling in order to prevent a partial shutdown on federal spending on August 2 and to prevent a likely downgrade in the Treasury’s credit rating. At the start of the week, in addition to U.S. debt problems, Moody’s cut Greece’s debt rating, adding to woes in equity markets. Equities were weighed down all week by political wrangling and lack of progress on lifting the federal debt ceiling in order to prevent a partial shutdown on federal spending on August 2 and to prevent a likely downgrade in the Treasury’s credit rating. At the start of the week, in addition to U.S. debt problems, Moody’s cut Greece’s debt rating, adding to woes in equity markets.
 The good news on Tuesday included a small gain in consumer confidence and Case-Shiller home prices nudging up. But these were more than outweighed by a drop in new home sales, lack of progress in Washington, and disappointing forecasts from 3M and UPS. At mid-week, durables orders unexpectedly declined and the Beige Book reported a slowing economy. Also on Wednesday, Moody’s and Fitch indicated they may downgrade the US’s top AAA rating if lawmakers fail to resolve the debt ceiling stalemate. The good news on Tuesday included a small gain in consumer confidence and Case-Shiller home prices nudging up. But these were more than outweighed by a drop in new home sales, lack of progress in Washington, and disappointing forecasts from 3M and UPS. At mid-week, durables orders unexpectedly declined and the Beige Book reported a slowing economy. Also on Wednesday, Moody’s and Fitch indicated they may downgrade the US’s top AAA rating if lawmakers fail to resolve the debt ceiling stalemate.
Thursday got off to a good start with a sharp decline in initial jobless claims and a gain in pending home sales. Stocks lost steam in the afternoon as investors continued to worry about the debt ceiling deadline looming the next week. At close of the week, below expectations GDP growth for the second quarter and downward revisions to most of 2008-2010 knocked stocks lower. However, comments from President Barack Obama that the Administration might arrange a few days extension of the debt ceiling deadline to allow further negotiations in Congress helped cut into the day’s losses.
The Dow closed the week with its biggest weekly loss in a year.
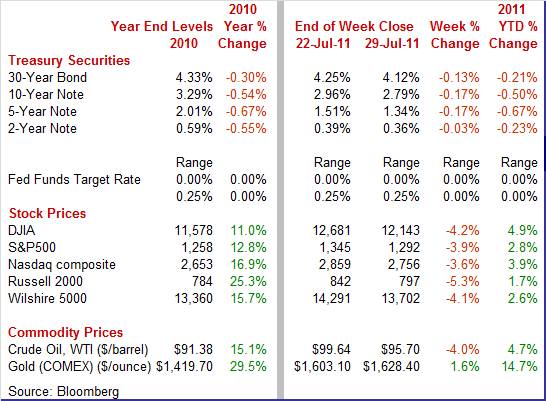
Equities were down this past week. The Dow was down 4.2 percent; the S&P 500, down 3.9 percent; the Nasdaq, down 3.6 percent; and the Russell 2000, down 5.3 percent.
For the month of July, major indexes were pummeled the last week and are down as follows: the Dow, down 2.2 percent; the S&P 500, down 2.1 percent; the Nasdaq, down 0.6 percent; and the Russell 2000, down 3.7 percent.
For the year-to-date, major indexes are up as follows: the Dow, up 4.9 percent; the S&P 500, up 2.8 percent; the Nasdaq, up 3.9 percent; and the Russell 2000, up 1.7 percent.
Weekly percent change column reflects percent changes for all components except interest rates. Interest rate changes are reflected in simple differences.
 There were a number of minor oscillations in Treasury yields the first four days of the trading week, but it all boiled down to Friday’s events. Rates dropped sharply at week’s close after Q2 GDP growth came in significantly below expectations and recent history for GDP was mostly revised down with annual revisions. Also, flight to safety set in on the lack of progress on lifting the federal debt ceiling. There were a number of minor oscillations in Treasury yields the first four days of the trading week, but it all boiled down to Friday’s events. Rates dropped sharply at week’s close after Q2 GDP growth came in significantly below expectations and recent history for GDP was mostly revised down with annual revisions. Also, flight to safety set in on the lack of progress on lifting the federal debt ceiling.
For this past week Treasury rates were down as follows: the 2-year note, down 3 basis points; the 5-year note, down 17 basis points; the 7-year note, down 15 basis points; the 10-year note, down 17 basis points; and the 30-year bond, down 13 basis points. The 3-month T-bill rose 7 basis points.
 Crude oil prices fell significantly for the week with notable daily changes only on Wednesday and Friday though no resolution on the debt ceiling weighed on prices all week. On Wednesday, the drop in durables orders and unexpected gains in crude and refined oil inventories sent spot WTI down a little over $2 per barrel. On Friday, the disappointing GDP report, getting close to the debt ceiling deadline with no progress, and reports of increased production by OPED bumped spot WTI down somewhat under $2 per barrel for the day. Crude oil prices fell significantly for the week with notable daily changes only on Wednesday and Friday though no resolution on the debt ceiling weighed on prices all week. On Wednesday, the drop in durables orders and unexpected gains in crude and refined oil inventories sent spot WTI down a little over $2 per barrel. On Friday, the disappointing GDP report, getting close to the debt ceiling deadline with no progress, and reports of increased production by OPED bumped spot WTI down somewhat under $2 per barrel for the day.
Net for the week, spot prices for West Texas Intermediate dropped $3.94 per barrel over the week to settle at $95.70.
Economic news was largely disappointing this week. There are no strong signs of a return to recession but soft growth continues.
 Second quarter GDP was softer than expected and the recession was worse than earlier believed. The soft patch continued into the second quarter as GDP growth posted at a very sluggish 1.3 percent annualized rise, following a downwardly revised increase of 0.4 percent in the first quarter. Analysts had forecast a 1.9 percent boost for the latest quarter and the first quarter was previously estimated at 1.9 percent. The latest report includes standard annual revisions going back three years for most series. Second quarter GDP was softer than expected and the recession was worse than earlier believed. The soft patch continued into the second quarter as GDP growth posted at a very sluggish 1.3 percent annualized rise, following a downwardly revised increase of 0.4 percent in the first quarter. Analysts had forecast a 1.9 percent boost for the latest quarter and the first quarter was previously estimated at 1.9 percent. The latest report includes standard annual revisions going back three years for most series.
 Demand numbers improved but barely. Final sales of domestic product improved to up an annualized 1.1 percent from 0.0 percent (unchanged) in the first quarter (previously 0.6 percent). Final sales to domestic purchasers also nudged up, rising 0.5 percent from 0.4 percent in the prior period (previously 0.4 percent). Demand numbers improved but barely. Final sales of domestic product improved to up an annualized 1.1 percent from 0.0 percent (unchanged) in the first quarter (previously 0.6 percent). Final sales to domestic purchasers also nudged up, rising 0.5 percent from 0.4 percent in the prior period (previously 0.4 percent).
 Most of the anemia in the second quarter came from the consumer sector which came to a screeching halt with a 0.1 annualized percent uptick in the first quarter, following a 2.1 percent rise the prior quarter. Government purchases declined modestly while gains were seen in net exports, business investment in structures and equipment, and even residential investment. Inventories nudged up. Most of the anemia in the second quarter came from the consumer sector which came to a screeching halt with a 0.1 annualized percent uptick in the first quarter, following a 2.1 percent rise the prior quarter. Government purchases declined modestly while gains were seen in net exports, business investment in structures and equipment, and even residential investment. Inventories nudged up.
Economy-wide inflation according to the GDP price index showed only incremental change in momentum, rising 2.3 percent, following an increase of 2.5 percent in the first quarter. Analysts expected a 2.0 percent gain.
The annual revisions did change economic history a bit and overall it was not good. For the year, economic growth in 2010 was nudged up to 3.0 percent on an annual average basis, compared to the prior estimate of 2.9 percent. But the upward revision came from earlier quarters as Q3 and Q4 were revised down.
The recent recession was worse than earlier believed. The contraction is not annualized, but rather reported as the actual decline over the six quarter period, GDP fell a cumulative 5.1 percent—larger than the 4.1 percent as previously estimated. This was the deepest recession since World War II.
Inflation is marginally worse than earlier estimated. The chain price index was adjusted upward in 2009 and 2010. The growth rate for 2010 is now set at 1.8 percent (annual average), compared to the earlier estimated 1.7 percent.
The bottom line is that the economy had much to recover from. The revised data indicate how important stimulus efforts were, though there is plenty of room for debate over what portions were most effective or what might have been more effective. The current economy is still sluggish and both businesses and consumers need clarity from Washington on debt ceiling and deficit reduction plans to move forward. Meanwhile, economic news in latter Q2 and early Q3 suggest only modest improvement in growth. Traders will be parsing this Tuesday’s personal income report on whether consumer spending was picking up or slowing on the margin for Q2.
 New home sales in June fell 1.0 percent in to an annual rate of 312,000. By Census region, weakness was led by a monthly 15.8 drop in the Northeast with the West declining 12.7 percent. The Midwest gained 9.5 percent while the South rose 3.4 percent. New home sales in June fell 1.0 percent in to an annual rate of 312,000. By Census region, weakness was led by a monthly 15.8 drop in the Northeast with the West declining 12.7 percent. The Midwest gained 9.5 percent while the South rose 3.4 percent.
Months’ supply eased a bit, to 6.3 months at June's sales rate, compared to 6.4 and 6.5 in the two prior months. Caution on the part of homebuilders has cut into supply as total homes for sale dipped 3,000 to 164,000—a new record low in nearly 50 years of data.
Price strength was also positive with the median up 5.8 percent to $235,200 and resulting in a year-ago gain of 7.2 percent. A caveat, however, is that prices are not on a repeat transaction basis.
 Pending home sales have been volatile recently and with the huge jump in May, expectations were for some giveback in June. Instead, contract signings for existing home sales rose 2.4 percent, following May’s surge of 8.2 percent. Pending home sales have been volatile recently and with the huge jump in May, expectations were for some giveback in June. Instead, contract signings for existing home sales rose 2.4 percent, following May’s surge of 8.2 percent.
The year-on-year rate improved to 19.8 percent from 13.4 percent in May.
The latest report likely will raise expectations for a gain in July existing home sales, a report where final closings are measured. However, the big concern is that a bigger share of signings are failing to close due to tighter credit standards and legal holdups in foreclosed properties.
 Despite weakness in homes sales in May (existing homes down 3.8 percent and new homes down 0.6 percent), home prices are holding up. The Case-Shiller seasonally adjusted 10-city composite rose 0.1 percent in May, following a 0.4 percent gain the month before. Apparently, supply is down enough to keep monthly price changes from declining. Also, buyers are likely concerned about possibly higher mortgage rates as the Fed was ending its second round of quantitative easing. Despite weakness in homes sales in May (existing homes down 3.8 percent and new homes down 0.6 percent), home prices are holding up. The Case-Shiller seasonally adjusted 10-city composite rose 0.1 percent in May, following a 0.4 percent gain the month before. Apparently, supply is down enough to keep monthly price changes from declining. Also, buyers are likely concerned about possibly higher mortgage rates as the Fed was ending its second round of quantitative easing.
A look at the unadjusted data shows wide gains as the unadjusted composite 10 index rose 1.1 percent. But spring and summer are when demand is strongest.
Year-on-year, price contraction deepened slightly to minus 3.6 percent versus minus 3.4 percent in April.
 The latest headline number for durables was ugly and disappointing. New factory orders for durables in June fell 2.1 percent, following a rebound of 1.9 percent the prior month. The June figure came in below the median forecast for a 1.0 percent rise. Excluding transportation, durables edged up 0.1 percent after rebounding 0.7 percent in May. The latest headline number for durables was ugly and disappointing. New factory orders for durables in June fell 2.1 percent, following a rebound of 1.9 percent the prior month. The June figure came in below the median forecast for a 1.0 percent rise. Excluding transportation, durables edged up 0.1 percent after rebounding 0.7 percent in May.
Transportation was the weakest component, dropping a sharp 8.5 percent, following a 5.8 percent rebound in May. All major subcomponents of transportation were down. For June, motor vehicles slipped 1.4 percent, nondefense aircraft dropped 28.9 percent, and defense aircraft fell 20.5 percent. But Boeing is expected to boost nondefense aircraft soon and autos are expected to recover from supply shortages from Japan.
In ex-autos, weakness was in machinery, which fell 2.3 percent, with all other industries up. On the positive side, gains were seen in primary metals, up 1.0 percent; computers & electronics, up 0.2 percent; electrical equipment, up 0.4 percent; and “other,” up 0.2 percent. Overall, the picture for durables manufacturing is mixed, though recovery from temporary weakness in nondefense aircraft and autos should bump up orders and production in durables manufacturing in coming months.
 For the two latest reports out from the Conference Board and University of Michigan, the measures of the consumer mood headed in opposite directions. Both remain weak, however. For the two latest reports out from the Conference Board and University of Michigan, the measures of the consumer mood headed in opposite directions. Both remain weak, however.
The Conference Board's index of Consumer Confidence rose 1.9 points in July to 59.5 from a revised 57.6 in June. These levels are very depressed and far from an 80 reading that would be consistent with strong economic conditions. The expectations component gained 3 points to 75.4 while the present situation index slipped 1.9 points to 35.7.
While more respondents say jobs are hard to get and describe current business conditions as bad, there is less pessimism for coming months. For the six-month outlook, an increased percentage sees more jobs ahead and more say business conditions will improve. Also, more see their income on the rise.
However, the Reuters/University of Michigan survey headed down as consumer sentiment edged even lower in the latter half of the month, to a final July reading of 63.7, compared to 63.8 at mid-month and 71.5 for final June. The July readings are the weakest since first-quarter 2009 when the economy was in recession.
Pessimism was centered in expectations where the component is at 56.0, up slightly from 55.8 at mid-month but down substantially from 64.8 from June. The current conditions component showed less severe erosion with the final July reading at 75.8 versus 76.3 at mid-month and 82.0 in final June.
Basically, the consumer mood is going to remain in the vicinity of glum until the jobs situation actually improves notably and this likely will take some time.
In the latest Beige Book, the Federal Reserve said the economy grew at a slower pace in more parts of the country since the beginning of June as shoppers restrained spending and factory production eased. Growth slowed in eight of the Fed’s 12 regions, compared with four in the last survey. Many regions said manufacturing slowed or held steady while consumer spending, which accounts for about 70 percent of the economy, grew modestly. Auto sales slowed. Retailers in the Boston, Richmond, Atlanta, and San Francisco Fed regions said sales were mixed, while merchants in St. Louis said sales slowed. The housing market remained weak.
Price pressures moderated somewhat in many Districts, although some firms indicated that they were able to pass on some cost increases to their customers.
Overall, the economy continued to post modest growth with inflation contained for now. The economy still has modest forward momentum.
The economy in the first half was much softer than expected. At the end of the second quarter and start of the third, news has been mixed on whether the economy is gaining strength. But overall, growth appears to be sluggish at worst and still positive. This coming week brings a plethora of news on whether key sectors are improving.
The highlight of the week is the July Employment Situation Report posted on Friday. Leading off the week, however, will be ISM manufacturing. The consumer is in the spotlight Tuesday with personal income and motor vehicle sales. At mid-week, the ADP employment report likely has traders fine tuning their employment forecasts as will Thursday’s jobless claims.
The forecasts below are preliminary. Any updates will be posted on Econoday web calendar pages.
The composite index from the ISM manufacturing survey in June rose 1.8 percent to 55.3. However, inventories, one of five equally weighted components, jumped 5.4 points to 54.1. The new orders index showed only slight month-to-month acceleration at 51.6 compared to 51.0 in May.
ISM manufacturing composite index Consensus Forecast for July 11: 54.3
Range: 52.0 to 55.4
Construction spending in May weakened as overall outlays fell 0.6 percent, following a 0.6 percent drop in April. Weakness in the latest month was led by a 2.1 percent decrease in private residential spending, following a 2.9 percent gain the month before. Looking ahead, there is a good chance for improvement in this component in June based on an unexpectedly strong 14.6 percent monthly jump in housing starts.
Construction spending Consensus Forecast for June 11: 0.0 percent
Range: -0.4 to +0.7 percent
Sales of domestic light motor vehicles in June fell 2.8 percent to 8.8 million units. Meanwhile, imports decreased 3.4 percent to 2.6 million units. Overall sales of domestic and import motor vehicles declined 2.9 percent to 11.5 million units annualized and followed a drop of 10.4 percent in May. Sales continued to be weighed down by shortages of models dependent upon Japanese parts and there could be a rebound in sales as availability improves.
Motor vehicle sales, total combined Consensus Forecast for July 11: 11.9 million-unit rate
Range: 11.7 to 12.3 million-unit rate
Personal income in May rose 0.3 percent, matching the gain the month before. However, wages & salaries increased a modest 0.2 percent, following a rise of 0.4 percent in April. Personal spending weakened in May, posting at no change, following a 0.3 percent boost the prior month. The slowdown was largely due to a decline in motor vehicle sales as durables dropped 1.5 percent, a drop related to shortages of autos dependent upon Japanese parts. On the inflation front, the PCE price index eased to a 0.2 percent rise from 0.3 percent in April. However, the core rate edged up to 0.3 percent from 0.2 percent in April.
Looking ahead, the private wages & salaries component for June is likely to be soft as aggregate weekly earnings dipped 0.3 percent. PCEs will likely be negative for goods components as retail sales ex autos were flat and unit new motor vehicle sales declined. PCE inflation should be mixed as the headline CPI fell 0.2 percent in June while the core CPI rose 0.3 percent.
This personal income report incorporates standard annual revisions to the National Income and Product Accounts, generally going back three years but sometimes more.
Personal income Consensus Forecast for June 11: +0.2 percent
Range: -0.2 to +0.4 percent
Personal consumption expenditures Consensus Forecast for June 11: +0.1 percent
Range: -0.1 to +0.2 percent
Core PCE price index Consensus Forecast for June 11: +0.2 percent
Range: +0.1 to +0.2 percent
ADP private payroll employment last month estimated June private payrolls to post a 157,000 gain. However, BLS private payrolls came in with only a 57,000 rise for the month.
ADP private payrolls Consensus Forecast for July 11: 86,000
Range: 60,000 to 145,000
Factory orders in May rose 0.8 percent, following April's disappointing 0.9 percent decline. New orders on the durable side—boosted by gains for aircraft and motor vehicles—gained a sharp 2.1 percent. Nondurables orders dipped 0.2 percent. Non-durable goods are especially sensitive to price changes in this case a dip back for energy prices. More recently, new factory orders for durables in June fell 2.1 percent. Excluding transportation, durables edged up 0.1 percent.
Factory orders Consensus Forecast for June 11: -1.0 percent
Range: -1.7 to -0.7 percent
The composite index from the ISM non-manufacturing survey in June edged down 1.3 points to 53.3. The latest reading remained above 50 to indicate month-to-month growth. The new orders index slowed 3.2 points to 53.6. However, the employment index printed at a reading of 54.1. While certainly not sizzling, it was in positive territory and 0.1 point higher than May. The positive reading—albeit modestly positive—is still a vote of confidence by businesses that forward momentum in the economy continues.
ISM non-manufacturing composite index Consensus Forecast for July 11: 53.0
Range: 52.1 to 55.5
Initial jobless claims for the July 23 week dropped a very sharp 24,000 to 398,000 for the first sub-400,000 reading since early April. In a partial offset, the prior week was revised 4,000 higher to 422,000. The four-week average of 413,750 is down a steep 8,500 in the week for a nearly 15,000 improvement from the month-ago reading. One factor that clouds the latest report and movement ahead is uncertainty about retooling in the auto sector. During summer retooling, timing is always hard to gauge and uncertainty is even greater this year due to ongoing production cutbacks tied to shortages of parts from Japan. Minnesota, where the government remained shut down for most of the week was also a special factor, reflecting the likelihood that the state was hindered in processing claims.
Jobless Claims Consensus Forecast for 7/30/11: 403,000
Range: 388,000 to 410,000
Nonfarm payroll employment in June slowed to a crawl with an 18,000 gain, following a 25,000 rise in May, and 217,000 in April. Once again, the government sector held down payroll numbers as private nonfarm payrolls outpaced the total with an increase of 57,000 in June, following a 73,000 advance in May. Goods-producing jobs edged up 4,000, following a 3,000 rise in May. Manufacturing jobs rebounded 6,000 after a 2,000 dip in May. Growth in private service-providing jobs slowed to a rise of 53,000 after a 70,000 increase the prior month. The government sector shed another 39,000, following a 48,000 drop in May. Average hourly earnings also slowed June, coming in at no change, following a 0.3 percent rise the prior month. From the household survey, the unemployment rate edged up to 9.2 percent from 9.1 percent in May.
Nonfarm payrolls Consensus Forecast for July 11: 75,000
Range: 30,000 to 125,000
Private payrolls Consensus Forecast for July 11: 100,000
Range: 80,000 to 150,000
Unemployment rate Consensus Forecast for July 11: 9.2 percent
Range: 9.1 to 9.3 percent
Average workweek Consensus Forecast for July 11: 34.3 hours
Range: 34.3 to 34.4 hours
Average hourly earnings Consensus Forecast for July 11: +0.2 percent
Range: +0.1 to +0.3 percent
A gain for revolving credit is a solid indication of consumer strength and helped to lift consumer credit in May by a respectable $5.1 billion after gaining $5.7 billion the month before. Revolving credit, mostly credit cards, rose $3.4 billion in the month. The nonrevolving credit side showed a $1.7 billion gain in May despite the month's weak vehicle sales due to parts shortages from Japan.
Consumer credit Consensus Forecast for June 11: +$5.0 billion
Range: +$2.0 billion to +$9.3 billion
R. Mark Rogers is the author of The Complete Idiot’s Guide to Economic Indicators, Penguin Books, 2009.
Econoday Senior Writer Mark Pender contributed to this article.
|
