|
Financial markets got their hopes up that the Fed is about to engage in QE3 but Fed Chairman Ben Bernanke clarified that no such plan is underway. Meanwhile, both parties in Congress and the Administration continue to wrangle over how and whether to lift the ceiling on the federal debt. For investors, the picture, which includes sluggish economic data and sovereign debt concerns, is not pretty.
 Equities ended the week down significantly as mostly favorable earnings reports were overshadowed by other news. The week's mood started glumly following the prior Friday’s surprisingly weak jobs reports. Equities dropped Monday as investors were spooked by concern that Europe's debt crisis is spreading to larger nations like Italy and Spain. But after the closing bell, Alcoa provided some cheer, reporting a bigger-than-expected gain in second-quarter sales. Equities ended the week down significantly as mostly favorable earnings reports were overshadowed by other news. The week's mood started glumly following the prior Friday’s surprisingly weak jobs reports. Equities dropped Monday as investors were spooked by concern that Europe's debt crisis is spreading to larger nations like Italy and Spain. But after the closing bell, Alcoa provided some cheer, reporting a bigger-than-expected gain in second-quarter sales.
Stocks got some lift early in the afternoon on Tuesday as Fed minutes suggested that the Fed might be considering a third round of quantitative easing. But when news was released that Moody’s had cut Ireland’s debt rating to junk, equities fell and closed well into negative territory. Ireland is the third European country to be downgraded to junk, joining Portugal and Greece. A sharp and unexpected widening in the U.S. trade gap also weighed on stocks during the day.
At mid-week, shares rebounded from a three day sell off as comments from Federal Reserve Chairman Ben Bernanke—in the first of two days of semi-annual testimony before Congress—raised hopes that there could be further stimulus for the US economy. Also boosting stocks was news out of China that its economy grew faster than forecast in the second quarter. However, concern about lack of progress in raising the U.S. debt ceiling cut into the day’s gains. After close, Moody’s warned that it might cut the U.S. government’s Aaa credit rating within the next 90 days, depending on the government’s action or inaction in addressing debt and deficit problems.
For once, on Thursday the economic news was a little better than expected as retail sales slightly topped forecasts and initial jobless claims declined more than projected. Still, the economic data were soft, though better than forecast. The big news was clarification by Fed Chairman Bernanke in his second day of Congressional testimony that the Fed currently has no plans to implement QE3—just that it can if needed. Stocks fell immediately on that clarification. And Moody’s announcement after close on Wednesday also weighed on stocks. After the bell on Thursday, Google reported profits that significantly beat expectations.
With lift just before close on Friday, stocks ended the week on a positive note. This was despite economic data mostly on the soft side as July Empire State manufacturing remained negative and mid-July consumer sentiment unexpectedly dropped sharply. However, June industrial production rose modestly. But the big worry remained lack of progress in resolving the federal debt ceiling issue and enacting a plan to reduce the federal deficit. For the day, stocks were boosted by corporate news starting with carryover from Thursday’s Google announcement. Friday, equities rose on Citicorp beating estimates and on news that investor Carl Icahn offered to buy all of Clorox stock that he did not already own. Major indexes closed the day up but the week significantly down.
Equities were down this past week. The Dow was down 1.4 percent; the S&P 500, down 2.1 percent; the Nasdaq, down 2.4 percent; and the Russell 2000, down 2.8 percent.
For the year-to-date, major indexes are up as follows: the Dow, up 7.8 percent; the S&P 500, up 4.7 percent; the Nasdaq, up 5.2 percent; and the Russell 2000, up 5.8 percent.
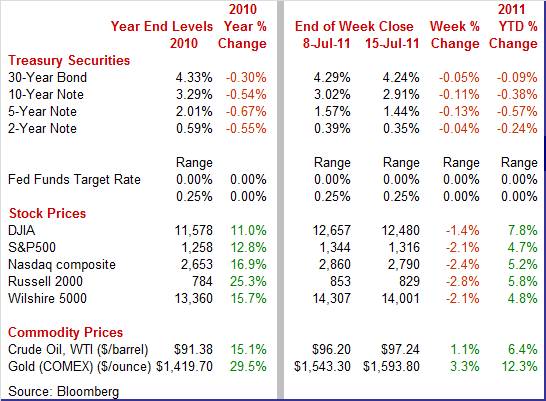
Weekly percent change column reflects percent changes for all components except interest rates. Interest rate changes are reflected in simple differences.
 Treasury yields continued to trend downward as worries about European sovereign debt outweighed concern that a compromise might not be reached before August 2 on the U.S. debt ceiling. Also, flight to safety was heightened from losses in equity markets. Treasury yields continued to trend downward as worries about European sovereign debt outweighed concern that a compromise might not be reached before August 2 on the U.S. debt ceiling. Also, flight to safety was heightened from losses in equity markets.
The week started with the benchmark 10-year yield falling below 3 percent for the first time since June 27, clearly indicating a fear trade with worries about Europe and the prior Friday’s anemic jobs report at the fore. Moody’s cutting Ireland’s credit rating to junk on Tuesday also weighed on rates as did the view that Fed minutes suggested further Fed easing ahead.
Throughout the early part of the week, Italy increasingly was seen at risk of not making payments on its debt, resulting in worries that Italy would not be able to conduct an auction on Thursday, further adding to flight to safety.
Rates firmed notably on Thursday after Fed Chairman Bernanke stated that the Fed has no current plans to implement another round of quantitative easing. But rates eased again on the last day of trading on weak economic news—especially the drop in consumer sentiment.
Despite a warning from Moody’s that it might cut the U.S.’s credit rating, U.S. Treasuries are still seen as the safe bet in these uncertain times.
For this past week Treasury rates were down as follows: 3-month T-bill, down 1 basis point; the 2-year note, down 4 basis points; the 5-year note, down 13 basis points; the 7-year note, down 15 basis points; the 10-year note, down 11 basis points; and the 30-year bond, down 5 basis points.
 The spot price of crude netted a modest weekly gain. But the spot price of crude headed down on Monday on news of a slowdown in imports by China and on worries that the European debt crisis will spread to Italy. Prices rose more than $2 per barrel Tuesday on progress by ECB officials to resolve European sovereign debt issues. Also, a market survey posted a forecast for a drop in U.S. crude inventories. The spot price of crude netted a modest weekly gain. But the spot price of crude headed down on Monday on news of a slowdown in imports by China and on worries that the European debt crisis will spread to Italy. Prices rose more than $2 per barrel Tuesday on progress by ECB officials to resolve European sovereign debt issues. Also, a market survey posted a forecast for a drop in U.S. crude inventories.
After little change on Wednesday, crude dropped more than $2 per barrel after Bernanke squelched the idea of QE3. Prices firmed somewhat on Friday on a better-than-expected headline number for industrial production and ignoring the drop in consumer confidence.
Net for the week, spot prices for West Texas Intermediate firmed $1.04 per barrel to settle at $97.24. Current prices have risen from the recent low of $90.61 seen as the close for June 27.
The latest economic news has been disappointing for the most part, though headline inflation showed improvement.
 The consumer has moved closer to the sidelines. Overall retail sales in June edged up only 0.1 percent, following a 0.1 percent dip in May. A rebound in auto sales helped lift overall sales. Motor vehicle sales made a partial 0.8 percent rebound after dropping 1.8 percent in May. Both months’ sales were constrained by shortages of models dependent upon parts from Japan. The consumer has moved closer to the sidelines. Overall retail sales in June edged up only 0.1 percent, following a 0.1 percent dip in May. A rebound in auto sales helped lift overall sales. Motor vehicle sales made a partial 0.8 percent rebound after dropping 1.8 percent in May. Both months’ sales were constrained by shortages of models dependent upon parts from Japan.
Excluding autos, sales were flat, following a 0.2 percent gain in May. Here, components were mixed but softened largely by weak gasoline sales. Gasoline dropped 1.3 percent, following a 0.5 percent increase. Sales excluding autos and gasoline in June posted a modest 0.2 percent rise, matching the gain in May.
Outside of autos and gasoline, sales were mixed. The biggest gains were seen in building materials & garden equipment; clothing & accessories; and general merchandise stores. The largest decliners were furniture & home furnishing; sporting goods, hobby & book stores; and food services & drinking places. Retail sales on a year-ago basis in June posted at 8.1 percent, compared to 7.8 percent in May.
Essentially, overall retail sales in June were soft, mixed and about as expected. Other recent factors affecting spending were mixed. The latest initial jobless claims report is encouraging for future sales along with the resolution of supply constraints in the auto sector. However, consumer sentiment is growing increasingly wary.
 Consumers appear to have noticed that gasoline prices have nudged back up—and that the economy is still struggling. Consumer spirits have weakened sharply from already low levels so far this month according to the consumer sentiment index which fell to a more than two-year low of 63.8 at mid-month July compared to 71.5 for the final June reading. Expectations, the leading component, fell nine points to a 55.8 level that indicates wide pessimism over the economic outlook. Current conditions fell nearly six points to 76.3. Consumers appear to have noticed that gasoline prices have nudged back up—and that the economy is still struggling. Consumer spirits have weakened sharply from already low levels so far this month according to the consumer sentiment index which fell to a more than two-year low of 63.8 at mid-month July compared to 71.5 for the final June reading. Expectations, the leading component, fell nine points to a 55.8 level that indicates wide pessimism over the economic outlook. Current conditions fell nearly six points to 76.3.
In addition to gasoline prices edging back up, what can be worrying consumers' The short list includes continued weakness in the jobs market, whether Congress and the Administration can get their act together on the debt ceiling and long-term deficit reduction, and whether European sovereign debt problems will continue to weigh on their 401(k) balances. All considered, the American consumer is still holding up rather well but one should not expect this sector to be a leading source of strength for a while.
 Volatility in the utilities component has made it tricky to get a good read on this sector in recent months. Industrial production in June rose moderately, but mainly due to a rebound in the utilities component which rebounded 0.9 percent after dropping 2.0 percent in May. Overall industrial production in June advanced a modest 0.2 percent, following a 0.1 percent dip in May (originally up 0.1 percent). Volatility in the utilities component has made it tricky to get a good read on this sector in recent months. Industrial production in June rose moderately, but mainly due to a rebound in the utilities component which rebounded 0.9 percent after dropping 2.0 percent in May. Overall industrial production in June advanced a modest 0.2 percent, following a 0.1 percent dip in May (originally up 0.1 percent).
Manufacturing, however, was soft with no change after a 0.1 percent increase the month before (originally up 0.4 percent). The auto component, depressed by Japanese-related supply shortages, has pulled down on production with three consecutive declines. The auto component fell 2.0 percent in June, following a 0.3 percent decrease the month before. Excluding motor vehicles, manufacturing rose 0.2 percent, following a 0.1 percent uptick in May. Mining output, the report's third component, grew 0.5 percent after May's 0.7 percent increase.
Overall capacity utilization in June held steady at 76.7 percent. The June figure posted lower than analysts’ estimate for 76.9 percent.
Despite the rebound at the headline level, the overall report is somewhat disappointing given the flat number for manufacturing and downward revisions to May components. However, at least the weakness in autos is likely to be temporary.
 The first regional survey out for July is not encouraging. The Empire State headline index came in at minus 3.76 in July, a sub-zero reading indicating month-to-month contraction (albeit slight) in business conditions but still an improvement from minus 7.79 in June to indicate a slightly less severe rate of contraction. Shipments are a clear positive, showing monthly expansion at plus 2.22, compared to June's minus 8.02. Employment, at plus 1.11, also expanded though at a slower rate than June's 10.20. The first regional survey out for July is not encouraging. The Empire State headline index came in at minus 3.76 in July, a sub-zero reading indicating month-to-month contraction (albeit slight) in business conditions but still an improvement from minus 7.79 in June to indicate a slightly less severe rate of contraction. Shipments are a clear positive, showing monthly expansion at plus 2.22, compared to June's minus 8.02. Employment, at plus 1.11, also expanded though at a slower rate than June's 10.20.
Other readings are more downbeat including a minus 5.45 for new orders, the second negative reading in a row, and a minus 12.22 reading for unfilled orders that suggests manufacturers in the region are aggressively working down their backlog.
With the sluggish industrial production report for June and weak Empire number for July, traders will be giving extra attention to other regional reports, including Philly Fed next week, and durables orders late this month.
 The trade deficit unexpectedly worsened in May and sharply. Higher oil prices that month played a key role in the increased red ink. The May trade gap ballooned to $50.2 billion from a revised $43.6 billion in April (originally $46.7 billion). The May deficit was much larger than analysts’ estimate for $42.7 billion. Exports slipped 0.5 percent after improving 1.4 percent in April. Imports jumped 2.6 percent after edging down 0.3 percent the month before. The trade deficit unexpectedly worsened in May and sharply. Higher oil prices that month played a key role in the increased red ink. The May trade gap ballooned to $50.2 billion from a revised $43.6 billion in April (originally $46.7 billion). The May deficit was much larger than analysts’ estimate for $42.7 billion. Exports slipped 0.5 percent after improving 1.4 percent in April. Imports jumped 2.6 percent after edging down 0.3 percent the month before.
The widening in the trade deficit was led by the petroleum gap which expanded to $30.4 billion from $26.1 billion in April. For May, the price of imported oil jumped $5.52 per barrel to $108.70—the highest level since August 2008. Also, the physical quantity of oil imports jumped 9.1 percent to 275.3 million barrels for the month after plunging 14.5 percent in April. The prior month’s imports were atypically soft.
 The nonpetroleum goods shortfall worsened to $33.3 billion from $31.1 billion the prior month. The services surplus advanced to $14.7 billion from $14.5 billion in April. The nonpetroleum goods shortfall worsened to $33.3 billion from $31.1 billion the prior month. The services surplus advanced to $14.7 billion from $14.5 billion in April.
The trade deficit is draining funds from the U.S. economy faster than earlier believed. This will lead most economists to lower their forecast for second quarter GDP. However, oil prices have come down significantly since May and we are likely to see improvement in at least the petroleum gap for June. Looking for the silver lining, the boost in capital equipment imports may be a subtraction in GDP accounting, but it suggests some optimism on the part of businesses. The decline in goods exports also is disappointing but follows a jump in April and combined with a still low (though not as low as some weeks ago) dollar, exports likely are still on an uptrend.
 Headline and core inflation headed in opposite directions in June. The consumer price index in June dipped 0.2 percent, following a 0.2 percent increase the month before. With lower energy costs pulling down the CPI, this was the first negative number in 12 months. Excluding food and energy, the CPI rose 0.3 percent, equaling the May rate. Headline and core inflation headed in opposite directions in June. The consumer price index in June dipped 0.2 percent, following a 0.2 percent increase the month before. With lower energy costs pulling down the CPI, this was the first negative number in 12 months. Excluding food and energy, the CPI rose 0.3 percent, equaling the May rate.
 Turning to major components, energy dropped 4.4 percent, following a 1.0 percent decline. Gasoline fell 6.8 percent after decreasing 2.0 percent in May. Food price inflation slowed with a 0.2 percent gain after a 0.4 percent surge the month before.
Within the core new vehicles increased 0.6 percent, used cars and trucks jumped 1.6 percent, and apparel increased 1.4 percent in June. And owners’ equivalent rent is no longer as soft as in recent months, rising 0.2 percent.
Year-on-year, overall CPI inflation held steady at 3.4 percent (seasonally adjusted) in June. In contrast, the core rate firmed to 1.6 percent from 1.5 percent in May on a year-ago basis. On an unadjusted year-ago basis, the headline number was up 3.6 percent in June while the core was up 1.6 percent
The headline is good news but the strong core will give Fed officials pause on taking on more quantitative easing. However, the motor vehicle price gains are likely temporary and will cool a bit after supply shortages from Japan ease. In the other direction, crude oil and gasoline prices have turned back up a bit and headline inflation is not likely to be as favorable in July.
 In June, lower energy costs gave the economy a break. Producer price inflation in June turned negative with prices dropping 0.4 percent, following a relatively soft rise of 0.2 percent in May. The latest number came in lower than analysts’ forecast for a 0.3 percent decline. By major components, energy fell a sizeable 2.8 percent after rising 1.5 percent in May. Gasoline dropped 4.7 percent after rising 2.7 percent the prior month. Food costs rebounded 0.6, following a 1.4 percent dip the prior month. In June, lower energy costs gave the economy a break. Producer price inflation in June turned negative with prices dropping 0.4 percent, following a relatively soft rise of 0.2 percent in May. The latest number came in lower than analysts’ forecast for a 0.3 percent decline. By major components, energy fell a sizeable 2.8 percent after rising 1.5 percent in May. Gasoline dropped 4.7 percent after rising 2.7 percent the prior month. Food costs rebounded 0.6, following a 1.4 percent dip the prior month.
At the core level, PPI inflation bumped up to 0.3 percent from 0.2 percent in May to top the median forecast of 0.2 percent. Almost half of the June rise can be traced to prices for light motor trucks, which increased 1.6 percent, following a 0.6 percent decline. Prices for this subcomponent likely were supported by shortages of models dependent on parts from Japan.
For the overall PPI, the year-ago pace in June came in at 7.0 percent, matching the rate in May (seasonally adjusted). The core rate in June firmed to 2.3 percent from a year-on-year rate of 2.1 percent the month before. On a not seasonally adjusted basis for June, the year-ago the headline PPI was up 7.0 percent while the core was up 2.4 percent.
Equities were whipsawed a bit this week by conflicting signals from the Fed on whether there will be a third round of quantitative easing now that QE2 concluded at the end of June. This past week’s release of the minutes of the June 21-22 FOMC meeting unexpectedly gave a first hint that QE3 may be in the offering. For the first time, some FOMC participants argued that QE3 might be appropriate if the recovery remains too slow. The argument appeared to be very tentative and offered by a small number of participants. On this headline, equities rose modestly. However, others at the meeting countered that QE3 would do little to help the economy. All saw the likelihood of a pickup in growth in coming quarters.
Then on Wednesday, in the first day of his semi-annual appearance before Congress (first before the House), Chairman Bernanke said the Fed has not run out of bullets to boost the economy. Conditioning his statement that if a further easing is needed, the Fed could cut the rate paid on reserves. But maintaining a balanced position, he also stated that the Fed could exit from its expanded balance sheet sooner if appropriate. He noted that although QE2 has ended, the Fed's elevated level of holdings is still depressing interest rates. Bernanke believes that the recent run up in inflation and the current slowdown are temporary. When asked what if the debt ceiling is not raised, Bernanke stated it would create "a huge financial calamity." He said he is certain we would lose jobs, not gain jobs, if the ceiling is not raised.
But markets continued to interpret Bernanke’s comments to confirm that QE3 is in the making. The Fed chief—and likely other Fed officials—were not happy with the markets’ interpretation that QE3 is coming soon. He disabused the markets of this notion with his testimony before the Senate on Thursday.
Bernanke reiterated that the US central bank would be ready to inject more money should the economy worsen. But he said that the time had not come yet and he noted inflation had picked up since late 2010. The bottom line is that Bernanke indicated that the Fed has no current plan to implement another quantitative easing even though the Fed can if needed. Stocks fell significantly on the clarification by Bernanke.
 The Fed may not be pushing another round of quantitative easing for more than one reason. They maintain the position that current economic weakness is transitory—partly due to supply disruptions from Japan. But they also may be keeping a close watch on the money supply. M2—which includes cash, checking accounts, savings accounts, and some investment accounts—has surged sharply over the last two weeks. The Fed may not be pushing another round of quantitative easing for more than one reason. They maintain the position that current economic weakness is transitory—partly due to supply disruptions from Japan. But they also may be keeping a close watch on the money supply. M2—which includes cash, checking accounts, savings accounts, and some investment accounts—has surged sharply over the last two weeks.
The expanded definition of money supply jumped $88.7 billion in the week ending July 4, following a surge of $76.9 the prior week. These numbers are sharply higher than M2 gains in prior weeks that fell in a range of about $8 billion to $30 billion. Money supply expands as banks lend money from their reserves. The latest money supply figures suggest that lending is picking up. M2 is now up a sharp 7.9 percent on a year ago basis, compared to up less than 5 percent just as recently as early April of this year.
This past week’s economic news clearly was on the soft side. Economists are likely nudging down their forecasts for second quarter GDP and mulling over what to do about the out quarters. Meanwhile, earnings are the big positive, indicating the businesses are in better condition than earlier believed. For now, economic momentum teeters on politics—whether there is timely resolution of the U.S. federal budget debt ceiling and whether European sovereign debt problems are favorably addressed.
Although this week’s calendar is relatively light, investors will focus on key housing data. Housing starts are on tap for Tuesday, existing home sales will post at mid-week with FHFA house prices on Thursday. Also garnering market attention Thursday are jobless claims, Philly Fed manufacturing, and leading indicators.
Housing starts in May rebounded 3.5 percent, following an 8.8 percent drop in April. May’s annualized pace of 0.560 million units was down 3.4 percent on a year-ago basis. The gain in May was led by a 3.7 percent rebound in the single-family component, following a 3.3 percent decline in April. The volatile multifamily component made a partial comeback, rising 2.9 percent after falling 21.7 percent the month before. Housing permits pointed to a little more optimism on the part of homebuilders, jumping 8.7 percent in May, following a 1.9 percent decrease in April. But the fundamentals are unchanged. There is still enormous supply on the market and labor markets are weak, keeping potential homebuyers on the sidelines.
Housing starts Consensus Forecast for June 11: 575 million-unit rate
Range: 550 million to 600 million-unit rate
Existing home sales fell 3.8 percent in May to a 4.81 million annual rate. The year-on-year rate deepened to minus 15.3 percent from April's minus 13.8 percent. Months’ supply rose to 9.3 months from April's 9.0 months. Prices did rise 3.4 percent for the median to $166,500 but the heavy supply does not point to much pricing power in the months ahead. However, severe weather may have played a role as the month's sales contraction. Looking ahead, we may get a bump up in sales in June as May’s pending existing home sales surged 8.2 percent (though following a large 11.3 percent plunge the month before).
Existing home sales Consensus Forecast for June 11: 4.90 million-unit rate
Range: 4.80 to 5.20 million-unit rate
Initial jobless claims in the July 9 week fell 22,000 to a level of 405,000 but the period is a shortened one that includes the July 4 holiday. Another factor is uncertainty over the week-to-week timing of shutdowns, including auto retooling, in the manufacturing sector, a seasonal factor that lowers claims after adjustment and always makes for uncertain readings at this time of year. One factor that clearly inflated claims was the government shutdown in Minnesota which added 11,500, before adjustment, to the week's total. A look at the four-week average, especially important for uncertain periods, is favorable, down 3,750 to 423,250.
Jobless Claims Consensus Forecast for 7/16/11: 415,000
Range: 385,000 to 430,000
The general business conditions index of the Philadelphia Fed's Business Outlook Survey for June posted at minus 7.7 for the first negative reading since September and was down 11.6 points from May. Weakness stood out in new orders at minus 7.6 and down from a reading of 5.4 and unfilled orders at minus 16.3 and down from minus 7.8. Shipments and employment both rose in the month but at a slower rate. The decline in orders points to further slowing, if not contraction, in the near term.
Philadelphia Fed survey Consensus Forecast for July 11: 5.0
Range: -4.8 to 10.0
The FHFA home price index in April unexpectedly rose, breaking a string of monthly declines. The FHFA purchase only house price index rose 0.8 percent in April, following a 0.4 percent decrease in March. April’s gain followed six consecutive monthly losses. On a year-on-year basis, the FHFA HPI is down 5.7 percent versus down 6.2 percent in March.
The Conference Board's index of leading indicators jumped 0.8 percent in May, following a 0.4 percent decline the month before. As usual for many months, the rate spread between the 10-year T-note and fed funds rate led strength for the month, adding 0.32 percentage points. Next, consumer expectations added 0.23 percentage points with building permits contributing 0.22 percentage points to the overall index gain. Positives also came from lower initial jobless claims and increases in new orders for consumer goods, new orders for nondefense capital goods, stock prices, and money supply. The only negative contribution came from vendor performance. The average workweek in manufacturing had a zero contribution. The coincident index has been sluggish in recent months, edging up only 0.1 percent in both May and April.
Leading indicators Consensus Forecast for June 11: +0.3 percent
Range: +0.1 to +0.6 percent
R. Mark Rogers is the author of The Complete Idiot’s Guide to Economic Indicators, Penguin Books, 2009.
Econoday Senior Writer Mark Pender contributed to this article.
|
