|
Equities were mostly lower last week as continuing sovereign debt worries in Europe combined with the U.S. debt ceiling impasse are making investors cautious about taking on risk. Investors listened attentively to the Fed chairman’s two days of Congressional testimony for signs that the Fed would launch QE3. And while Ben Bernanke said that the Fed still has some tools to use should the economy worsen, he isn't yet prepared to intervene.
Tensions built at week’s end as investors in Europe awaited the results of bank stress tests. The results were released after markets ended their trading week. And the budget ceiling deadlock in the U.S. garnered greater investor attention after Moody’s and S&P warned that the U.S. government may lose the Aaa credit rating it has held since 1917.
|
|
2010 |
2011 |
% Change |
|
Index |
Dec. 31 |
July 8 |
July 15 |
Week |
Year |
| Asia/Pacific |
|
|
|
|
|
|
| Australia |
All Ordinaries |
4846.9 |
4716.0 |
4542.7 |
-3.7% |
-6.3% |
| Japan |
Nikkei 225 |
10228.9 |
10137.7 |
9974.5 |
-1.6% |
-2.5% |
|
Topix |
898.8 |
874.3 |
859.4 |
-1.7% |
-4.4% |
| Hong Kong |
Hang Seng |
23035.5 |
22726.4 |
21875.4 |
-3.7% |
-5.0% |
| S. Korea |
Kospi |
2051.0 |
2180.4 |
2145.2 |
-1.6% |
4.6% |
| Singapore |
STI |
3190.0 |
3151.3 |
3084.2 |
-2.1% |
-3.3% |
| China |
Shanghai Composite |
2808.1 |
2797.8 |
2820.2 |
0.8% |
2.2% |
|
|
|
|
|
|
|
| India |
Sensex 30 |
20509.1 |
18858.0 |
18561.9 |
-1.6% |
-9.5% |
| Indonesia |
Jakarta Composite |
3703.5 |
4003.7 |
4023.2 |
0.5% |
8.6% |
| Malaysia |
KLCI |
1518.9 |
1594.7 |
1577.3 |
-1.1% |
3.8% |
| Philippines |
PSEi |
4201.1 |
4391.5 |
4458.7 |
1.5% |
6.1% |
| Taiwan |
Taiex |
8972.5 |
8749.6 |
8574.9 |
-2.0% |
-4.4% |
| Thailand |
SET |
1032.8 |
1088.5 |
1079.9 |
-0.8% |
4.6% |
|
|
|
|
|
|
|
| Europe |
|
|
|
|
|
|
| UK |
FTSE 100 |
5899.9 |
5990.6 |
5843.7 |
-2.5% |
-1.0% |
| France |
CAC |
3804.8 |
3913.6 |
3726.6 |
-4.8% |
-2.1% |
| Germany |
XETRA DAX |
6914.2 |
7402.7 |
7220.1 |
-2.5% |
4.4% |
|
|
|
|
|
|
|
| North America |
|
|
|
|
|
|
| United States |
Dow |
11577.5 |
12657.2 |
12479.7 |
-1.4% |
7.8% |
|
NASDAQ |
2652.9 |
2859.8 |
2789.8 |
-2.4% |
5.2% |
|
S&P 500 |
1257.6 |
1343.8 |
1316.1 |
-2.1% |
4.7% |
| Canada |
S&P/TSX Comp. |
13443.2 |
13371.7 |
13299.5 |
-0.5% |
-1.1% |
| Mexico |
Bolsa |
38550.8 |
36499.9 |
36155.9 |
-0.9% |
-6.2% |
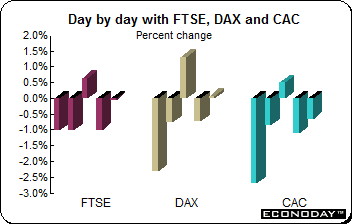 Equities, after a volatile week of trading, ended with losses. Investors honed in on the unresolved Greek debt package plus the further downgrading of Ireland’s debt rating as European officials continue to haggle over how to ease the region’s mounting sovereign debt problems. If this were not enough, worries about the crisis spreading to Spain and Italy also sent stocks lower. Tension about the results of the bank stress test results which were released after markets were closed for the week also loomed. Equities, after a volatile week of trading, ended with losses. Investors honed in on the unresolved Greek debt package plus the further downgrading of Ireland’s debt rating as European officials continue to haggle over how to ease the region’s mounting sovereign debt problems. If this were not enough, worries about the crisis spreading to Spain and Italy also sent stocks lower. Tension about the results of the bank stress test results which were released after markets were closed for the week also loomed.
The FTSE and DAX were 2.5 percent lower on the week while the CAC slumped 4.8 percent. Shares revived Wednesday on Fed Chairman Ben Bernanke’s Congressional testimony in which he said that the Fed has not run out of bullets to boost the economy. He conditioned his statement by saying that if a further easing is needed, the Fed could cut the rate paid on reserves. But investors had to wait for the second day of testimony when Bernanke said that the time has not come yet.
After markets closed here on Friday, the results of the latest stress tests on 91 European banks were released. Eight banks failed to pass the European Union’s "stress tests," with a combined shortfall of €2.5 billion in capital under a simulated worst-case economic scenario according to the European Banking Authority. They included five Spanish, two Greek and one Austrian bank. All were relatively small players. The EBA said that another 16 banks narrowly passed the tests, which examined the abilities of the top lenders across Europe to endure a deteriorating economy and strained financial system. By awarding, however, a relatively clean bill of health to the vast majority of Europe's banking sector, the tests are likely to be greeted with skepticism. Analysts and investors were bracing for as many as 20 banks to fail and the need to raise tens of billions of euros of new capital.
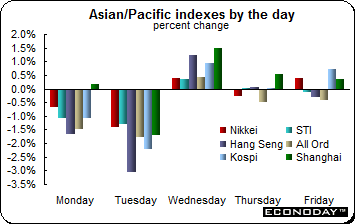 Most equities indexes dropped last week, pulled down by the slow progress in Europe as they try to resolve their sovereign debt crisis. Of those followed here, only the PSEi (1.5 percent), Jakarta Composite (0.5 percent) and Shanghai Composite (0.8 percent) were up on the week. Losses ranged from 0.8 percent (SET) to 3.7 percent (All Ordinaries and Hang Seng). Here too, the lack of resolution of the U.S. debt ceiling limit caught investor attention towards the end of the week as the deadline of August second approached. The declines on Monday were the belated reaction to the abysmal U.S. employment report released on July 8th. Shares were positive on Wednesday thanks to the better than anticipated growth and output data from China (see indicator scoreboard below). Most equities indexes dropped last week, pulled down by the slow progress in Europe as they try to resolve their sovereign debt crisis. Of those followed here, only the PSEi (1.5 percent), Jakarta Composite (0.5 percent) and Shanghai Composite (0.8 percent) were up on the week. Losses ranged from 0.8 percent (SET) to 3.7 percent (All Ordinaries and Hang Seng). Here too, the lack of resolution of the U.S. debt ceiling limit caught investor attention towards the end of the week as the deadline of August second approached. The declines on Monday were the belated reaction to the abysmal U.S. employment report released on July 8th. Shares were positive on Wednesday thanks to the better than anticipated growth and output data from China (see indicator scoreboard below).
Bank of Japan
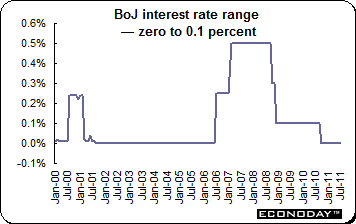 As universally expected, the Bank of Japan held its key interest rate at zero to 0.1 percent. The BoJ has been encouraged by the recent bright economic spots, such as the faster than expected recovery of the supply chain and industrial production. The monetary policy board upgraded its assessment of the economy from its view in June. The MPB noted that output is showing clear signs of picking up and that exports have picked up as well. Domestic private demand has improved along with consumer and business sentiment. The BoJ thinks that the economy will return to a recovery path in the second half of the year. As universally expected, the Bank of Japan held its key interest rate at zero to 0.1 percent. The BoJ has been encouraged by the recent bright economic spots, such as the faster than expected recovery of the supply chain and industrial production. The monetary policy board upgraded its assessment of the economy from its view in June. The MPB noted that output is showing clear signs of picking up and that exports have picked up as well. Domestic private demand has improved along with consumer and business sentiment. The BoJ thinks that the economy will return to a recovery path in the second half of the year.
The Bank said developments in the U.S. and European economies were among risks for the outlook. The BOJ cut its growth forecast for the year ending March 2012 to 0.4 percent from an April estimate of 0.6 percent. It kept its predictions for a 2.9 percent expansion in the following year and inflation of 0.7 percent for both fiscal 2011 and fiscal 2012. BoJ governor Masaaki Shirakawa said he is ‘very concerned’ about power shortages prompting companies to move factories overseas, lowering the nation’s growth potential.
Bank of Korea
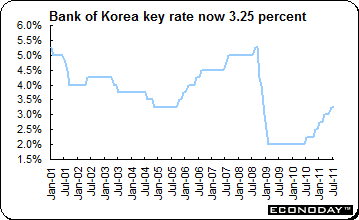 The Bank of Korea on Thursday decided to keep interest rates unchanged at the current level of 3.25 percent, in line with analyst expectations, as external economic uncertainties like the sovereign debt problems in Europe and a weak U.S. economy continue to pose downside risks to the global economy. The Bank downgraded its economic growth forecast for this year, but revised its inflation outlook upward. The BoK said consumer prices are likely to rise 4 percent this year, slightly up from the earlier 3.9 percent estimate made in April owing to higher oil and food prices. The growth projection for this year has been lowered to 4.3 percent compared with the 4.5 percent growth estimate in April. The Bank of Korea on Thursday decided to keep interest rates unchanged at the current level of 3.25 percent, in line with analyst expectations, as external economic uncertainties like the sovereign debt problems in Europe and a weak U.S. economy continue to pose downside risks to the global economy. The Bank downgraded its economic growth forecast for this year, but revised its inflation outlook upward. The BoK said consumer prices are likely to rise 4 percent this year, slightly up from the earlier 3.9 percent estimate made in April owing to higher oil and food prices. The growth projection for this year has been lowered to 4.3 percent compared with the 4.5 percent growth estimate in April.
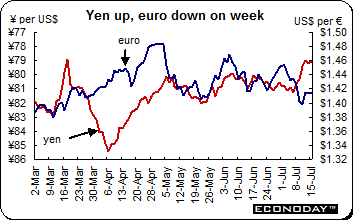 The U.S. dollar was decidedly mixed against its major counterparts last week. The currency sank against the safe haven currencies of the yen and Swiss franc. It also declined against the pound sterling and Canadian dollar. However, it was up against the euro and Australian dollar. The fluctuations in the euro dollar were a reflection of continuing worries about resolution of the eurozone sovereign risk problem. The euro weakened after Moody’s lowered Ireland’s sovereign debt rating, adding to concern the European debt crisis is deepening. Ireland’s credit rating was cut to non-investment grade joining Portugal and Greece as the third euro-area country to be lowered to junk. The U.S. dollar was decidedly mixed against its major counterparts last week. The currency sank against the safe haven currencies of the yen and Swiss franc. It also declined against the pound sterling and Canadian dollar. However, it was up against the euro and Australian dollar. The fluctuations in the euro dollar were a reflection of continuing worries about resolution of the eurozone sovereign risk problem. The euro weakened after Moody’s lowered Ireland’s sovereign debt rating, adding to concern the European debt crisis is deepening. Ireland’s credit rating was cut to non-investment grade joining Portugal and Greece as the third euro-area country to be lowered to junk.
However, the U.S. dollar had its own set of issues. Traders focused on Fed Chairman Ben Bernanke’s Congressional testimony. The dollar swooned on Wednesday when Bernanke reassured markets that the Fed still had tools in its arsenal should the economy worsen. However on Thursday, he clarified his statement and said there are no plans for additional bond purchases. The dollar was broadly higher as traders seized on these remarks to signal that there was less chance of quantitative easing than they had understood from his comments on Wednesday.
Selected currencies — weekly results
|
|
2010 |
2011 |
% Change |
|
|
Dec 31 |
July 8 |
July 15 |
Week |
2011 |
| U.S. $ per currency |
|
|
|
|
|
|
| Australia |
A$ |
1.022 |
1.075 |
1.065 |
-1.0% |
4.2% |
| New Zealand |
NZ$ |
0.779 |
0.837 |
0.847 |
1.2% |
8.7% |
| Canada |
C$ |
1.003 |
1.041 |
1.048 |
0.7% |
4.5% |
| Eurozone |
euro (€) |
1.337 |
1.425 |
1.415 |
-0.8% |
5.8% |
| UK |
pound sterling (£) |
1.560 |
1.604 |
1.613 |
0.6% |
3.4% |
|
|
|
|
|
|
|
| Currency per U.S. $ |
|
|
|
|
|
|
| China |
yuan |
6.607 |
6.465 |
6.464 |
0.0% |
2.2% |
| Hong Kong |
HK$* |
7.773 |
7.782 |
7.794 |
-0.2% |
-0.3% |
| India |
rupee |
44.705 |
44.328 |
44.518 |
-0.4% |
0.4% |
| Japan |
yen |
81.230 |
80.633 |
79.074 |
2.0% |
2.7% |
| Malaysia |
ringgit |
3.064 |
2.992 |
3.007 |
-0.5% |
1.9% |
| Singapore |
Singapore $ |
1.283 |
1.221 |
1.219 |
0.2% |
5.2% |
| South Korea |
won |
1126.000 |
1057.070 |
1057.950 |
-0.1% |
6.4% |
| Taiwan |
Taiwan $ |
29.299 |
28.761 |
28.883 |
-0.4% |
1.4% |
| Thailand |
baht |
30.060 |
30.220 |
30.055 |
0.5% |
0.0% |
| Switzerland |
Swiss franc |
0.934 |
0.837 |
0.814 |
2.8% |
14.7% |
| *Pegged to U.S. dollar |
|
|
|
|
|
|
| Source: Bloomberg |
|
|
|
|
|
|
 May industrial production edged up 0.1 percent and was up 4.0 percent on the year. The relative weakness reflected a 0.5 percent monthly decline in nondurable consumer goods output and a 0.4 percent drop in durable consumer goods. Intermediates contracted 0.1 percent for the second month in a row but declines here were just about offset by gains in both capital goods (0.6 percent) and energy (0.9 percent). The larger four EMU producers did well with May output up 2.0 percent on the month in France, 0.5 percent in Germany and 0.4 percent in Spain. However, Italy posted a 0.6 percent decline. May industrial production edged up 0.1 percent and was up 4.0 percent on the year. The relative weakness reflected a 0.5 percent monthly decline in nondurable consumer goods output and a 0.4 percent drop in durable consumer goods. Intermediates contracted 0.1 percent for the second month in a row but declines here were just about offset by gains in both capital goods (0.6 percent) and energy (0.9 percent). The larger four EMU producers did well with May output up 2.0 percent on the month in France, 0.5 percent in Germany and 0.4 percent in Spain. However, Italy posted a 0.6 percent decline.
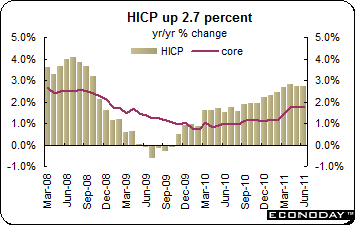 June harmonized index of consumer prices was unchanged on the month and up 2.7 percent on the year. However, two of the three key core indexes posted a slight acceleration. Excluding food, drink, tobacco & energy, the annual HICP rate was up 1.6 percent, up a tick from last time. Similarly, omitting just unprocessed food & energy the rate crept 0.1 percentage points firmer to 1.8 percent. Only the HICP without seasonal foods & energy held steady at a 1.8 percent 12-monthly rate. Upward pressure on the annual headline rate was derived from small gains in a number of sectors including housing, household equipment & health, and slightly larger advances in hotels & restaurants and recreation & culture. Energy prices were up 10.9 percent on the year after an 11.1 percent increase in May. The largest negative influence came from clothing where prices were up 1.0 percent from a year ago or 0.5 percentage points less than last time. The pace of deflation in the communications area also accelerated. June harmonized index of consumer prices was unchanged on the month and up 2.7 percent on the year. However, two of the three key core indexes posted a slight acceleration. Excluding food, drink, tobacco & energy, the annual HICP rate was up 1.6 percent, up a tick from last time. Similarly, omitting just unprocessed food & energy the rate crept 0.1 percentage points firmer to 1.8 percent. Only the HICP without seasonal foods & energy held steady at a 1.8 percent 12-monthly rate. Upward pressure on the annual headline rate was derived from small gains in a number of sectors including housing, household equipment & health, and slightly larger advances in hotels & restaurants and recreation & culture. Energy prices were up 10.9 percent on the year after an 11.1 percent increase in May. The largest negative influence came from clothing where prices were up 1.0 percent from a year ago or 0.5 percentage points less than last time. The pace of deflation in the communications area also accelerated.
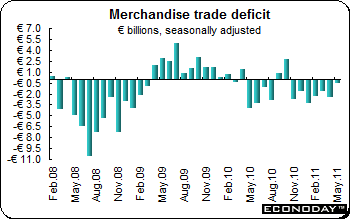 May seasonally adjusted merchandise trade deficit was €0.6 billion — the best performance so far in 2011. The latest shortfall compares with a downwardly revised €2.5 billion deficit in April. The unadjusted figures show a zero balance, and constitute a sharp improvement on the €4.9 billion shortfall recorded in the same month last year. The improvement in the seasonally adjusted balance was due to a 1.5 percent monthly gain in nominal exports, the largest increase since January, which easily more than offset a 0.2 percent advance in imports. Exports were 21.0 percent firmer on the year while imports showed annual growth of 16.0 percent. Compared with the start of the quarter, Germany (€9.2 billion) added an extra €0.7 billion to the overall bottom line and there were reduced deficits in both Italy (€2.2 billion) and Spain (€3.1 billion). However, the French shortfall (€0.7 billion) was €0.5 billion larger. May seasonally adjusted merchandise trade deficit was €0.6 billion — the best performance so far in 2011. The latest shortfall compares with a downwardly revised €2.5 billion deficit in April. The unadjusted figures show a zero balance, and constitute a sharp improvement on the €4.9 billion shortfall recorded in the same month last year. The improvement in the seasonally adjusted balance was due to a 1.5 percent monthly gain in nominal exports, the largest increase since January, which easily more than offset a 0.2 percent advance in imports. Exports were 21.0 percent firmer on the year while imports showed annual growth of 16.0 percent. Compared with the start of the quarter, Germany (€9.2 billion) added an extra €0.7 billion to the overall bottom line and there were reduced deficits in both Italy (€2.2 billion) and Spain (€3.1 billion). However, the French shortfall (€0.7 billion) was €0.5 billion larger.
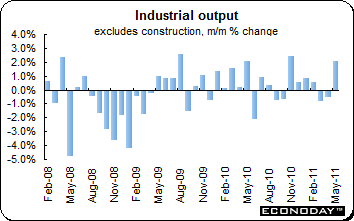 May industrial production surged 2.0 percent and was up 2.6 percent on the year. Manufacturing output was up 1.5 percent, reflecting solid advances in coke & refined products (3.4 percent), electronic & machine equipment (2.3 percent) and transport equipment (2.6 percent). The other manufacturing category (1.4 percent) also posted a healthy gain. Overall production was also lifted by a 5.7 percent jump in the erratic mining, quarrying & utilities area although construction was off 1.0 percent. May industrial production surged 2.0 percent and was up 2.6 percent on the year. Manufacturing output was up 1.5 percent, reflecting solid advances in coke & refined products (3.4 percent), electronic & machine equipment (2.3 percent) and transport equipment (2.6 percent). The other manufacturing category (1.4 percent) also posted a healthy gain. Overall production was also lifted by a 5.7 percent jump in the erratic mining, quarrying & utilities area although construction was off 1.0 percent.
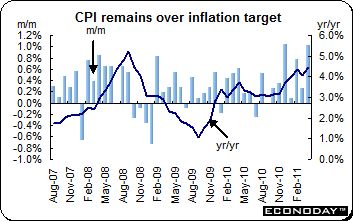 June consumer price index was down 0.1 percent and was up 4.2 percent on the year. The 12-month inflation rate was the lowest since March. The monthly drop in the headline index was the first since June 2003 but even more significant for the BoE will be an even steeper 0.2 percent decline in the core index. This reduced the underlying annual inflation rate by 0.5 percentage points to 2.8 percent, the lowest core rate since November last year. Weakness in June was particularly pronounced in the clothing & footwear area where prices fell nearly 2 percent on the month. There were also marked declines in alcohol & tobacco (0.6 percent), communication (0.9 percent) and recreation & culture (0.9 percent). The largest increase was seen in food & soft drinks (0.9 percent) followed by furniture & household equipment (0.4 percent). June consumer price index was down 0.1 percent and was up 4.2 percent on the year. The 12-month inflation rate was the lowest since March. The monthly drop in the headline index was the first since June 2003 but even more significant for the BoE will be an even steeper 0.2 percent decline in the core index. This reduced the underlying annual inflation rate by 0.5 percentage points to 2.8 percent, the lowest core rate since November last year. Weakness in June was particularly pronounced in the clothing & footwear area where prices fell nearly 2 percent on the month. There were also marked declines in alcohol & tobacco (0.6 percent), communication (0.9 percent) and recreation & culture (0.9 percent). The largest increase was seen in food & soft drinks (0.9 percent) followed by furniture & household equipment (0.4 percent).
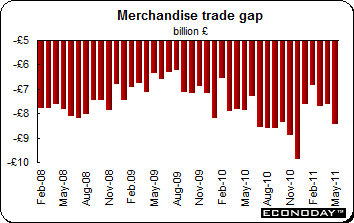 May merchandise trade gap unexpectedly widened out by almost Stg1 billion to Stg8.5 billion. The increase in the red ink reflected a 5.8 percent monthly jump in nominal imports that comfortably eclipsed an otherwise very respectable 4.2 percent gain in exports. The deterioration in the headline figures was more than matched in the underlying data which showed the deficit excluding oil & erratics surging from Stg6.8 billion in April to Stg8.4 billion. The sharp worsening here was attributable to a 7 percent leap in imports, the largest monthly gain since April 1997. Regionally the shortfall with the rest of the EU increased from Stg3.1 billion to Stg3.4 billion and with non-EU countries from Stg4.5 billion to Stg5.1 billion. Record imports of chemicals and clothing and footwear were the main culprits. May merchandise trade gap unexpectedly widened out by almost Stg1 billion to Stg8.5 billion. The increase in the red ink reflected a 5.8 percent monthly jump in nominal imports that comfortably eclipsed an otherwise very respectable 4.2 percent gain in exports. The deterioration in the headline figures was more than matched in the underlying data which showed the deficit excluding oil & erratics surging from Stg6.8 billion in April to Stg8.4 billion. The sharp worsening here was attributable to a 7 percent leap in imports, the largest monthly gain since April 1997. Regionally the shortfall with the rest of the EU increased from Stg3.1 billion to Stg3.4 billion and with non-EU countries from Stg4.5 billion to Stg5.1 billion. Record imports of chemicals and clothing and footwear were the main culprits.
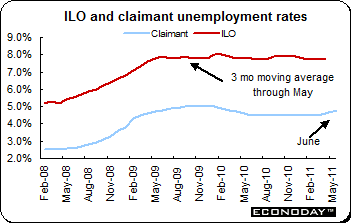 June claimant unemployment count jumped by 24,500, its steepest gain since May 2009 and enough to lift the number of people out of work above the psychologically important 1.5 million mark for the first time since April last year. The originally reported 19,600 increase in May was revised up to a 22,500 advance. The jobless rate was adjusted 0.1 percentage point higher to 4.7 percent where it remained in June. By contrast the ILO definition showed unemployment declining a further 26,000 over the three months to May and suggest that the demand for labour is actually holding up quite well. The jobless rate on this measure was 7.7 percent. Headline average earnings growth accelerated to 2.3 percent from a stronger revised 2.0 percent rate in April but was still well below the sort of pace that would suggest wages are responding to above target inflation. Larger bonus payments in the financial sector were the main cause of the overall pick-up. June claimant unemployment count jumped by 24,500, its steepest gain since May 2009 and enough to lift the number of people out of work above the psychologically important 1.5 million mark for the first time since April last year. The originally reported 19,600 increase in May was revised up to a 22,500 advance. The jobless rate was adjusted 0.1 percentage point higher to 4.7 percent where it remained in June. By contrast the ILO definition showed unemployment declining a further 26,000 over the three months to May and suggest that the demand for labour is actually holding up quite well. The jobless rate on this measure was 7.7 percent. Headline average earnings growth accelerated to 2.3 percent from a stronger revised 2.0 percent rate in April but was still well below the sort of pace that would suggest wages are responding to above target inflation. Larger bonus payments in the financial sector were the main cause of the overall pick-up.
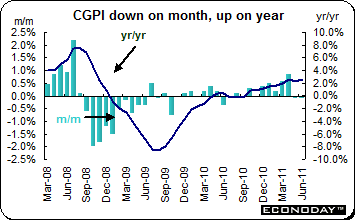 June corporate goods price index edged 0.1 percent lower on the month and was up 2.5 percent on the year. On the year this was the ninth consecutive increase but the second monthly decline in a row. Manufacturing prices were up 2.5 percent on the year. Within manufacturing, petroleum & coal products shot up 16.6 percent while nonferrous metals jumped by 9.7 percent. Other price increases were more muted. Information & communications equipment prices led declines, dropping 6.5 percent on the year while electronic components & devises were down 3.0 percent. Prices also declined for precision instruments, electrical machinery & equipment and plastic goods. June corporate goods price index edged 0.1 percent lower on the month and was up 2.5 percent on the year. On the year this was the ninth consecutive increase but the second monthly decline in a row. Manufacturing prices were up 2.5 percent on the year. Within manufacturing, petroleum & coal products shot up 16.6 percent while nonferrous metals jumped by 9.7 percent. Other price increases were more muted. Information & communications equipment prices led declines, dropping 6.5 percent on the year while electronic components & devises were down 3.0 percent. Prices also declined for precision instruments, electrical machinery & equipment and plastic goods.
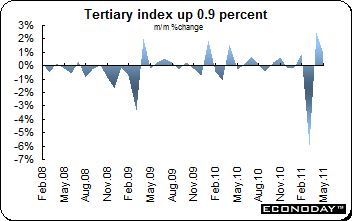 May tertiary index was up 0.9 percent after rising a revised 2.4 percent in April. On the year, the index was down 0.9 percent after sinking 2.1 percent the previous month. Wholesale & retail trade was up 2.7 percent, living related & personal service & amusement services jumped 6.4 percent, accommodations, eating & drinking services advanced 4.1 percent, real estate & goods rental & leasing was up 1.7 percent, learning support gained 0.5 percent and electricity, gas, heat supply & water edged up 0.1 percent. Industries that declined included scientific research, professional & technical services (down 2.5 percent), information & communications (down 1.1 percent), miscellaneous services (except government services etc.) was down 1.6 percent while medical, health care & welfare was down 0.4 percent and compound services lost 1.9 percent. May tertiary index was up 0.9 percent after rising a revised 2.4 percent in April. On the year, the index was down 0.9 percent after sinking 2.1 percent the previous month. Wholesale & retail trade was up 2.7 percent, living related & personal service & amusement services jumped 6.4 percent, accommodations, eating & drinking services advanced 4.1 percent, real estate & goods rental & leasing was up 1.7 percent, learning support gained 0.5 percent and electricity, gas, heat supply & water edged up 0.1 percent. Industries that declined included scientific research, professional & technical services (down 2.5 percent), information & communications (down 1.1 percent), miscellaneous services (except government services etc.) was down 1.6 percent while medical, health care & welfare was down 0.4 percent and compound services lost 1.9 percent.
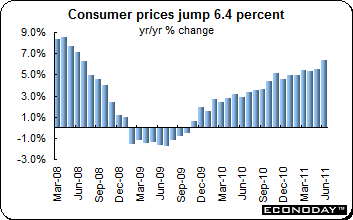 June consumer prices were up 0.3 percent on the month but soared 6.4 percent on the year. The CPI is the highest since June 2008. In May, prices were up 5.5 percent. The People’s Bank of China increased its key interest rate last week to contain inflation. Food prices soared 14.4 percent on the year after climbing 11.7 percent the month before while housing costs jumped 6.2 percent after increasing 6.1 percent in May. June consumer prices were up 0.3 percent on the month but soared 6.4 percent on the year. The CPI is the highest since June 2008. In May, prices were up 5.5 percent. The People’s Bank of China increased its key interest rate last week to contain inflation. Food prices soared 14.4 percent on the year after climbing 11.7 percent the month before while housing costs jumped 6.2 percent after increasing 6.1 percent in May.
 June producer prices were unchanged on the month but jumped 7.1 percent on the year after rising 6.8 percent last month. Analysts expected the PPI to be up 7.0 percent. All categories except durable goods (down 0.5 percent) were up with many in double digits. Mining and exploration prices were up 16.7 percent while raw materials increased by 11.1 percent. Non-ferrous metals soared 17.32 percent while fuel & power were up 12.0 percent and raw chemical materials were up 12.5 percent. June producer prices were unchanged on the month but jumped 7.1 percent on the year after rising 6.8 percent last month. Analysts expected the PPI to be up 7.0 percent. All categories except durable goods (down 0.5 percent) were up with many in double digits. Mining and exploration prices were up 16.7 percent while raw materials increased by 11.1 percent. Non-ferrous metals soared 17.32 percent while fuel & power were up 12.0 percent and raw chemical materials were up 12.5 percent.
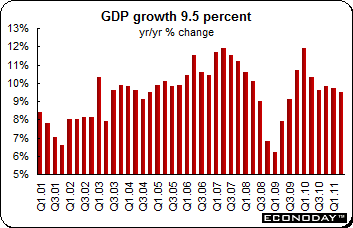 Second quarter gross domestic product growth eased to an increase of 9.5 percent on the year, an as-expected result after rising 9.7 percent in the first quarter. When compared with a year ago, GDP was up 9.6 percent in the first half of 2011. The economy expanded 2.2 percent from the previous quarter on a seasonally adjusted basis. Second quarter gross domestic product growth eased to an increase of 9.5 percent on the year, an as-expected result after rising 9.7 percent in the first quarter. When compared with a year ago, GDP was up 9.6 percent in the first half of 2011. The economy expanded 2.2 percent from the previous quarter on a seasonally adjusted basis.
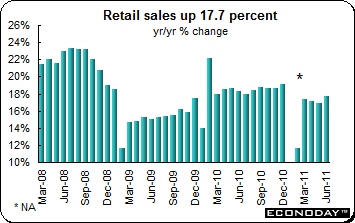 June retail sales were up 1.38 percent on the month and 17.7 percent on the year. In May sales were up 16.9 percent on the year. Urban retail sales were up 17.8 percent while rural sales were up 16.8 percent on the year. Grain & food oil sales were up 27.9 percent after increasing 24.2 percent in May on the year. Auto sales were up 16.9 percent after increasing 13.6 percent in May. Oil & oil products sales eased to an increase of 39.5 percent from 42.3 percent in May. June retail sales were up 1.38 percent on the month and 17.7 percent on the year. In May sales were up 16.9 percent on the year. Urban retail sales were up 17.8 percent while rural sales were up 16.8 percent on the year. Grain & food oil sales were up 27.9 percent after increasing 24.2 percent in May on the year. Auto sales were up 16.9 percent after increasing 13.6 percent in May. Oil & oil products sales eased to an increase of 39.5 percent from 42.3 percent in May.
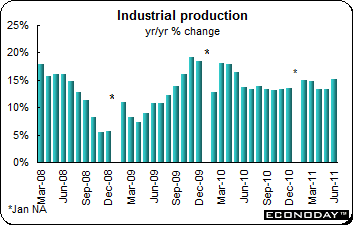 June industrial production was up 1.48 percent on the month and 15.1 percent on the year. The annual increase compares with May’s gain of 13.3 percent. For the year to date, output was up 14.3 percent when compared with the same months a year ago. All sub-categories except general equipment grew at a faster rate than in May when compared with a year ago. Transport equipment was up 10.7 percent in June after increasing 7.8 percent in May. Pig iron increased 11.6 percent after 6.4 percent in May. Steel products were up 14.8 percent after increasing 10.6 percent in the previous month. June industrial production was up 1.48 percent on the month and 15.1 percent on the year. The annual increase compares with May’s gain of 13.3 percent. For the year to date, output was up 14.3 percent when compared with the same months a year ago. All sub-categories except general equipment grew at a faster rate than in May when compared with a year ago. Transport equipment was up 10.7 percent in June after increasing 7.8 percent in May. Pig iron increased 11.6 percent after 6.4 percent in May. Steel products were up 14.8 percent after increasing 10.6 percent in the previous month.
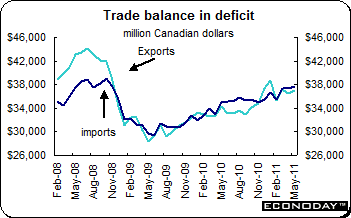 May seasonally adjusted merchandise trade deficit narrowed from a slightly smaller revised C$0.86 billion in April to C$0.81 billion. The minor improvement reflected a monthly 1.2 percent increase in nominal exports that just edged out a 1.1 percent increase in imports. The real trade balance made more progress with export volumes up 1.5 percent when compared to April and a 1.0 percent drop in imports. Nominal exports to the U.S. crept just 0.1 percent higher on the month leaving most of the headline gain attributable to a 15.6 percent jump in sales to the EU. With imports from the U.S. up 1.1 percent, the bilateral surplus with the U.S. narrowed by just over C$0.2 billion to C$3.7 billion. Across the major exporting industries performances were very mixed. On the positive side, machinery & equipment (4.8 percent), industrial goods & materials (4.0 percent), autos (3.9 percent) as well as the other consumer goods category (9.2 percent) all performed well on the month. However, there were declines in energy products (3.6 percent), forestry products (1.4 percent) and agricultural & fishing products (2.9 percent). Imports were boosted versus April mainly by gains in autos (3.6 percent) and industrial goods & materials (2.2 percent). Other sectors typically saw much smaller gains and energy (down 5.2 percent) was weak. May seasonally adjusted merchandise trade deficit narrowed from a slightly smaller revised C$0.86 billion in April to C$0.81 billion. The minor improvement reflected a monthly 1.2 percent increase in nominal exports that just edged out a 1.1 percent increase in imports. The real trade balance made more progress with export volumes up 1.5 percent when compared to April and a 1.0 percent drop in imports. Nominal exports to the U.S. crept just 0.1 percent higher on the month leaving most of the headline gain attributable to a 15.6 percent jump in sales to the EU. With imports from the U.S. up 1.1 percent, the bilateral surplus with the U.S. narrowed by just over C$0.2 billion to C$3.7 billion. Across the major exporting industries performances were very mixed. On the positive side, machinery & equipment (4.8 percent), industrial goods & materials (4.0 percent), autos (3.9 percent) as well as the other consumer goods category (9.2 percent) all performed well on the month. However, there were declines in energy products (3.6 percent), forestry products (1.4 percent) and agricultural & fishing products (2.9 percent). Imports were boosted versus April mainly by gains in autos (3.6 percent) and industrial goods & materials (2.2 percent). Other sectors typically saw much smaller gains and energy (down 5.2 percent) was weak.
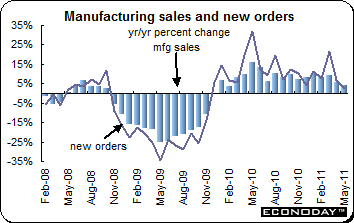 May manufacturing sales declined 0.8 percent to $46.0 billion in May. On the year sales were up 4.0 percent. Manufacturing sales volumes also declined 0.8 percent in May. The decline in current dollar sales reflected a 2.4 percent drop in the nondurable goods. The declines were mostly concentrated in the food, petroleum & coal product and chemical industries. In contrast, the durable goods industries were up 0.8 percent in May. Lower sales were reported in 11 of 21 industries, representing 71.9 percent of total manufacturing. Sales in the food industry declined 3.1 percent. The drop was partly attributable to lower sales in the dairy product industry. Petroleum & coal products also reported a 2.5 percent decrease in sales. The decline in petroleum stemmed from a combination of lower prices and reduced volumes as result of maintenance shutdowns. Sales in the chemical industry fell 3.0 percent. Partly offsetting these declines were gains in the primary metal (3.7 percent), machinery (3.9 percent) and computer & electronic product (7.7 percent) industries. Unfilled orders advanced 0.9 percent for the fifth consecutive monthly increase. However, new orders remained unchanged. May manufacturing sales declined 0.8 percent to $46.0 billion in May. On the year sales were up 4.0 percent. Manufacturing sales volumes also declined 0.8 percent in May. The decline in current dollar sales reflected a 2.4 percent drop in the nondurable goods. The declines were mostly concentrated in the food, petroleum & coal product and chemical industries. In contrast, the durable goods industries were up 0.8 percent in May. Lower sales were reported in 11 of 21 industries, representing 71.9 percent of total manufacturing. Sales in the food industry declined 3.1 percent. The drop was partly attributable to lower sales in the dairy product industry. Petroleum & coal products also reported a 2.5 percent decrease in sales. The decline in petroleum stemmed from a combination of lower prices and reduced volumes as result of maintenance shutdowns. Sales in the chemical industry fell 3.0 percent. Partly offsetting these declines were gains in the primary metal (3.7 percent), machinery (3.9 percent) and computer & electronic product (7.7 percent) industries. Unfilled orders advanced 0.9 percent for the fifth consecutive monthly increase. However, new orders remained unchanged.
Three events dominated last week — Fed Chairman Ben Bernanke’s Congressional testimony, the ongoing talks in Europe that are meandering towards a possible solution and the debt ceiling talks in Washington. In the U.S., economic data continue to be mixed surprising on both the positive and negative side. The European Banking Authority released the results of its latest stress tests late Friday afternoon. The Banks of Japan and Korea left their key lending rates unchanged. U.S. earnings season began.
The Bank of Canada meets Tuesday. Both the Reserve Bank of Australia (Tuesday) and the Bank of England (Wednesday) release minutes of their July meetings. In Germany, the important ZEW and Ifo surveys will be released on Tuesday and Friday respectively. Flash July services and manufacturing PMIs will be released Thursday for Germany and the eurozone.
Negotiations on both sides of the Atlantic will be watched closely this week. The EU leaders are planning to meet Thursday to discuss Greek debt issues. In the U.S., Congressional leaders and the President will be under increasing pressure to reach an agreement on the debt ceiling before the August 2nd deadline.
| Central Bank activities |
|
| July 19 |
Canada |
Bank of Canada Monetary Policy Announcement |
| July 20 |
UK |
Bank of England Monetary Policy Meeting Minutes |
|
|
|
| The following indicators will be released this week... |
| Europe |
|
|
| July 19 |
Germany |
ZEW Survey (July) |
| July 20 |
Germany |
Producer Price Index (June) |
| July 21 |
UK |
Retail Sales (June) |
| July 22 |
Germany |
Ifo Business Survey (July) |
|
|
|
| Asia/Pacific |
|
|
| July 21 |
Japan |
Merchandise Trade Balance (June) |
|
|
|
| Americas |
|
|
| July 22 |
Canada |
Consumer Price Index (June) |
|
Canada |
Retail Sales (May) |
Anne D Picker is the author of International Economic Indicators and Central Banks.
|
