|
For roughly the last four to six weeks, analysts, traders and even some Fed officials have been concerned about recent economic news suggesting that the economy is in a soft patch. Debate has become more vocal on whether this soft patch is transitory and for how long. This past week, the news was mixed but added more than not to the argument that recent sluggishness is temporary.
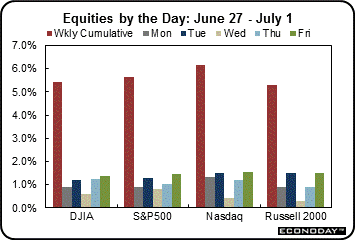 It was a rare week for equities as major indexes rose significantly in each of the five trading days. At the start of the week a mixed personal income report was trumped by news that bank regulators in Basel announced global capital requirement rules less onerous than previously expected for banks seen as too big to fail. In turn, bank stocks rallied and the general market followed. Also, techs were lifted by news of a Microsoft licensing deal with General Dynamics and by an analyst’s upgrade on Amazon. It was a rare week for equities as major indexes rose significantly in each of the five trading days. At the start of the week a mixed personal income report was trumped by news that bank regulators in Basel announced global capital requirement rules less onerous than previously expected for banks seen as too big to fail. In turn, bank stocks rallied and the general market followed. Also, techs were lifted by news of a Microsoft licensing deal with General Dynamics and by an analyst’s upgrade on Amazon.
 On Tuesday, optimism that European nations will take action to prevent a Greek default boosted equities—notably the energy and consumer discretionary sectors. France's plan for helping to resolve the country's debt problems got a favorable response from German banking associations. A better-than-expected Case-Shiller report also helped stocks while a disappointing consumer confidence report was ignored. On Tuesday, optimism that European nations will take action to prevent a Greek default boosted equities—notably the energy and consumer discretionary sectors. France's plan for helping to resolve the country's debt problems got a favorable response from German banking associations. A better-than-expected Case-Shiller report also helped stocks while a disappointing consumer confidence report was ignored.
Equities gained at mid-week on progress of a Greek austerity package and on news that Bank of America reached a settlement of investor claims on securities purchased before the housing market collapse. A jump in pending home sales also added to lift.
On Thursday, European and U.S. markets jumped after parliamentary approval of Greek austerity measures and on an announcement by the Fed that it would implement a higher cap than expected for debit card swipe fees. Bank stocks as well as VISA and MasterCard rose on the news. A stronger-than-expected Chicago PMI added to the view that the economy is regaining strength. At week’s end, the big news was a boost in the ISM manufacturing index, also adding to the view of a strengthening economy even as consumer sentiment fell short of expectations.
 Equities were up sharply this past week. The Dow was up 5.4 percent; the S&P 500, up 5.6 percent; the Nasdaq, up 6.1 percent; and the Russell 2000, up 5.3 percent. Equities were up sharply this past week. The Dow was up 5.4 percent; the S&P 500, up 5.6 percent; the Nasdaq, up 6.1 percent; and the Russell 2000, up 5.3 percent.
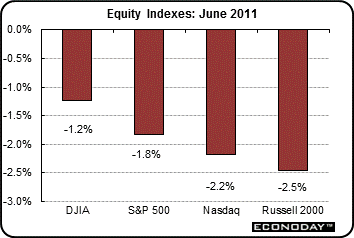
Equities were down in June. The Dow was down 1.2 percent; the S&P 500, down 1.8 percent; the Nasdaq, down 2.2 percent; and the Russell 2000, down 2.5 percent.
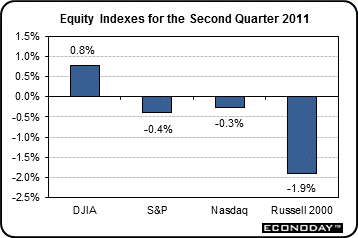
For the second quarter, shares were mixed. The Dow was up 0.8 percent; the S&P 500, down 0.4 percent; the Nasdaq, down 0.3 percent; and the Russell 2000, down 1.9 percent.
For the year-to-date, major indexes are up as follows: the Dow, up 8.7 percent; the S&P 500, up 6.5 percent; the Nasdaq, up 6.2 percent; and the Russell 2000, up 7.2 percent.
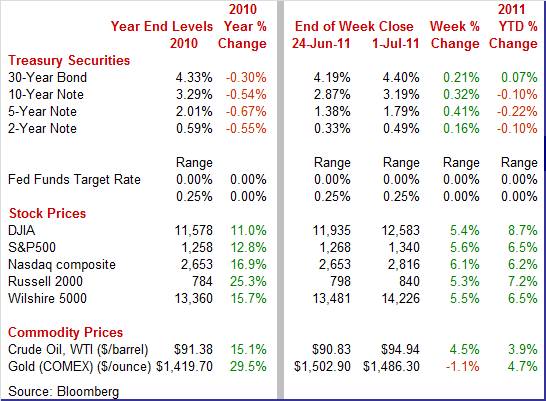
Weekly percent change column reflects percent changes for all components except interest rates. Interest rate changes are reflected in simple differences.
 Treasury yields—especially mid-maturities—marched higher and steadily throughout the week. Just as equities advanced each day this past week, bond yields for most maturities rose each day also. Treasury yields—especially mid-maturities—marched higher and steadily throughout the week. Just as equities advanced each day this past week, bond yields for most maturities rose each day also.
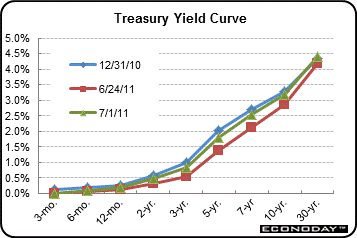 Basically, funds moved out of Treasuries on the on-going good news on resolving Greek sovereign debt problems, on more favorable than not economic news, and as the Fed officially ended QE2 on June 30. Progress on Greek debt encouraged investors to take on riskier investments away from Treasuries. Basically, funds moved out of Treasuries on the on-going good news on resolving Greek sovereign debt problems, on more favorable than not economic news, and as the Fed officially ended QE2 on June 30. Progress on Greek debt encouraged investors to take on riskier investments away from Treasuries.
Mid-maturity Treasuries were up sharply for the week with the near and far ends little changed.
For this past week Treasury rates were up as follows: the 2-year note, up 16 basis points; the 5-year note, up 41 basis points; the 7-year note, up 42 basis points; the 10-year note, up 32 basis points; and the 30-year bond, up 21 basis points. The 3-month T-bill was unchanged.
 The oil market’s dip in prices in reaction to the June 23 announcement of the release of stocks from strategic petroleum reserves seems like ancient history. The spot price of West Texas Intermediate rose significantly this past week and back to levels before the International Energy Agency announcement about strategic reserve sales. The oil market’s dip in prices in reaction to the June 23 announcement of the release of stocks from strategic petroleum reserves seems like ancient history. The spot price of West Texas Intermediate rose significantly this past week and back to levels before the International Energy Agency announcement about strategic reserve sales.
The same basic themes affecting equities and bonds put upward pressure on oil—progress on Greek sovereign debt and more favorable than not economic news. Also, the dollar declined over the week significantly—especially against the euro. The dollar index was down about 1.8 percent for the week. Finally, crude stocks dropped more than forecast. Crude inventories declined 4.38 million barrels to 359.5 million barrels in the week ended June 24.
Net for the week, spot prices for West Texas Intermediate gained $4.11 per barrel to settle at $94.94. Nonetheless, crude is still down from the recent high of $113.52 seen on May 2.
This past week, updates were posted for the consumer, manufacturing, and housing sectors.
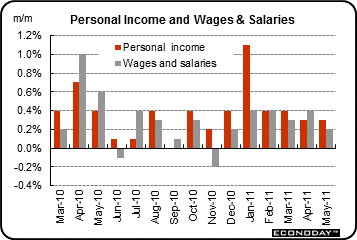 The May personal income report was mixed. Spending was the big disappointment but softness may be temporary. Inflation news was mixed. Personal income in May rose 0.3 percent, matching the gain the month before. However, wages & salaries increased a modest 0.2 percent, following a rise of 0.4 percent in April. This component was softened by no change in the government subcomponent. While wages & salaries were a little soft, overall personal income was led by healthy gains in rental income (up 1.0 percent), interest income (up 0.5 percent), dividends (up 0.6 percent), and government unemployment insurance benefits (up 5.3 percent). The May personal income report was mixed. Spending was the big disappointment but softness may be temporary. Inflation news was mixed. Personal income in May rose 0.3 percent, matching the gain the month before. However, wages & salaries increased a modest 0.2 percent, following a rise of 0.4 percent in April. This component was softened by no change in the government subcomponent. While wages & salaries were a little soft, overall personal income was led by healthy gains in rental income (up 1.0 percent), interest income (up 0.5 percent), dividends (up 0.6 percent), and government unemployment insurance benefits (up 5.3 percent).
 Personal spending weakened in May, posting at no change, following a 0.3 percent boost the prior month. The slowdown was largely due to a decline in motor vehicle sales as durables dropped 1.5 percent after no change in April. The drop in durables likely was related to shortages of autos dependent upon Japanese parts and we should see improvement in coming months. Nondurables dipped 0.3 percent, following a 0.2 percent rise the month before with the latest decrease partially related to a dip in prices for gasoline. Services gained 0.2 percent, following a 0.1 percent slip in April. Personal spending weakened in May, posting at no change, following a 0.3 percent boost the prior month. The slowdown was largely due to a decline in motor vehicle sales as durables dropped 1.5 percent after no change in April. The drop in durables likely was related to shortages of autos dependent upon Japanese parts and we should see improvement in coming months. Nondurables dipped 0.3 percent, following a 0.2 percent rise the month before with the latest decrease partially related to a dip in prices for gasoline. Services gained 0.2 percent, following a 0.1 percent slip in April.
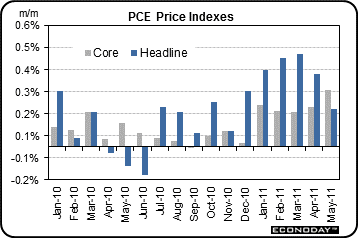
On the inflation front, the Fed has a lot to mull over despite improvement in the headline figure. The PCE price index eased to a 0.2 percent rise from 0.3 percent in April. However, the core rate edged up to 0.3 percent from 0.2 percent in April.
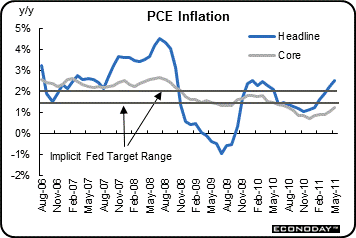 Year-ago numbers indicate that the Fed still must keep a close watch on inflation. On a year-ago basis, headline PCE inflation rose to 2.5 percent from 2.2 percent in April. Core PCE price inflation firmed to 1.2 percent on a year-ago basis from 1.1 percent in April. Headline is still well above the Fed’s implicit inflation target range of 1-1/2 to 2 percent and the core rate may not be below it much longer. Boosting core inflation back to the implicit target range was one of the reasons for implementing QE2. Year-ago numbers indicate that the Fed still must keep a close watch on inflation. On a year-ago basis, headline PCE inflation rose to 2.5 percent from 2.2 percent in April. Core PCE price inflation firmed to 1.2 percent on a year-ago basis from 1.1 percent in April. Headline is still well above the Fed’s implicit inflation target range of 1-1/2 to 2 percent and the core rate may not be below it much longer. Boosting core inflation back to the implicit target range was one of the reasons for implementing QE2.
The latest personal income report adds to the “soft patch” scenario—at least for now. Income is still growing but not at a strong enough pace for the latest month. And spending is flat. However, there are arguments that the softness is transitory. Improvement in employment would boost income. An easing of supply disruptions in the auto sector will likely lead a rise in durables spending. However, nondurables will likely be weighed down by additional near-term declines in gasoline prices.
 Motor vehicle sales declined in June as consumers balked at higher prices and limited supply of models. Overall sales of domestic and import motor vehicles declined 2.9 percent to 11.5 million units annualized and followed a drop of 10.4 percent in May. For the latest month, domestics fell 2.8 percent to 8.8 million units while imports decreased 3.4 percent to 2.6 million units. Motor vehicle sales declined in June as consumers balked at higher prices and limited supply of models. Overall sales of domestic and import motor vehicles declined 2.9 percent to 11.5 million units annualized and followed a drop of 10.4 percent in May. For the latest month, domestics fell 2.8 percent to 8.8 million units while imports decreased 3.4 percent to 2.6 million units.
Sales continued to be weighed down by shortages of models dependent upon Japanese parts. Many dealers apparently decided to try to take advantage of the limited supplies and boosted prices. This strategy appears to have backfired. Consumers have chosen to just sit on the sidelines until desirable models are more available and prices are more attractive. While the latest sales numbers look troublesome at face value, weakness appears to be less due to economic conditions overall but due to shortages arising from the recent Japanese earthquake and tsunami. Industry analysts have said for some time that shortages would likely be worst in May and June.
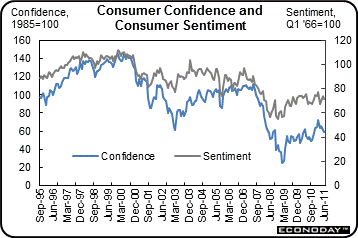 Despite recent declines in gasoline prices, consumers remain somewhat on the gloomy side. The Conference Board’s consumer confidence index fell significantly for a second straight month, down more than three points to 58.5. The assessment of the present situation dipped 1.7 points to 37.6 while the expectations measure declined 4.3 points to 72.4. Despite recent declines in gasoline prices, consumers remain somewhat on the gloomy side. The Conference Board’s consumer confidence index fell significantly for a second straight month, down more than three points to 58.5. The assessment of the present situation dipped 1.7 points to 37.6 while the expectations measure declined 4.3 points to 72.4.
The assessment of the current jobs market this month unfortunately also deteriorated, with 43.8 percent saying jobs are hard to get for a three tenths worsening from May. The assessment of the future jobs market shows fewer seeing more jobs ahead while expectations of future income show more seeing a decrease and fewer seeing an increase.
The Reuters/University of Michigan report showed similar results for the final reading for June declining to 71.5 from 74.3 in May in what is a sizable dip. Compared to the mid-month reading of 71.8, the final June reading implies slight weakening into month end. In a special negative, the weakness was centered in the leading component of expectations which fell 2.0 two points from mid-month to 64.8 and was down 4.7 points from the May final of 69.5. Current conditions actually improved marginally to 82.0 in June from a mid-month 79.6 and a May final of 81.9.
Basically, consumers are still gloomy about lack of progress in the labor market and still relatively high food and gasoline costs.
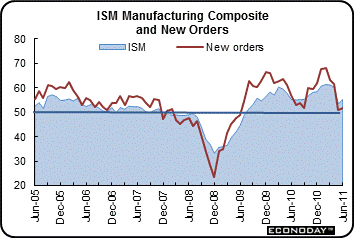 Manufacturing is showing improvement at the national level according to the latest ISM report but a key question is what underlies the latest gain. The headline composite of 55.3 is 1.8 points higher than in May but inventories, one of five equally weighted components, jumped 5.4 points to 54.1. This reading could indicate restocking tied to prior Japanese supply shortages. However, it may or may not indicate business expectations for improvement in demand. Order readings offer the best gauge on that and they are recently soft, with new orders showing only slight month-to-month acceleration at 51.6 compared to 51.0 in May. But employers must be somewhat optimistic about future demand as employment is a big positive in the report with this index rising 1.7 points to a very strong 59.9. Input price pressure is severe but easing while production is steady at a moderately strong 54.5. Manufacturing is showing improvement at the national level according to the latest ISM report but a key question is what underlies the latest gain. The headline composite of 55.3 is 1.8 points higher than in May but inventories, one of five equally weighted components, jumped 5.4 points to 54.1. This reading could indicate restocking tied to prior Japanese supply shortages. However, it may or may not indicate business expectations for improvement in demand. Order readings offer the best gauge on that and they are recently soft, with new orders showing only slight month-to-month acceleration at 51.6 compared to 51.0 in May. But employers must be somewhat optimistic about future demand as employment is a big positive in the report with this index rising 1.7 points to a very strong 59.9. Input price pressure is severe but easing while production is steady at a moderately strong 54.5.
This past week’s regional manufacturing surveys were mixed with headline series in two of the three surveys turning up. From the Dallas Fed, current conditions for Texas manufacturing weakened further in June as the general business activity index declined to minus 17.5 in June from minus 7.4 in May. However, the production index remained positive but slowed to 5.6 from 12.7 in May. A modest positive in the report was a rise in the new orders index which improved to 6.4 from 1.1 the prior month.
The Richmond Fed's district manufacturing index rose a sizable 9 points to plus 3 to indicate mild month-to-month expansion in business conditions. New orders are a plus in the report, showing a small month-to-month gain that contrasts with a big month-to-month decline in May.
Finally, manufacturing in the Kansas City Fed District showed notable improvement in June as the composite index rose to 14 from a reading of 1 in May. The strengthening was broad-based with production jumping to 22 from minus 2 in May; the new orders index rising to 10 from minus 15; and shipments gaining to 25 from minus 8 the month before. Even labor indexes improved with the number of employees index rising to 17 from 9 and the workweek index improving to 9 from minus 3.
Overall, manufacturing is regaining strength.
 The Chicago area economy posted stronger growth in June according to the ISM of Chicago. The Chicago PMI accelerated to a reading of 61.1 from 56.6 in May. The new orders index was even more favorable, gaining 7.7 points to 61.2. Production—and this may be an indication from the auto sector—jumped 10.9 points to 66.9. The Chicago area economy posted stronger growth in June according to the ISM of Chicago. The Chicago PMI accelerated to a reading of 61.1 from 56.6 in May. The new orders index was even more favorable, gaining 7.7 points to 61.2. Production—and this may be an indication from the auto sector—jumped 10.9 points to 66.9.
Even though financial markets reacted quite positively to the report, an often small sample size together with an undetermined mix of manufacturing and non-manufacturing make the data more volatile and more difficult for determining current strength. Nonetheless, it is another report suggesting that the soft patch is transitory.
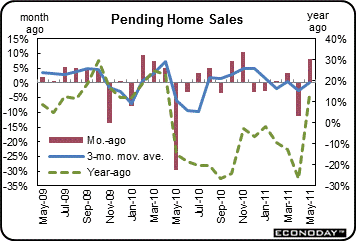 Pending sales of existing homes rebounded 8.2 percent in May, following a drop of 11.3 percent the month before. Led by the West and Midwest, all four regions showed respectable gains. The pending sales numbers—based on contract signing—point to the direction of existing home sales (based on closing transactions) over the next one to three months. Given the volatility in the data, a three-month average suggests that the underlying current trend is still flat. The pending home sales index, however, is up 13.4 percent on a year ago basis. Pending sales of existing homes rebounded 8.2 percent in May, following a drop of 11.3 percent the month before. Led by the West and Midwest, all four regions showed respectable gains. The pending sales numbers—based on contract signing—point to the direction of existing home sales (based on closing transactions) over the next one to three months. Given the volatility in the data, a three-month average suggests that the underlying current trend is still flat. The pending home sales index, however, is up 13.4 percent on a year ago basis.
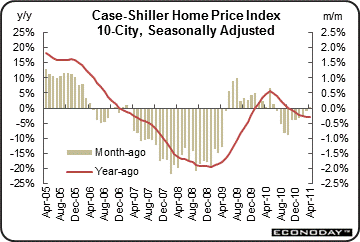 Indications are building that home prices are stabilizing and possibly recovering. The issue in the latest Case-Shiller numbers is whether you focus on seasonally adjusted or not seasonally adjusted data. Indications are building that home prices are stabilizing and possibly recovering. The issue in the latest Case-Shiller numbers is whether you focus on seasonally adjusted or not seasonally adjusted data.
On a seasonally adjusted basis, the 10-city composite in April was unchanged, following a 0.1 percent dip in March. This index had declined four months in a row. Importantly, the Case-Shiller data are three-month moving averages of the underlying data which suggest an actual gain for April.
Unadjusted readings are very positive though seasonality plays a big part in the housing market which benefits from warm weather and many sales are timed for moving when school is not in session during the summer. The unadjusted composite 10 index gained 0.8 percent in the month, offsetting an equal decline in March.
However, the year-on-year rate remains negative at minus 3.1 percent (the same reading as the adjusted rate). Still, with last week’s favorable report on FHFA house prices, there is reason to believe that prices are holding steady.
 The Fed’s latest weekly balance sheet report may be an advance look at what post-QE2 will look like. QE2 ended this past Thursday (June 30) and the latest weekly report includes all but the last day of QE2 activity. The Fed’s balance sheet in the June 29 week expanded $8.8 billion after a $28.8 billion jump the prior week. The Fed’s latest weekly balance sheet report may be an advance look at what post-QE2 will look like. QE2 ended this past Thursday (June 30) and the latest weekly report includes all but the last day of QE2 activity. The Fed’s balance sheet in the June 29 week expanded $8.8 billion after a $28.8 billion jump the prior week.
However, the component details likely reflect what the Fed is going to do for quite some time. Treasury holdings gained $15.1 billion, following a $26.0 billion boost in the June 22 week. However, natural unwinding of the balance sheet was seen in declines for mortgage-backed securities and federal agency debt, down $5.5 billion and down $1.7 billion, respectively. Odds are good that we will see more downsizing in those two components in coming months. But the Fed will be reinvesting in Treasuries to limit shrinkage in the balance sheet. Total assets in the June 29 week reached $2.869 trillion, another record high.
The economy appears to be regaining momentum in manufacturing while housing is oscillating at a low level but at least the latest movement is upward. Meanwhile, the consumer sector is mixed with the weak portion possibly being temporary.
The upcoming holiday-shortened week is relatively light but is highlighted by the June employment situation on Friday. But earlier market movers include factory orders on Tuesday, ISM non-manufacturing on Wednesday, and ADP employment on Thursday.
U.S. Holiday: Independence Day. All Markets Closed.
Factory orders fell 1.2 percent in April as a price-fueled 0.6 percent rise for new orders of non-durable goods failed to offset a steep 3.6 percent retreat on the durable side where the monthly declines were wide and deep. More recently, durables orders in May rebounded 1.9 percent, following a 2.7 percent decline the month before. New durables orders excluding transportation also made a comeback, increasing 0.6 percent after a 0.4 percent drop in April. However, softer prices in the energy sector may weigh on the nondurables component of total factory orders for May.
Factory orders Consensus Forecast for May 11: +1.0 percent
Range: -0.3 to +2.1 percent
The composite index from the ISM non-manufacturing survey in May rose 1.8 points to 54.6 with strength centered where it should be, that is in new orders which rose more than four points to 56.8. Also, the employment index accelerated nicely, up 2.1 points to a 54.0 level that for this report is very strong.
ISM non-manufacturing composite index Consensus Forecast for June 11: 54.0
Range: 51.2 to 55.0
Initial jobless claims for the June 25 week nudged down only 1,000 to 428,000. The four-week average, up 500 in the week to 426,750, showed no change from the May 28 week.
Jobless Claims Consensus Forecast for 7/2/11: 420,000
Range: 405,000 to 435,000
Nonfarm payroll employment in May grew a modest 54,000, following a revised 232,000 jump in April and a 194,000 increase in March. Sluggishness in payroll jobs was broad based. Private nonfarm payrolls advanced 83,000 in May, following a 251,000 increase in April. Government jobs contracted 29,000, following a 19,000 dip in April. This latest decrease was largely local government, led down by local government education. On a positive note, wage growth improved in May as average hourly earnings rose 0.3 percent, following a 0.1 percent uptick in April. The average workweek for all workers in May held steady at 34.4 hours. Turning to the household survey, the unemployment rate nudged up to 9.1 percent from 9.0 percent in April. Household employment actually rose 105,000 for the month but was outpaced by a 272,000 gain in the labor force.
Nonfarm payrolls Consensus Forecast for June 11: 110,000
Range: 65,000 to 160,000
Private payrolls Consensus Forecast for June 11: 125,000
Range: 100,000 to 183,000
Unemployment rate Consensus Forecast for June 11: 9.1 percent
Range: 9.0 to 9.2 percent
Average workweek Consensus Forecast for June 11: 34.4 hours
Range: 34.4 to 34.4 hours
Average hourly earnings Consensus Forecast for June 11: +0.2 percent
Range: +0.1 to +0.2 percent
Consumer credit outstanding in April rose a solid $6.3 billion to extend gains now to seven months in a row which is good news for the economy. But the gains were narrowly confined to non-revolving credit which rose $7.2 billion in the month for an eighth straight gain. The dominant factor in this category is vehicle sales which were strong through April but fell significantly in May, indicating a likely drop in non-revolving credit for the next report. Revolving credit, dominated by credit cards, fell $0.9 billion in April.
Consumer credit Consensus Forecast for May 11: +$4.0 billion
Range: -$2.0 billion to +$6.0 billion
R. Mark Rogers is the author of The Complete Idiot’s Guide to Economic Indicators, Penguin Books, 2009.
Econoday Senior Writer Mark Pender contributed to this article.
|
