|
Recently, two factors have stood out as being behind the drop in equities—worries over sovereign debt problems in Europe (notably Greece) and signs that the economy has paused. But this past week, economic news was more positive than not and statements by officials that Europe is closer to resolution of Greece’s debt problems helped most equity indexes break a string of losing weeks.
 Equities ended the week up for the most part. The Dow ended a string of six weekly losses as did the S&P 500 (though barely for the S&P 500). The week got off to a slow start with equities little changed on Monday with no notable economic news in the U.S. However, lower oil prices weighed on energy producers and offset earlier lift from merger activity. Stocks gained sharply Tuesday on a favorable report on Chinese industrial production, indicating that country’s tighter monetary policy is not slowing growth too much. Also, retail sales excluding autos and gasoline were moderately positive. A notable leader was JC Penney after hiring away from Apple its retail head to be CEO. Equities ended the week up for the most part. The Dow ended a string of six weekly losses as did the S&P 500 (though barely for the S&P 500). The week got off to a slow start with equities little changed on Monday with no notable economic news in the U.S. However, lower oil prices weighed on energy producers and offset earlier lift from merger activity. Stocks gained sharply Tuesday on a favorable report on Chinese industrial production, indicating that country’s tighter monetary policy is not slowing growth too much. Also, retail sales excluding autos and gasoline were moderately positive. A notable leader was JC Penney after hiring away from Apple its retail head to be CEO.
Stocks dropped significantly at mid-week with the Empire State manufacturing index turning negative for June and despite favorable news on national manufacturing later in the morning. Oil prices fell sharply on the day, pulling down the energy sector. Failure of European officials to agree on a rescue package for Greece also bumped stocks down.
With the exception of the Nasdaq, major indexes were up the last two days of the week. Favorable economic news put traders in a positive mood on Thursday as housing starts rose more than expected and jobless claims declined more than forecast. Partially offsetting was a contraction in the Philly Fed manufacturing index for June. However, financials cut into the day’s gains on concerns that large U.S. banks will be required to increase reserves to comply with proposed international regulations.
Friday saw moderate gains on an unexpectedly strong index of leading indicators, partially offset by slippage in consumer sentiment. Also lifting equities was news that Germany would back off from its stringent stance and agreed to go along with a voluntary rollover of Greek debt. The agreement must still be approved by Eurozone finance ministers—that is not guaranteed.
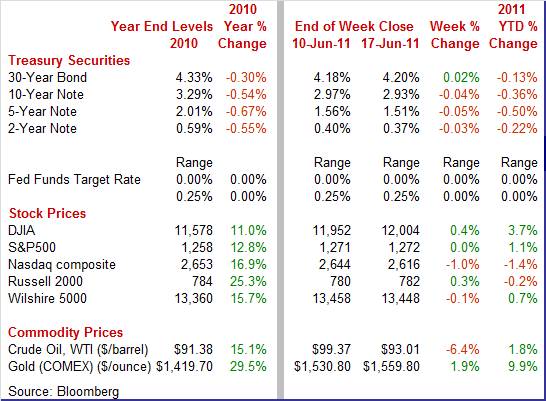
The Dow ended the week back over the 12,000 mark.
Equities were mixed but mostly up this past week. The Dow was up 0.4 percent; the S&P 500, up but less than 0.1 percent; and the Russell 2000, up 0.3 percent. The Nasdaq declined 1.0 percent.
For the year-to-date, major indexes are mixed as follows: the Dow, up 3.7 percent; the S&P 500, up 1.1 percent; the Nasdaq, down 1.4 percent; and the Russell 2000, down 0.2 percent.
Weekly percent change column reflects percent changes for all components except interest rates. Interest rate changes are reflected in simple differences.
 Treasury rates ended the week mostly down and only slightly. There were only two major moves during the week—on Tuesday and Wednesday. Yields rose on the first these two days on news of strong industrial production in China and on better-than-expected retail sales in the U.S. Yields fell on flight to safety at mid-week as European officials failed to reach an agreement for a rescue plan for Greek sovereign debt and on the drop in the Empire State index. Treasury rates ended the week mostly down and only slightly. There were only two major moves during the week—on Tuesday and Wednesday. Yields rose on the first these two days on news of strong industrial production in China and on better-than-expected retail sales in the U.S. Yields fell on flight to safety at mid-week as European officials failed to reach an agreement for a rescue plan for Greek sovereign debt and on the drop in the Empire State index.
For this past week Treasury rates were down as follows: 3-month T-bill, down 1 basis point; the 2-year note, down 3 basis points; the 5-year note, down 5 basis points; the 7-year note, down 4 basis points; and the 10-year note, down 4 basis points. The 30-year bond firmed 2 basis points.
 The spot price of crude was down sharply for the week. There were sizeable moves nearly every day but not always down. West Texas Intermediate dipped $2 per barrel Monday on the release of data showing a decline in Chinese demand for fuel. But on Tuesday, better-than-expected retail sales were seen lifting demand estimates for oil, bumping crude back up 2 bucks. The spot price of crude was down sharply for the week. There were sizeable moves nearly every day but not always down. West Texas Intermediate dipped $2 per barrel Monday on the release of data showing a decline in Chinese demand for fuel. But on Tuesday, better-than-expected retail sales were seen lifting demand estimates for oil, bumping crude back up 2 bucks.
At mid-week, the surprisingly weak Empire State report and worries about contagion from European sovereign debt problems pushed crude down a sharp $4-1/2s. After an uneventful Thursday for the oil markets, crude dropped another $2 per barrel on oil traders being more skeptical than others and seeing the current efforts to solve Greek sovereign debt issues as not likely to succeed.
Net for the week, spot prices for West Texas Intermediate dropped $6.36 per barrel to settle at $93.01.
Despite financial markets focusing on the negative, the economic news actually was mixed with some reports or key components of indicators even surprising on the upside. Whether recent movement is temporary is a frequent issue. Also, the effect of supply shortages tied to the Japanese earthquake and tsunami in March was another repeated issue.
 Headline retail sales slipped in May, tugged down largely by auto sales and with other components mixed. Overall retail sales in May dipped 0.2 percent, following a revised 0.3 percent gain in April. Motor vehicle sales dropped 2.9 percent, following a 0.7 percent dip the month before. Part of the reason for the fall in motor vehicle sales was a shortage of popular models dependent on parts from Japan. Headline retail sales slipped in May, tugged down largely by auto sales and with other components mixed. Overall retail sales in May dipped 0.2 percent, following a revised 0.3 percent gain in April. Motor vehicle sales dropped 2.9 percent, following a 0.7 percent dip the month before. Part of the reason for the fall in motor vehicle sales was a shortage of popular models dependent on parts from Japan.
 Excluding autos, sales advanced 0.3 percent, following a 0.5 percent rise in April. Gasoline sales gained 0.3 percent in the latest month. Outside of autos and gasoline, sales were mixed but more often up than down. Sales excluding autos and gasoline in May printed at a 0.3 percent rise, matching the increase the month before. Overall, the trend is upward but at a modest pace the last two months following strong months in March and February. Excluding autos, sales advanced 0.3 percent, following a 0.5 percent rise in April. Gasoline sales gained 0.3 percent in the latest month. Outside of autos and gasoline, sales were mixed but more often up than down. Sales excluding autos and gasoline in May printed at a 0.3 percent rise, matching the increase the month before. Overall, the trend is upward but at a modest pace the last two months following strong months in March and February.
Retail sales on a year-ago basis in May came in at 7.7 percent, compared to 7.3 percent the month before. Excluding motor vehicles, sales were up 8.2 percent, up from 6.8 percent year ago in April.
 Despite lower gasoline prices, consumers are a little more worried about the economy. The Reuters/University of Michigan consumer sentiment index dipped 2.5 points from final May to 71.8 for the mid-June reading. The weakening was led by a 2.7 point drop in the expectations component to 66.8 while the current conditions index slipped 2.3 points to 79.6. If there is good news it is that levels are still above the sub-70s of April and significantly above recession lows in the 50s. Despite lower gasoline prices, consumers are a little more worried about the economy. The Reuters/University of Michigan consumer sentiment index dipped 2.5 points from final May to 71.8 for the mid-June reading. The weakening was led by a 2.7 point drop in the expectations component to 66.8 while the current conditions index slipped 2.3 points to 79.6. If there is good news it is that levels are still above the sub-70s of April and significantly above recession lows in the 50s.
However, the Fed can keep saying that inflation expectations remain anchored as the one-year outlook dipped one tenth to 4.0 percent and the five-year nudged up only one tenth to 3.0 percent.
 Sometimes markets forget that the headline number for the industrial production is not just about manufacturing and that was the case for the latest report. Industrial production posted a modest rise in May but was held back by a drop in utilities. Overall industrial production in May edged up 0.1 percent, following no change in April. Sometimes markets forget that the headline number for the industrial production is not just about manufacturing and that was the case for the latest report. Industrial production posted a modest rise in May but was held back by a drop in utilities. Overall industrial production in May edged up 0.1 percent, following no change in April.
However, manufacturing made a comeback, rebounding 0.4 percent in May, following a 0.5 percent fall the prior month. April auto production had been constrained by shortages of parts from Japan related to the March earthquake and tsunami and this damping effect appears to have continued into May with motor vehicle assemblies essentially flat. Excluding motor vehicles, manufacturing advanced a robust 0.6 percent after a 0.1 percent dip in April.
 Indeed, motor vehicle assemblies have been bumped down, posting at an annualized 7.88 million units in May and 7.86 million in April. These rates are notably lower than February’s 8.47 million and March’s 8.81 million. Recent weakness has been more in light trucks (includes minivans and SUVs) than in autos. Indeed, motor vehicle assemblies have been bumped down, posting at an annualized 7.88 million units in May and 7.86 million in April. These rates are notably lower than February’s 8.47 million and March’s 8.81 million. Recent weakness has been more in light trucks (includes minivans and SUVs) than in autos.
Utilities—the culprit behind headline softness—dropped 2.8 percent after increasing 2.4 percent the month before. Output for electric utilities fell 3.3 percent after a 2.8 percent jump in April. Mining output expanded 0.5 percent after a 0.8 percent boost in April. As of December 2010 (latest data on component shares), manufacturing made up 74.7 percent of industrial production; mining, 13.9 percent; and utilities, 11.4 percent.
Overall capacity utilization in May was unchanged at 76.7 percent and came in lower than the consensus estimate for 77.0 percent.
The details for the production report are quite encouraging as the headline number was weighed down by utilities and manufacturing excluding autos was very healthy. Taking into account that auto assemblies eventually will work around current parts shortages, forward momentum should be good for manufacturing. However, the just released numbers for June for the Empire State and Philly Fed manufacturing surveys raise questions about the direction of momentum.
 For the first time since November, monthly business conditions in the New York manufacturing region contracted. The Empire State index fell nearly 19.67 points in the June reading to minus 7.79 in what the report describes as a "steep" decline. New orders dropped 20.80 points to minus 3.61, again a negative reading indicating month-to-month contraction compared to May. Shipments were even worse, down 33.77 points to minus 8.02. For the first time since November, monthly business conditions in the New York manufacturing region contracted. The Empire State index fell nearly 19.67 points in the June reading to minus 7.79 in what the report describes as a "steep" decline. New orders dropped 20.80 points to minus 3.61, again a negative reading indicating month-to-month contraction compared to May. Shipments were even worse, down 33.77 points to minus 8.02.
The report also shows a moderating rise in the number of employees and a contraction in the workweek.
 Later last week, the Philly Fed manufacturing survey added to the view that manufacturing stalled in June. The general business conditions index posted at minus 7.7 for the first negative reading since September and down 11.6 points from May. Weakness stood out in new orders at minus 7.6 and down from a reading of 5.4 and with unfilled orders at minus 16.3 and down from minus 7.8. Shipments and employment both rose in the month but at a slower rate, and the decline in orders points to further slowing, if not contraction, in future reports.
 Another negative is a big decline in the six-month outlook as what were once expectations for very solid growth are now turning into expectations for only marginal growth. Japanese supply effects may be at play to some extent but transportation equipment is not a dominant industry in either the Mid-Atlantic or New York regions. This week's two reports raise the risk of contraction for the ISM's national report on manufacturing to be posted at the beginning of July.
While the latest regional reports are discouraging, one should note that they are not always good predictors for national manufacturing for the same month. If one compares monthly percentage changes in national manufacturing from the industrial production report with index levels for Empire State and Philly Fed general conditions indexes, they do not always move in tandem. The regional indexes are diffusion indexes and are comparable to monthly percentage changes in effect. Philly was much weaker than national manufacturing in latter 2010 and national manufacturing was much stronger than both in late 2010 and early 2011. National manufacturing was down more sharply in April while region numbers were up. Yes, June regional numbers are disconcerting but national manufacturing may not be as soft when June data come in. But they could also. The next durables orders report likely will get more market attention than usual.
 Housing construction showed signs of life in May. Housing starts rebounded 3.5 percent, following an 8.8 percent drop in April. May’s annualized pace of 0.560 million units is down 3.4 percent on a year-ago basis. The gain in May was led by a 3.7 percent rebound in the single-family component, following a 3.3 percent decline in April. The volatile multifamily component made a partial comeback, rising 2.9 percent after falling 21.7 percent the month before. Housing construction showed signs of life in May. Housing starts rebounded 3.5 percent, following an 8.8 percent drop in April. May’s annualized pace of 0.560 million units is down 3.4 percent on a year-ago basis. The gain in May was led by a 3.7 percent rebound in the single-family component, following a 3.3 percent decline in April. The volatile multifamily component made a partial comeback, rising 2.9 percent after falling 21.7 percent the month before.
Starts are only 17.2 percent above the recent recession’s low of 0.478 million units in April 2009.
Housing permits are pointing to a little more optimism on the part of homebuilders. Housing permits jumped 8.7 percent in May, following a 1.9 percent decrease in April. Overall permits posted at an annualized rate of 0.612 million units and are actually up 5.2 percent on a year-ago basis.
Housing starts remain at low levels but the May numbers for starts and permits indicate that there is modest demand in some local markets for new construction—likely built to order rather than spec. But the fundamentals are unchanged. There is still enormous supply on the market and the best sustainable trend in the near term is incrementally up or more likely merely holding steady.
 Consumer price inflation at the headline level softened in May on a decline in energy costs. The consumer price index in May grew at a 0.2 percent rate, down from 0.4 percent in April. Energy came down 1.0 percent, following a string of strong gains including 2.2 percent in April. Gasoline declined 2.0 percent after jumping 3.3 percent in April. Food prices rose 0.4 percent, matching the boost in April. For food at home, four of the six major grocery store food group indexes increased, with the index for meats, poultry, fish, and eggs rising the most. Consumer price inflation at the headline level softened in May on a decline in energy costs. The consumer price index in May grew at a 0.2 percent rate, down from 0.4 percent in April. Energy came down 1.0 percent, following a string of strong gains including 2.2 percent in April. Gasoline declined 2.0 percent after jumping 3.3 percent in April. Food prices rose 0.4 percent, matching the boost in April. For food at home, four of the six major grocery store food group indexes increased, with the index for meats, poultry, fish, and eggs rising the most.
However, excluding food and energy, the CPI jumped 0.3 percent, following a 0.2 percent rise the month before. Analysts had forecast a 0.2 percent increase.
Within the core, indexes for apparel, shelter, new vehicles, and recreation all contributed to the acceleration, rising more in May than in April. These increases more than offset declines in the indexes for airline fare, tobacco, and personal care. New & used vehicles rose a strong 1.0 percent but this may be a temporary effect of supply disruptions of parts from Japan and less availability of some auto models.
 A sign that the economy is improving is that prices for lodging away from home jumped 2.9 percent in May, indicating the demand for business and leisure travel is up and hotel/resort discounting is down. A sign that the economy is improving is that prices for lodging away from home jumped 2.9 percent in May, indicating the demand for business and leisure travel is up and hotel/resort discounting is down.
Year-on-year, overall CPI inflation worsened to 3.4 percent (seasonally adjusted) from 3.1 percent in April. The core rate bumped up to 1.5 percent from 1.3 percent in April on a year-ago basis. The core rate now is at the bottom of the Fed’s implicit inflation target and this likely will make the FOMC reluctant to engage in an additional round of quantitative easing. This is due to the lengthy lag time for changes in monetary policy to have full impact.
 At the producer level, inflation slowed but there were still hot spots in the data. Overall PPI inflation in May softened to 0.2 percent from April’s 0.8 percent jump. By major components, energy still gained, by 1.5 percent after a 2.5 percent gain in April. Specifically, gasoline increased 2.7 percent, after jumping 3.6 percent in April. However, food fell 1.4 percent, following a 0.3 percent rebound the month before. At the producer level, inflation slowed but there were still hot spots in the data. Overall PPI inflation in May softened to 0.2 percent from April’s 0.8 percent jump. By major components, energy still gained, by 1.5 percent after a 2.5 percent gain in April. Specifically, gasoline increased 2.7 percent, after jumping 3.6 percent in April. However, food fell 1.4 percent, following a 0.3 percent rebound the month before.
At the core level, PPI growth eased to 0.2 percent after a 0.3 percent rise in April and equaling the median forecast for 0.2 percent. Consumer goods excluding food and energy rose 0.2 percent after an increase of 0.3 percent in April. Capital goods also showed a 0.2 percent gain in May after a 0.3 percent boost the month before.
 For the overall PPI, the year-ago pace in May came in at 7.0 percent, compared to 6.6 percent in April (seasonally adjusted). The core rate held steady at 2.1 percent. For the overall PPI, the year-ago pace in May came in at 7.0 percent, compared to 6.6 percent in April (seasonally adjusted). The core rate held steady at 2.1 percent.
The latest PPI report softened but not with any help from energy. And the underlying trend for consumers is still on the high side with the year ago pace for consumer goods excluding food and energy at up 2.7 percent. Manufacturers currently may have difficulty passing along costs but they certainly have incentive to try.
 The week’s economic news ended on a positive note. The Conference Board’s index of leading indicators jumped 0.8 percent in May, following a 0.4 percent decline the month before. However, one of the key contributors to the May gain posted a reverse in early June. The week’s economic news ended on a positive note. The Conference Board’s index of leading indicators jumped 0.8 percent in May, following a 0.4 percent decline the month before. However, one of the key contributors to the May gain posted a reverse in early June.
As usual for many months, the rate spread between the 10-year T-note and fed funds rate led strength for the month, adding 0.32 percentage points. Next, consumer expectations added 0.23 percentage points with building permits contributing 0.22 percentage points to the overall index gain. Positives also came from lower initial jobless claims and increases in new orders for consumer goods, new orders for nondefense capital goods, stock prices, and money supply.
The only negative contribution—0.32 percentage points—came from vendor performance. The average workweek in manufacturing had a zero contribution.
The coincident index has been sluggish in recent months, edging up only 0.1 percent in both May and April.
Looking ahead, early indications are mixed for the leading index. Initial jobless claims have edged lower in June. However, just this past week we saw a dip in the expectations component of consumer sentiment for the mid-June reading and this will cut into the June leading index. Also, stocks are down significantly for the month so far. Nonetheless, the leading index forecasts strength several months out—not just a month ahead—and the trend suggests modest improvement ahead for the economy.
It is easily arguable that the economy is still in a soft patch. However, this past week’s news indicates that improvement is ahead although uncertainty is still high.
This week's focus is centered on Wednesday's FOMC announcement followed by the chairman's second press conference. Tuesday's existing home sales and Thursday's new home sales will indicate if last week's housing starts data have traction. Thursday's durable orders data will give another perspective on manufacturing while on Friday the third estimate for GDP is on tap.
Existing home sales in April declined 0.8 percent to a 5.05 million annual unit rate. On a year-ago basis, sales are 12.9 percent. Supply on the market ballooned to 9.2 months at the current sales rate compared to 8.3 months in March.
Existing home sales Consensus Forecast for May 11: 4.75 million-unit rate
Range: 4.60 to 5.10 million-unit rate
The FOMC announcement for the June 21-22 FOMC policy meeting is expected to leave the fed funds target rate unchanged at a range of zero to 0.25 percent. The key question is what the Fed will do with its hugely expanded balance sheet from QE1 and QE2 as QE2 wraps up by the end of June. Will there be hints of QE3 or a plan to delay the natural unwinding of the balance sheet from maturing securities' Also, the Fed will release its quarterly forecast at the same time as the statement. More Fed officials have commented on their perception of softer economic growth and we could see a downgrade in the forecast for GDP. The chairman’s press conference follows at 2:15 p.m. ET.
FOMC Consensus Forecast for 6/22/11 policy vote on fed funds target range: unchanged at a range of zero to 0.25 percent
Chairman press conference after the FOMC meeting statement is scheduled for 2:15 p.m. ET. Fed Chairman Ben Bernanke conducts a press conference after FOMC meetings in which participants present their quarterly economic forecasts. Bernanke is expected to comment on the forecast and take Q&A. Discussion also is likely to cover what the Fed is going to do with its extremely elevated balance sheet since QE2 is scheduled to finish by the end of June.
Initial jobless claims for the June 11 week fell 16,000 to 414,000. The four-week average, though unchanged at 424,750, is more than 15,000 below where it was a month ago. Continuing claims also came down, dropping 21,000 to 3.709 million in data for the June 4 week with the unemployment rate for insured workers unchanged at 2.9 percent.
Jobless Claims Consensus Forecast for 6/18/11: 415,000
Range: 410,000 to 425,000
New home sales in April jumped 7.3 percent, following an 8.3 percent increase the month before. But the advances were from low levels as the February number was a record low. April’s annualized sales pace of 323,000 units is down 23.1 percent on a year-ago basis. Importantly, April’s improvement drew down supply to 6.5 months from 7.2 in March and 7.9 in February and down from a recent high of 12.1 set in January 2009.
New home sales Consensus Forecast for May 11: 305 thousand-unit annual rate
Range: 288 thousand to 345 thousand-unit annual rate
Durable goods orders fell back in April, declining 3.6 percent, following a revised 4.6 percent jump in March. Excluding transportation, new orders slipped a revised 1.6 percent, following a 2.6 percent rise in March. Weakness in the latest month was led by transportation equipment. Outside of transportation, weakness was widespread but generally followed strong gains in March. Looking ahead, manufacturing surveys for May point to deceleration but positive growth. New orders indexes for ISM and Philly Fed were modestly above breakeven. Empire State slowed but remained moderately high in positive territory.
New orders for durable goods Consensus Forecast for May 11: +1.0 percent
Range: -1.0 percent to +5.5 percent
GDP growth in the first quarter for the Commerce Department’s second estimate was unrevised at up 1.8 percent annualized. The first quarter was notably softer than the 3.1 percent pace in the fourth quarter. Unfortunately, demand numbers were nudged down and inventory investment bumped up. Final sales of domestic product were revised to an annualized 0.6 percent from the initial estimate of 0.8 percent. Final sales to domestic purchasers were revised to 0.7 percent from the original estimate of 0.9 percent annualized. The downward revision to final sales was mainly in personal spending, now at up 2.2 percent instead of the initial 2.7 percent for the first quarter. Economy-wide inflation was unrevised, with the GDP price index posting at 1.9 percent.
Real GDP Consensus Forecast for third estimate Q1 11: +1.9 percent annual rate
Range: +1.8 to +2.2 percent annual rate
GDP price index Consensus Forecast for third estimate Q1 11: +1.9 percent annual rate
Range: +1.9 to +2.2 percent annual rate
R. Mark Rogers is the author of The Complete Idiot’s Guide to Economic Indicators, Penguin Books, 2009.
Econoday Senior Writer Mark Pender contributed to this article.
|
