|
A number of Fed officials, including Chairman Ben Bernanke, have described the current soft patch in economic growth as transitory. Details in the latest indicators suggest that this may be an accurate description though downside risks have edged up. Nonetheless, equities were down sharply for the week on concern that the economy is softening.
 Equities fell significantly on the week. Stocks dipped Monday as the sour mood from the prior week’s disappointing employment situation report continued to weigh on stocks. Also, traders worried that the Fed will raise capital requirements for large U.S. banks. Bank of America and Citigroup fell notably for the day. Equities fell significantly on the week. Stocks dipped Monday as the sour mood from the prior week’s disappointing employment situation report continued to weigh on stocks. Also, traders worried that the Fed will raise capital requirements for large U.S. banks. Bank of America and Citigroup fell notably for the day.
Most indexes were down Tuesday as unrealistic expectations were not met that Fed Chairman Ben Bernanke in a speech at an International Monetary Fund conference would hint at a third round of quantitative easing coming after QE2 ends this month. Bernanke made no mention of additional quantitative easing but called the current soft spot transitory.
Stocks got a brief lift Wednesday afternoon after the release of the Fed’s Beige Book which indicated that business contacts expect the economy to improve, albeit moderately. But stocks were down for the day after the Senate refused to delay bank regulatory reform that will cap fees that banks charge on debit card transactions. Banks generally tugged indexes down.
The bright spot for the week was Thursday as the monthly international trade report showed a boost in exports and reminded traders that the economy is still being supported by a healthy manufacturing sector. At week’s end, stocks fell with the Dow below 12,000 for the first time since March. The lack of economic news in the U.S. let traders return to worrying about sluggish growth. Also a spurt in Chinese imports, reflecting strong demand in that country, indicated that a boost in Chinese interest rates may be in the near future. Insurers were down on news on liabilities from tornado damage.
Indices closed down for the sixth straight week. The Dow was down 1.6 percent; the S&P 500, down 2.2 percent; the Nasdaq, down 3.3 percent; and the Russell 2000, down 3.5 percent.
For the year-to-date, major indexes are mixed as follows: the Dow, up 3.2 percent; the S&P 500, up 1.1 percent; the Nasdaq, down 0.3 percent; and the Russell 2000, down 3.5 percent.
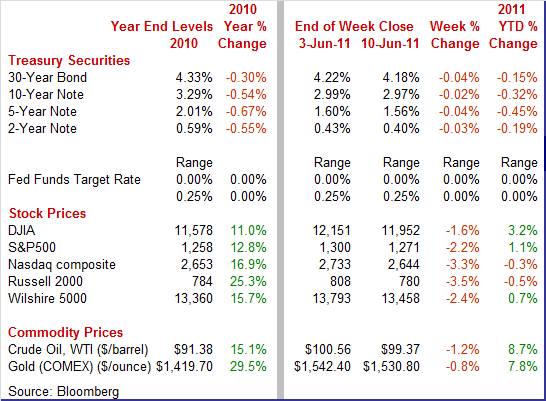
Weekly percent change column reflects percent changes for all components except interest rates. Interest rate changes are reflected in simple differences.
 Treasury yields edged down for the week on concern about softening economic growth and despite the near end to QE2 and apparent lack of QE3. Treasury yields edged down for the week on concern about softening economic growth and despite the near end to QE2 and apparent lack of QE3.
Rates nudged up Monday on worries about supply ahead of Treasury auctions of $66 billion during the week. Yields slipped Tuesday after a speech by Fed Chairman Bernanke that the Fed would need to continue monetary stimulus in response to sluggish economic news. Rates continued downward at mid-week on flight to safety on a dip in equities.
 Thursday’s improvement in exports (and rise in stocks) briefly bumped rates up only to see them slip again on Friday on concern about a sluggish economy. Also, the Fed announced not just the last of operations for QE2 but also that the Fed in July will continue to reinvest pay down on agency and mortgage-backed holdings into Treasuries. Thursday’s improvement in exports (and rise in stocks) briefly bumped rates up only to see them slip again on Friday on concern about a sluggish economy. Also, the Fed announced not just the last of operations for QE2 but also that the Fed in July will continue to reinvest pay down on agency and mortgage-backed holdings into Treasuries.
For this past week Treasury rates were down as follows: the 2-year note, down 3 basis points; the 5-year note, down 4 basis points; the 7-year note, down 2 basis points; the 10-year note, down 2 basis points; and the 30-year bond, down 4 basis points. The 3-month T-bill nudged up 1 basis point.
 For the week overall, crude oil prices were down only slightly despite fears of a weakening economy. For the week overall, crude oil prices were down only slightly despite fears of a weakening economy.
 The spot price for West Texas Intermediate dropped a buck and half on Monday on continued concern about the soft jobs market. After an essentially unchanged Tuesday, crude rose just under a dollar and a half per barrel on Wednesday after an OPEC meeting broke up without a consensus on oil output. Crude prices rose despite a build of supplies at Cushing, Oklahoma. The deadlock within OPEC boosted crude by over a dollar again on Thursday. The spot price for West Texas Intermediate dropped a buck and half on Monday on continued concern about the soft jobs market. After an essentially unchanged Tuesday, crude rose just under a dollar and a half per barrel on Wednesday after an OPEC meeting broke up without a consensus on oil output. Crude prices rose despite a build of supplies at Cushing, Oklahoma. The deadlock within OPEC boosted crude by over a dollar again on Thursday.
On Friday crude dropped more than $2 per barrel on news that Saudi Arabia will raise oil production to 10 million barrels a day next month and on concern the global economy is slowing.
Net for the week, spot prices for West Texas Intermediate declined $1.19 per barrel to settle at $99.37. Spot WTI is down from the recent high of $113.52 in early May of this year.
This week’s numbers show transitional effects coming or going in the international trade deficit, import prices, the Beige Book, and in a measure of current activity, diesel fuel purchases.
 Two factors played key roles in shrinking the trade balance in April---oil prices and shortages of parts from Japan. The April trade gap shrank to $43.7 billion from $46.8 billion in March. The shortfall was less negative than the median forecast for $49.0 billion. Exports rose 1.3 percent after jumping 4.9 percent in March. Imports slipped 0.4 percent after gaining 4.2 percent the prior month. Two factors played key roles in shrinking the trade balance in April---oil prices and shortages of parts from Japan. The April trade gap shrank to $43.7 billion from $46.8 billion in March. The shortfall was less negative than the median forecast for $49.0 billion. Exports rose 1.3 percent after jumping 4.9 percent in March. Imports slipped 0.4 percent after gaining 4.2 percent the prior month.
 The improvement in the trade deficit was led by the petroleum gap which narrowed to $26.1 billion from $30.2 billion in March. The nonpetroleum goods differential expanded to $31.2 billion from $30.2 billion the month before. The services surplus grew to $14.4 billion from $14.3 billion in March. The improvement in the trade deficit was led by the petroleum gap which narrowed to $26.1 billion from $30.2 billion in March. The nonpetroleum goods differential expanded to $31.2 billion from $30.2 billion the month before. The services surplus grew to $14.4 billion from $14.3 billion in March.
Looking at end use categories for goods, exports increased 1.6 percent while imports dipped 0.5 percent in April. The boost in exports was led by industrial supplies, with increases also seen in capital goods excluding autos and consumer goods. Auto exports fell along with food, feeds & beverages.
The decline in goods imports was led by a large drop in auto imports with industrial supplies also falling. Gains were seen in consumer goods, capital goods ex autos, and in foods, feeds & beverages.
By countries, the data for Japan stand out. On a not seasonally adjusted basis, the deficit with Japan was cut almost in half—from $6.1 billion in March to $3.6 billion in April. This clearly shows the impact of supply disruptions from the recent major earthquake and tsunami.
While one typically thinks that fewer imports mean stronger GDP for the U.S., this is not true if the imports are parts needed for final production in the U.S. So, the trade deficit improvement is not all positive. The latest trade number is technically favorable (in GDP accounting) toward GDP but part of the improvement apparently was due to lower imports from Japan which actually constrained U.S. output, especially for autos (meaning a net negative effect on Q2 GDP and industrial production). However, the decline in oil imports related to lower prices is a positive for consumers’ discretionary income.
 Inflation pressure from imports is easing, reflecting the dip back from the April peak in oil prices. Import prices rose only 0.2 percent in May, following a 2.1 percent increase in March and by far the smallest increase of the last nine months. Prices for petroleum imports fell 0.4 percent for the first decrease also in nine months. Petroleum import prices surged 11.0 percent in March and 6.6 percent in April. Inflation pressure from imports is easing, reflecting the dip back from the April peak in oil prices. Import prices rose only 0.2 percent in May, following a 2.1 percent increase in March and by far the smallest increase of the last nine months. Prices for petroleum imports fell 0.4 percent for the first decrease also in nine months. Petroleum import prices surged 11.0 percent in March and 6.6 percent in April.
 Pressure, though very modest, does appear for finished goods with import prices of consumer goods rising 0.3 percent, which extends a seven-month trend, and import prices of capital goods rising 0.2 percent. Pressure, though very modest, does appear for finished goods with import prices of consumer goods rising 0.3 percent, which extends a seven-month trend, and import prices of capital goods rising 0.2 percent.
While the latest overall import prices number is favorable, upward pressure has been building for some number of months. Overall import prices are up 12.5 percent on a year-ago basis with non-petroleum up 4.5 percent. Unless prices dip for a number of months, companies are still facing pressure to raise prices due to higher import prices.
 It’s back to the same story on consumer credit. Consumers are keeping the plastic tucked away on a daily basis but are venturing out to replace that aging motor vehicle. Total credit outstanding rose a solid $6.3 billion in April to extend gains now to seven months which is good news for the economy. But the gains are narrowly confined to non-revolving credit which rose $7.2 billion in the month for an eighth straight gain. It’s back to the same story on consumer credit. Consumers are keeping the plastic tucked away on a daily basis but are venturing out to replace that aging motor vehicle. Total credit outstanding rose a solid $6.3 billion in April to extend gains now to seven months which is good news for the economy. But the gains are narrowly confined to non-revolving credit which rose $7.2 billion in the month for an eighth straight gain.
The dominant factor in this category is vehicle sales which were strong through April but fell significantly in May, indicating a likely drop in non-revolving credit for the next report. However, the decline in motor vehicle sales is largely attributed to shortages of vehicles dependent on parts from Japan. The shortages are expected to alleviate soon with sales reviving.
Revolving credit, dominated by credit cards, fell $0.9 billion in April. March's data show revolving credit as unchanged which, unfortunately, is the second best reading since the financial collapse in 2008. Consumers are still focusing on paying down credit card debt while banks are still writing off bad debt though not as rapidly as they did during the recent recession.
The Federal Reserve released its Beige Book of anecdotal information as it prepares for the June 21 and 22 FOMC meeting. The Beige Book which is prepared by the 12 District Banks in turn added to the view that the economy is experiencing a temporary slowdown. Of importance though is that there are no signs of a sharp deceleration or pending drop in activity — but rather a moderate deceleration in growth. While some Districts reported moderate deceleration in growth, only one District — Dallas — reported an acceleration of growth.
Manufacturing activity continues to be up in 10 of 12 Districts but is slowing elsewhere. Parts shortages from Japan are one factor behind the softening. Some contacts however expected that auto production which was lost during the first half will be made up during the second half of the year. The consumer sector continues to support growth despite headwinds from headline inflation. Spending was mixed with most Districts indicating a steady to modestly increasing pace of activity. Elevated food and energy prices, as well as unfavorable weather in some parts of the country, were said to be weighing on consumers' propensity to spend. Most Districts indicated that labor markets continued to improve gradually.
 Econoday has added the Ceridian-UCLA Pulse of Commerce Index to its economic calendar. This monthly index measures the volume of diesel fuel purchased for over the road trucking and is intended as a reading of real time economic activity. It is the result of a joint effort by the UCLA Anderson School of Management and Ceridian Corporation. Econoday has added the Ceridian-UCLA Pulse of Commerce Index to its economic calendar. This monthly index measures the volume of diesel fuel purchased for over the road trucking and is intended as a reading of real time economic activity. It is the result of a joint effort by the UCLA Anderson School of Management and Ceridian Corporation.
Over the long run this index tracks industrial production overall and for manufacturing.
The latest reading for the Pulse of Commerce Index indicates a slowing in economic activity as it fell 0.9 percent on a seasonally adjusted basis in May, after declining 0.5 percent in April.
 The index has now decreased in four of the first five months of 2011, and in eight of the past 12 months. The index has now decreased in four of the first five months of 2011, and in eight of the past 12 months.
This index posted at 95.17 in May, compared to 96.00 in April with the index base year of 2007 equaling 100.
 The release indicates that UCLA statistical analysis finds a strong correlation between the PCI and the industrial production index. The report estimates that industrial production for May will be up only a meager 0.05 percent for the month. The release indicates that UCLA statistical analysis finds a strong correlation between the PCI and the industrial production index. The report estimates that industrial production for May will be up only a meager 0.05 percent for the month.
On a year over year basis, the PCI was flat in May after a 3.5 percent gain the prior month.
This index does exhibit some monthly volatility as do many economic indicators. However, on a three-month moving average basis, the month ago changes closely track industrial production. Ceridian states that the index is released on or about the 10th of each month for the prior month’s data. Next month’s release is on July 13th for June data.
The limited economic news this past week shows the temporary impact of Japan’s supply disruptions on U.S. imports and petroleum prices receding from recent highs. We likely are to see these effects in other official economic data over the next month or two.
Transitional factors—notably a dip in gasoline prices—may come into play this week, starting with producer prices and retail sales on Tuesday and consumer prices at mid-week. Then the goods producing sector takes center stage with Empire State and industrial production on Wednesday. Housing starts and Philly Fed post on Thursday. Markets could be volatile at week's end thanks to quadruple witching Friday.
The producer price index in April increased 0.8 percent, following a 0.7 percent jump in March. Energy increased 2.5 percent after a 2.6 percent advance the month before. The main culprit was gasoline which rose 3.6 percent in April, following a 5.7 percent surge. However, food also added to the latest PPI jump, rebounding 0.3 percent after a 0.2 percent dip in March. At the core level, PPI growth held steady at 0.3 percent.
PPI Consensus Forecast for May 11: +0.1 percent
Range: -0.4 to +0.3 percent
PPI ex food & energy Consensus Forecast for May 11: +0.2 percent
Range: 0.0 to +0.3 percent
Retail sales in April gained 0.5 percent, following a revised 0.9 percent increase in March. Excluding autos, sales grew 0.6 percent, following a 1.2 percent increase in March. In the latest month, price hikes likely played a role in gasoline and grocery store sales which jumped 2.7 percent and 1.5 percent, respectively. Sales excluding autos and gasoline in April posted a modest 0.2 percent gain, following a 0.7 percent jump the prior month (originally 0.6 percent). Essentially, April was about as expected but March was a little stronger than previously believed. A drop in motor vehicle sales is likely to pull down headline retail sales.
Retail sales Consensus Forecast for May 11: -0.3 percent
Range: -1.3 to 0.0 percent
Retail sales excluding motor vehicles Consensus Forecast for May 11: +0.3 percent
Range: -0.4 to +0.5 percent
Business inventories in March jumped a revised 1.2 percent, following a 0.7 percent gain the month before. The build in business inventories is lagging business sales, indicated by the stock-to-sales ratio which fell another to a new record low of 1.25. This reading indicates that inventories are too low. More recently, manufacturers’ inventories rose 1.3 percent in April.
Business inventories Consensus Forecast for April 11: +0.9 percent
Range: +0.7 to +1.0 percent
The consumer price index in April increased 0.4 percent, following a 0.5 percent hike in March. Excluding food and energy, the CPI gained 0.2 percent, up from a 0.1 percent rise in March.
By major components, energy continued its upward surge, printing a 2.2 percent boost after jumping 3.5 percent in March. Gasoline jumped 3.3 percent, following a 5.6 percent surge in March. Food prices increased 0.4 percent in April, following a 0.8 percent gain the prior month.
CPI Consensus Forecast for May 11: 0.0 percent
Range: 0.0 to +0.3 percent
CPI ex food & energy Consensus Forecast for May 11: +0.2 percent
Range: +0.1 to +0.2 percent
The Empire State manufacturing index in May fell nearly 10 points to 11.88, a level that's well over zero to indicate month-to-month growth but below April's 21.70 level to indicate a slowing rate of growth. The news was not so bad with new orders and shipments still strong, though again showing slower rates of growth than April. Job indications were special positives with the number of employees on the rise and the workweek on the rise.
Empire State Manufacturing Survey Consensus Forecast for June 11: 14.0
Range: 3.8 to 18.1
Industrial production in April was unchanged, following a 0.7 percent gain the prior month. Notably, manufacturing posted a 0.4 percent decline in April, following a 0.6 percent gain in March. The drop in manufacturing was led by auto assemblies which were weighed down by supply disruptions for parts from Japan. Outside of autos, the softening in manufacturing was not as severe. Excluding motor vehicles, manufacturing rose 0.2 percent after a 0.4 percent advance in March. Overall capacity utilization in April slipped to 76.9 percent from 77.0 percent the prior month. Looking ahead, the manufacturing component of industrial production is likely to be soft in May as production worker hours rose only 0.1 percent for the month. Regional manufacturing indexes also decelerated for May, including Philly and New York Fed indexes.
Industrial production Consensus Forecast for May 11: +0.2 percent
Range: 0.0 to +0.4 percent
Capacity utilization Consensus Forecast for May 11: 77.0 percent
Range: 72.2 to 77.1 percent
Housing starts in April gave back March’s gain, falling back 10.6 percent, following a rebound of 12.9 percent. The April annualized pace of 0.523 million units is down 23.9 percent on a year-ago basis. The drop in April was led by a 24.1 percent fall in the volatile multifamily starts component, following a 30.8 percent jump in March. The single-family component dipped 5.1 percent after rebounding 7.0 percent in March. Housing permits declined 4.0 percent in April, following a 7.5 percent surge the month before. Overall permits came in at an annualized rate of 0.551 million units and are down 12.8 percent on a year-ago basis.
Housing starts Consensus Forecast for May 11: 0.547 million-unit rate
Range: 0.530 million to 0.560 million-unit rate
Initial jobless claims for the June 4 week nudged up 1,000 to 427,000 from a revised 426,000 the prior week and 429,000 the week before that. The four-week average of 424,000 is down 2,750 in the week and is down nearly 15,000 from a month ago.
Jobless Claims Consensus Forecast for 6/11/11: 420,000
Range: 408,000 to 425,000
The general business conditions index of the Philadelphia Fed's Business Outlook Survey in May slowed to 3.9, still over zero to indicate month-to-month growth but well under April's 18.5 to indicate a much slower rate of growth. New orders and shipments both showed deceleration but positive growth while unfilled orders and inventories turned negative.
Philadelphia Fed survey Consensus Forecast for June 11: 9.0
Range: 0.0 to 19.8
Quadruple Witching
The Reuter's/University of Michigan's Consumer sentiment index for May came in at 74.3, well up from a mid-month 72.4 and implying a 76.2 reading over the last two weeks. The second half estimate is based on the full month survey sample being about evenly split between the first half of the month and the latter portion.
Consumer sentiment Consensus Forecast for preliminary June 11: 74.5
Range: 71.5 to 78.5
The Conference Board's index of leading indicators dipped 0.3 percent in April following a 0.7 percent jump in March. The weakest factor was initial jobless claims which sliced off 0.33 percentage points from the index's growth. Vendor performance subtracted 0.21 percentage points. Also negative were building permits and the factory workweek, new orders for consumer goods, and new orders for nondefense capital goods. Adding lift as always is the interest rate spread between the 10-year Treasury note and fed funds (adding 0.35 percentage points) with positive contributions also from stock prices, money supply, and consumer expectations. The coincident index edged up 0.1 percent in April versus a 0.2 percent rise the prior month.
Leading indicators Consensus Forecast for May 11: +0.2 percent
Range: -0.5 to +0.5 percent
R. Mark Rogers is the author of The Complete Idiot’s Guide to Economic Indicators, Penguin Books, 2009.
Econoday Senior Writer Mark Pender contributed to this article.
|
