|
This past week's economic data were mostly disappointing and soft, highlighted by a largely anemic employment report for May. Meanwhile, equities continue their downward adjustment to the latest views on the economy.
 Equities continued downward on disappointing economic news. However, the holiday shortened week got off to a good start on Tuesday with broad-based gains despite weak numbers from Case-Shiller, the Chicago PMI and consumer confidence. Stocks rallied after a group of euro-area finance ministers said they would decide on new aid for Greece by the end of June. Also, strong manufacturing news out of Japan lifted stocks in Asia which carried over. Equities continued downward on disappointing economic news. However, the holiday shortened week got off to a good start on Tuesday with broad-based gains despite weak numbers from Case-Shiller, the Chicago PMI and consumer confidence. Stocks rallied after a group of euro-area finance ministers said they would decide on new aid for Greece by the end of June. Also, strong manufacturing news out of Japan lifted stocks in Asia which carried over.
But it was a reversal of fortune for the remainder of the week. Equities fell sharply Wednesday as a slowing in Chinese manufacturing set the stage. ADP's employment report showed only a negligible rise in private payrolls for May and ISM manufacturing slowed sharply. Finally, late in the trading day, Moody's lowered Greece's bond rating again, pushing the country even further into junk territory and raising concerns about resolution of European sovereign debt problems.
 Economic news was close to expectations on Thursday for jobless claims and productivity. Factory orders declined a little more than projected but the durables component was unrevised from the initial estimate and the nondurables component is heavily influenced by price swings. But stocks were mostly down marginally for the day as traders finalized their positions before the Friday employment report. Economic news was close to expectations on Thursday for jobless claims and productivity. Factory orders declined a little more than projected but the durables component was unrevised from the initial estimate and the nondurables component is heavily influenced by price swings. But stocks were mostly down marginally for the day as traders finalized their positions before the Friday employment report.
At the end of the trading week, stocks fell significantly on a deeply disappointing employment report with payroll jobs rising much less than expected and the unemployment rate nudging up. Paring early losses was an ISM non-manufacturing report that came in positive and higher than expected. Also, adding to the partial intraday rebound was news that European Union and IMF officials are moving toward a second financial rescue package.
Stocks posted a fifth weekly loss. The Dow was down 2.3 percent; the S&P 500, down 2.3 percent; the Nasdaq, down 2.3 percent; and the Russell 2000, down 3.4 percent.
Equities were down in May. The Dow was down 1.9 percent; the S&P 500, down 1.4 percent; the Nasdaq, down 1.3 percent; and the Russell 2000, down 2.0 percent.
For the year-to-date, major indexes are up as follows: the Dow, up 5.0 percent; the S&P 500, up 3.4 percent; the Nasdaq, up 3.0 percent; and the Russell 2000, up 3.1 percent.
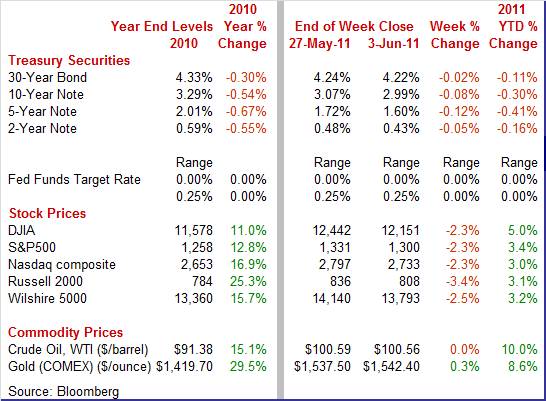
Weekly percent change column reflects percent changes for all components except interest rates. Interest rate changes are reflected in simple differences.
 Sluggish economic news weighed on Treasury yields this past week. Rates saw their largest daily decline on Wednesday due to the sharply below expectations data from ADP and ISM manufacturing. The 10-year note dropped below 3 percent for the first time this year. On Thursday, there was a drop in prices after Moody's announced it would put the U.S. government's top tier credit rating under review if there is not progress in legislation to raise the federal debt ceiling. Rates declined Friday on the weakness in the jobs report. Sluggish economic news weighed on Treasury yields this past week. Rates saw their largest daily decline on Wednesday due to the sharply below expectations data from ADP and ISM manufacturing. The 10-year note dropped below 3 percent for the first time this year. On Thursday, there was a drop in prices after Moody's announced it would put the U.S. government's top tier credit rating under review if there is not progress in legislation to raise the federal debt ceiling. Rates declined Friday on the weakness in the jobs report.
For this past week Treasury rates were down as follows: 3-month T-bill, down 1 basis point; the 2-year note, down 5 basis points; the 5-year note, down 12 basis points; the 7-year note, down 12 basis points; the 10-year note, down 8 basis points; and the 30-year bond, down 2 basis points.
 Crude oil prices were essentially unchanged for the week. There were two notably daily moves this past week. The spot price for West Texas Intermediate rose over $2 per barrel on Tuesday as the dollar fell against the euro on progress on an aid package for Greece. Crude fell Wednesday by about two and half bucks on the anemic ADP employment report. Crude oil prices were essentially unchanged for the week. There were two notably daily moves this past week. The spot price for West Texas Intermediate rose over $2 per barrel on Tuesday as the dollar fell against the euro on progress on an aid package for Greece. Crude fell Wednesday by about two and half bucks on the anemic ADP employment report.
Crude held steady Friday as downward pressure from the disappointing jobs report was offset by upward pressure from a decline in the dollar.
Net for the week, spot prices for West Texas Intermediate edged down 3 cents per barrel to settle at $100.56.
During the recovery and in recent months, the consumer and manufacturing sectors have pulled the economy forward while housing had stabilized. But the latest numbers show the consumer and manufacturing sectors hitting at least a temporary soft patch while housing may no longer be stabile.
 The latest employment situation report was mostly below expectations but still was mostly in positive territory. Nonfarm payroll employment in May grew a modest 54,000, following a revised 232,000 jump in April and a 194,000 increase in March. The May figure came in lower than analysts' downwardly revised forecast for a 170,000 expansion. Private nonfarm payrolls advanced 83,000 in May, following a 251,000 increase in April. The latest employment situation report was mostly below expectations but still was mostly in positive territory. Nonfarm payroll employment in May grew a modest 54,000, following a revised 232,000 jump in April and a 194,000 increase in March. The May figure came in lower than analysts' downwardly revised forecast for a 170,000 expansion. Private nonfarm payrolls advanced 83,000 in May, following a 251,000 increase in April.
 Sluggishness in payroll jobs was broad based. Goods-producing jobs edged up 3,000, following a 38,000 rise in April. Manufacturing jobs dipped 5,000 after a 24,000 advance the month before. However, construction nudged up 2,000 after a 5,000 increase in April. Mining gained 7,000, following an 11,000 boost in April. Sluggishness in payroll jobs was broad based. Goods-producing jobs edged up 3,000, following a 38,000 rise in April. Manufacturing jobs dipped 5,000 after a 24,000 advance the month before. However, construction nudged up 2,000 after a 5,000 increase in April. Mining gained 7,000, following an 11,000 boost in April.
Private service-providing jobs slowed to an increase of 80,000 after a 213,000 jump the prior month. There was not much to write home about as the biggest component gain was for professional & business services with a 44,000 increase in May. Health care rose 17,400 for the latest month. On the down side, retail trade fell 8,500 while leisure & hospitality dipped 6,000.
Government jobs contracted 29,000, following a 19,000 dip in April. This latest decrease was largely local government, led down by local government education.
On a positive note, wage growth improved in May as average hourly earnings rose 0.3 percent, following a 0.1 percent uptick in April. May's number topped the median forecast for a 0.2 percent increase. The average workweek for all workers in May held steady at 34.4 hours.
Turning to the household survey, the unemployment rate nudged up to 9.1 percent from 9.0 percent in April. Household employment actually rose 105,000 for the month but was outpaced by a 272,000 gain in the labor force.
Looking ahead, the manufacturing component of industrial production may be soft in May as production worker hours rose only 0.1 percent for the month. However, the private wages & salaries component of personal income should be moderately healthy as the index for aggregate earnings for private sector workers gained 0.4 percent.
The big question is whether the May numbers are a temporary soft spot or a new trend. The Labor Department indicated that severe weather did not play a notable role in the data. While the recovery/expansion has gained traction, the trajectory is somewhat lower than earlier believed.
 The Conference Board's measure of consumer spirits headed in the opposite direction from the prior week's improved reading from Reuters/University of Michigan. Pessimism is deepening according to the consumer confidence index which at 60.8 in May, for a 5.2 point loss from April, is at a six-month low, a period of time that includes the spike in oil prices and the Japanese earthquake. The Conference Board's measure of consumer spirits headed in the opposite direction from the prior week's improved reading from Reuters/University of Michigan. Pessimism is deepening according to the consumer confidence index which at 60.8 in May, for a 5.2 point loss from April, is at a six-month low, a period of time that includes the spike in oil prices and the Japanese earthquake.
Weakness is centered where it's not wanted, in the expectations component which is at a seven-month low. Expectations show deterioration for business conditions, for employment and very notably for income where more consumers suddenly see a decrease ahead versus an increase.
The assessment of the present situation also weakened with more saying, at 43.9 percent for a 1-1/2 percentage point change, indicating that jobs are hard to get. A prior easing in the rate of gas and food inflation had bolstered this report in April but a downturn in pump prices during May is not convincing consumers that inflation is on the downtrend. One-year inflation expectations rose three tenths to a very severe 6.6 percent that compares with 6.7 percent during the shocks of March.
This report contrasts sharply with last week's consumer sentiment data that showed significant improvement during May. Improvement in sentiment was primarily in the expectations component which has questions that are broader than those in the confidence report. The sentiment questions are more general about overall financial circumstances for the individual and country while the confidence questions are more focused on jobs and income ahead. Overall, the two reports suggest no better than mixed spirits that need help from more jobs and lower gasoline prices.
 In recent months, healthy demand for motor vehicles has been a bright spot in the economy. But sales dipped significantly in May and the big question is why' In recent months, healthy demand for motor vehicles has been a bright spot in the economy. But sales dipped significantly in May and the big question is why'
Sales of combined North American-made vehicles and imports dropped to an annualized 11.8 million units from 13.2 million in April. The North American component declined to 9.1 million from 10.1 million. Imports dropped to 2.7 million from 3.1 million.
Importantly, the North American component includes Japanese brands assembled in the U.S. and parts shortages limited supply of many models significantly. Lack of available Japanese brands pushed up related prices. This convinced many car buyers to wait for the desired model to become available and/or for a lower price.
The latest numbers for motor vehicle sales at face value add to the soft patch argument for the economy. But the supply disruption issue may be resolved soon and there could even be a spurt in sales in coming months from as this new source of pent up demand is alleviated.
 The manufacturing sector clearly has hit a soft patch. Monthly growth slowed very significantly in the manufacturing sector during May, according to the Institute for Supply Management whose headline composite dropped 6.9 points to a much lower-than-expected 53.5. Near-term forward momentum eased as new orders slowed a very significant 10.7 points to 51.0, but still over 50 to indicate growth compared to April (though slower growth). The export orders index slipped to 55.0 from 62.0 in April but remained moderately positive. The manufacturing sector clearly has hit a soft patch. Monthly growth slowed very significantly in the manufacturing sector during May, according to the Institute for Supply Management whose headline composite dropped 6.9 points to a much lower-than-expected 53.5. Near-term forward momentum eased as new orders slowed a very significant 10.7 points to 51.0, but still over 50 to indicate growth compared to April (though slower growth). The export orders index slipped to 55.0 from 62.0 in April but remained moderately positive.
Other readings show a significant slowing in production and a moderate slowing in hiring, and decreasing delays in delivery times that are consistent with slowing conditions. But all three are still well into positive territory, indicating that growth continues. The employment index is still encouraging as it is a vote of confidence by manufacturers that business is still on an uptrend. Inventories interestingly contracted in the month, suggesting that manufacturers were quick to keep levels down given slowing demand. It also perhaps reflects supply shortages tied to Japan.
While the latest ISM report was less positive, it still was positive. On the issue of the soft patch being temporary or not, the impact of supply shortages of parts from Japan appears to be bigger than initially expected. There are signs that Japanese manufacturers are working around disruptions related to the earthquake and tsunami and if supplies of Japanese parts return closer to normal, that will alleviate some of the softness in U.S. production.
 It turns out that there is a glimmer of hope that the economy is only in a temporary soft patch. In a rare bit of good news for this past week, the ISM reported broad month-to-month acceleration in the non-manufacturing economy. The report's composite headline index rose 1.8 points to 54.6 with strength centered where it should be, that is in new orders which rose more than four points to 56.8. It turns out that there is a glimmer of hope that the economy is only in a temporary soft patch. In a rare bit of good news for this past week, the ISM reported broad month-to-month acceleration in the non-manufacturing economy. The report's composite headline index rose 1.8 points to 54.6 with strength centered where it should be, that is in new orders which rose more than four points to 56.8.
And there may be reason to believe that the May employment situation just reflects temporary softness. The employment index accelerated nicely, up 2.1 points to a 54.0 level that for this report is very strong. In other readings, deliveries lengthened, which is a sign of strength, and backlog orders rose at a healthy pace. Given that this report is based on a broad sampling of the nation's purchasers, it indicates that economic momentum is headed back up, albeit moderately.
 After a brief respite with gains during 2009 and early 2010, home prices have fallen nine months in a row according to the S&P Case-Shiller 10-city composite index. The seasonally adjusted version is down 0.1 percent for March and down 0.2 percent for the composite 20. The good news is that the rate of decline has slowed from dips of 0.3 percent in each of the prior two months and strong declines of 0.8 percent and 0.9 percent in September and October of last year. Also, given that the readings are three-month averages suggests that the underlying unpublished March data may actually show a small gain. But the year-on-year rates are showing deterioration, at minus 2.8 percent for the 10-city index and minus 3.5 percent for the 20-city. After a brief respite with gains during 2009 and early 2010, home prices have fallen nine months in a row according to the S&P Case-Shiller 10-city composite index. The seasonally adjusted version is down 0.1 percent for March and down 0.2 percent for the composite 20. The good news is that the rate of decline has slowed from dips of 0.3 percent in each of the prior two months and strong declines of 0.8 percent and 0.9 percent in September and October of last year. Also, given that the readings are three-month averages suggests that the underlying unpublished March data may actually show a small gain. But the year-on-year rates are showing deterioration, at minus 2.8 percent for the 10-city index and minus 3.5 percent for the 20-city.
Clearly, downward pressure remains on home prices with heavy supply for both new and existing homes. The breadth of problem is seen in the fact that in the latest Case-Shiller report 18 of 20 cities show unadjusted month-to-month declines.
 Despite an bump up in the latest report for outlays, the construction sector is still having difficulty generating upward momentum. Construction spending was mixed in April as overall outlays rose 0.4 percent after posting a revised 0.1 percent uptick in March. Despite an bump up in the latest report for outlays, the construction sector is still having difficulty generating upward momentum. Construction spending was mixed in April as overall outlays rose 0.4 percent after posting a revised 0.1 percent uptick in March.
Strength for the latest month was led by a 3.1 percent improvement in private residential spending, following a 0.7 percent decline the month before. However, the gain in this component was improvements as non-new home spending jumped a monthly 7.6 percent after a 0.1 percent slip in March. For the latest month, new one-family home outlays fell 1.0 percent while new multifamily dipped 0.1 percent. Essentially, new construction—at least for the single-family component—is still depressed.
For other components, private nonresidential gained 0.5 percent in April, following a 1.4 percent increase the prior month. Public outlays fell 1.9 percent, following a 0.4 percent decrease.
The economy has clearly slowed in recent weeks. The question is whether it is just temporary or a larger loss in momentum' An argument can be made that the recent surge in energy costs—with gasoline being the most visible—caused at least a temporary and significant change in the mood of businesses and consumers to the downside. The current partial reversal in oil prices likely brings back some forward momentum. Despite the latest disappointing economic news, what are the broad underlying factors on the direction of economic growth' Although volatile, layoffs have trended down and consumers with jobs are willing to spend—if money is not just filling up the gas tank. Inventories are still low and manufacturers are increasing output to restock shelves. Businesses actually are investing in equipment & software. Profits are up. And the weak dollar is also helping manufacturers. The bottom line is that despite the soft patch, forward momentum is still positive—it is only the magnitude of growth that currently is in question.
With most recent economic reports disappointing investors, the Fed's Beige Book with its collection of anecdotal comments from the 12 District banks will garner extra attention on Wednesday for signs of recent strengthening. Thursday's International trade report will provide the latest data on exports. Jobless claims that day will be in the spotlight after last week's disappointing employment situation report.
Consumer credit outstanding increased in March as revolving credit outstanding rose $6.0 billion, following a $7.6 billion boost the month before. For a change, consumers pulled out their credit cards as revolving credit rebounded $1.9 billion after declining $2.6 billion in February. Nonrevolving credit rose $4.1 billion, compared to $10.2 billion in February.
Consumer credit Consensus Forecast for April 11: +$5.0 billion
Range: +$2.0 billion to +$6.0 billion
The Beige Book being prepared for the June 21-22 FOMC meeting is released this afternoon. Given the recently unexpected weakening in manufacturing and employment numbers, traders will be focusing on the report for any improvement in those sectors.
The U.S. international trade gap in March expanded to $48.2 billion from a revised $45.4 billion gap in February. The good news for manufacturers is that exports jumped 4.6 percent, following a 1.5 percent decline the previous month. Imports rebounded 4.9 percent after dropping 1.9 percent in February. The widening of the trade deficit was led by the petroleum gap which grew to $31.3 billion from $25.5 billion in February. The nonpetroleum goods shortfall shrank to $29.8 billion from $32.8 billion the prior month. The services surplus expanded somewhat to $13.9 billion from $13.7 billion in February.
International trade balance Consensus Forecast for April 11: -$49.0 billion
Range: -$51.0 billion to -$46.5 billion
Initial jobless claims in the May 28 week fell 6,000 to 422,000 (prior week revised to 428,000). The four-week average of 425,500 was down a sizable 14,000 and compares well with the month-ago level of 432,250. There were no special factors skewing the data with tornado-hit Missouri reporting some trouble but not enough to affect the total. Continuing claims were little changed, down 1,000 in data for the May 21 week to 3.711 million with the unemployment rate for insured workers unchanged at 3.0 percent.
Jobless Claims Consensus Forecast for 6/3/11: 418,000
Range: 415,000 to 420,000
The U.S. Treasury monthly budget report for April showed a monthly deficit of $40.5 billion, down from $188.2 billion the month before. April typically is a surplus month but has been negative each year starting in 2009. Looking ahead, the month of May typically shows a moderate deficit for the month. Over the past 10 years, the average deficit for the month of May has been $90.0 billion and $120.4 billion over the past 5 years. The May 2010 deficit came in at $135.9 billion.
Treasury Statement Consensus Forecast for May 11: -$140.0 billion
Range: -$165.0 billion to -$130.0 billion.
R. Mark Rogers is the author of The Complete Idiot's Guide to Economic Indicators, Penguin Books, 2009.
Econoday Senior Writer Mark Pender contributed to this article.
|
