|
Economic news was wide ranging by sector and often missed expectations significantly—both on the high side and low side. In turn, traders were whipsawed on whether economic momentum was improving or slipping. Markets generally were on the soft side for the week.
 The big decline during the week was Monday in tandem with global stocks on concern that Europe’s sovereign debt problems are worsening and that global growth is slipping. On the prior Friday, Fitch Ratings cut Greece’s credit rating sharply. In the U.S., the Chicago Fed’s national economic activity index declined. The big decline during the week was Monday in tandem with global stocks on concern that Europe’s sovereign debt problems are worsening and that global growth is slipping. On the prior Friday, Fitch Ratings cut Greece’s credit rating sharply. In the U.S., the Chicago Fed’s national economic activity index declined.
Tuesday was a day of battling indicators as new home sales jumped but the lesser known Richmond Fed manufacturing index actually turned negative which added to concern about a slumping manufacturing sector. Traders decided that the manufacturing news outweighed that for housing and stocks dipped for the day.
On economic news, Wednesday should have been a down day as durables orders fell more than expected and FHFA home prices continued to decline. Higher commodity prices lifted the energy patch in particular and also broad indexes.
Economic news again disappointed Thursday with soft GDP and an unexpected rise in jobless claims. But earnings were the focus as Tiffany and NatApp beat analysts’ forecasts. The week ended on a positive note with moderate gains on a better-than-expected consumer sentiment number and despite a drop in pending home sales. Earlier in the morning, personal income met expectations. Also, commodities gained and added support to stocks after G-8 leaders stated that the global economy is strengthening.
Net for the week, most equities were down. The Dow was down 0.6 percent; the S&P 500, down 0.2 percent; and the Nasdaq, down 0.2 percent. The Russell 2000 rebounded 0.9 percent.
For the year-to-date, major indexes are up as follows: the Dow, up 7.5 percent; the S&P 500, up 5.8 percent; the Nasdaq, up 5.4 percent; and the Russell 2000, up 6.7 percent.
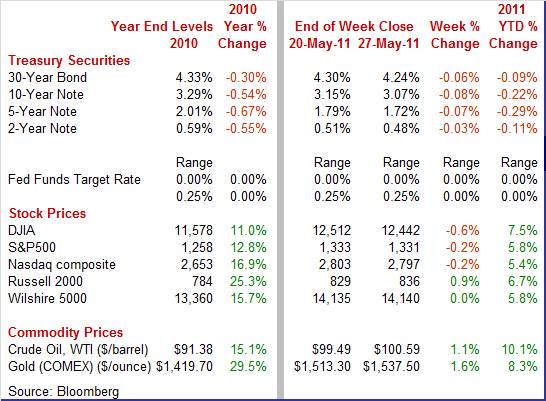
Weekly percent change column reflects percent changes for all components except interest rates. Interest rate changes are reflected in simple differences.
 Treasury rates ended the week down, on economic news that more often than not showed a slowing economy and on flight to safety. Rates edged down on Monday and Tuesday on the declines in Chicago Fed and Richmond Fed reports. After a mixed Wednesday, yields fell notably Thursday on the jump in jobless claims and on fears that the IMF might withhold aid for Greece. The 10-year Treasury note yield dipped to its lowest level of the year. Rates were mixed Friday but mostly up slightly on consumer sentiment and on comments from G-8 leaders. Treasury rates ended the week down, on economic news that more often than not showed a slowing economy and on flight to safety. Rates edged down on Monday and Tuesday on the declines in Chicago Fed and Richmond Fed reports. After a mixed Wednesday, yields fell notably Thursday on the jump in jobless claims and on fears that the IMF might withhold aid for Greece. The 10-year Treasury note yield dipped to its lowest level of the year. Rates were mixed Friday but mostly up slightly on consumer sentiment and on comments from G-8 leaders.
For this past week Treasury rates were down as follows: the 2-year note, down 3 basis points; the 5-year note, down 7 basis points; the 7-year note, down 8 basis points; the 10-year note, down 8 basis points; and the 30-year bond, down 6 basis points. The 3-month bill was unchanged.
 The spot price of crude rose slightly this past week. However, crude headed in the other direction initially, losing over $2 per barrel on Monday on worries over Greek sovereign debt problems and a stronger dollar. Also, U.S. economic news was negative and a Chinese index of manufacturing declined. The spot price of crude rose slightly this past week. However, crude headed in the other direction initially, losing over $2 per barrel on Monday on worries over Greek sovereign debt problems and a stronger dollar. Also, U.S. economic news was negative and a Chinese index of manufacturing declined.
Spot West Texas Intermediate headed up Tuesday, rising somewhat under $2 on a drop in the dollar and on news that Goldman Sachs raised its outlook for crude prices. Crude gained another buck and a half at midweek on a drop in stockpiles of distillate fuel supplies. Prices were essentially flat the last two trading days of the week.
Net for the week, spot prices for West Texas Intermediate rose $1.10 per barrel to settle at $100.59.
This past week saw key indicators out on the overall economy, housing, the consumer, and housing. The results were quite varied.
 The economy did not get the hoped for upgrade for the start of the year. The Commerce Department’s second estimate for quarter GDP growth was unrevised at up 1.8 percent annualized and came in lower than the consensus forecast for 2.1 percent. The first quarter remains notably softer than the 3.1 percent pace in the fourth quarter. The economy did not get the hoped for upgrade for the start of the year. The Commerce Department’s second estimate for quarter GDP growth was unrevised at up 1.8 percent annualized and came in lower than the consensus forecast for 2.1 percent. The first quarter remains notably softer than the 3.1 percent pace in the fourth quarter.
Unfortunately, demand numbers were nudged down and inventory investment bumped up. Final sales of domestic product were revised to an annualized 0.6 percent from the initial estimate of 0.8 percent. Final sales to domestic purchasers were revised to 0.7 percent from the original estimate of 0.9 percent annualized. The downward revision to final sales was mainly in personal spending, now at up 2.2 percent instead of the initial 2.7 percent for the first quarter.
Despite the soft demand figures, strength is where you want it. For overall relative strength (not merely the direction of revisions), PCEs growth remained moderately healthy. Also, business investment in equipment & software is strong. Inventory investment is positive and levels are still low. Weakness remained in government purchases, nonresidential structures, and net exports.
Economy-wide inflation was unrevised, with the GDP price index posting at 1.9 percent.
A clear positive in the latest report was a boost in profits. Corporate profits in the first quarter expanded to $1.450 trillion annualized—up from $1.369 trillion in the fourth quarter. Profits in the first quarter were up an annualized 25.6 percent, following a 12.6 percent drop the quarter before. Profits are after tax but without inventory valuation and capital consumption adjustments. The good news is that profits are at an all-time high and provide fuel for business investment in the real economy and ammunition for acquisitions.
Even though the headline GDP number was disappointing, odds are that growth will not slow further in coming quarters. Momentum is still favorable for consumer spending, equipment investment, exports, and inventories.
Income growth continued to support the consumer sector in April. Spending was moderately strong but largely due to higher prices. Notably, inflation is still on the warm side.
 Fed officials have been saying that recently higher inflation is transitory. For the health of the economy, they need to be right as seen in the negative impact of inflation on the latest personal income report. As the report’s biggest positive, personal income in April posted a 0.4 percent gain equaling the pace in March. Importantly, the key wages & salaries component increased 0.4 percent, following a boost of 0.3 percent in March. Fed officials have been saying that recently higher inflation is transitory. For the health of the economy, they need to be right as seen in the negative impact of inflation on the latest personal income report. As the report’s biggest positive, personal income in April posted a 0.4 percent gain equaling the pace in March. Importantly, the key wages & salaries component increased 0.4 percent, following a boost of 0.3 percent in March.
However, real disposable income (after taxes and after inflation) in April was flat, matching the March pace but actually topping February’s 0.1 percent decline. Consumers have had no recent improvement in real spending power.
 Spending looks healthy at face value but inflation was the underlying factor for the most part. Personal consumption expenditures expanded at a 0.4 percent pace in April after increasing 0.5 percent the month before. Providing upward lift was another sizeable increase in gasoline sales. Spending looks healthy at face value but inflation was the underlying factor for the most part. Personal consumption expenditures expanded at a 0.4 percent pace in April after increasing 0.5 percent the month before. Providing upward lift was another sizeable increase in gasoline sales.
Real spending has been soft recently, rising 0.1 percent in April and in March after a 0.4 percent jump in February.
Strength in nominal PCEs was largely in nondurables, up 0.8 percent after a 0.9 percent jump in March. Durables rebounded 0.3 percent, following a 0.7 percent drop the month before. Services spending slowed to a 0.2 percent increase after a 0.6 percent jump in March.
 Energy is keeping overall inflation on the high side. The headline PCE price index posted a 0.3 percent gain, down marginally from 0.4 percent in March but still strong. However, the core rate firmed to 0.2 percent from 0.1 percent in March. Energy is keeping overall inflation on the high side. The headline PCE price index posted a 0.3 percent gain, down marginally from 0.4 percent in March but still strong. However, the core rate firmed to 0.2 percent from 0.1 percent in March.
On a year-ago basis, headline PCE inflation worsened to 2.2 percent from 1.8 percent in March. Core PCE price inflation edged up to 1.0 percent on a year-ago basis from 0.9 percent in March. Core inflation has been on an uptrend since the recent year-ago low of 0.7 percent in December 2010.
The good news is that income growth remains moderately strong. The bad news is that inflation has eaten into those earnings and has restrained real spending. The slowing in real spending may be transitory (a recently favorite word among Fed officials) but softer inflation and healthier income growth are needed.
 Maybe consumers believe FedSpeak saying that higher gasoline prices are transitory—or maybe they're simply seeing lower prices at the pump. According to the Reuters/University of Michigan consumer sentiment survey, consumers are not as glum as many fear. The index for May came in at 74.3, well up from a mid-month 72.4 and implying a 76.2 reading over the last two weeks. The second half estimate is based on the full month survey sample being about evenly split between the first half of the month and the latter portion. This is just shy of February's recovery best level of 77.5 which was registered of course before the spike in oil took hold and before the disaster in Japan struck. Maybe consumers believe FedSpeak saying that higher gasoline prices are transitory—or maybe they're simply seeing lower prices at the pump. According to the Reuters/University of Michigan consumer sentiment survey, consumers are not as glum as many fear. The index for May came in at 74.3, well up from a mid-month 72.4 and implying a 76.2 reading over the last two weeks. The second half estimate is based on the full month survey sample being about evenly split between the first half of the month and the latter portion. This is just shy of February's recovery best level of 77.5 which was registered of course before the spike in oil took hold and before the disaster in Japan struck.
 New home sales actually put together two sizeable increases in a row with April jumping 7.3 percent, following an 8.3 percent increase the month before. But the advances are from low levels as we saw large declines in January and February of 6.3 percent and 10.3 percent, respectively. The February number was a record low. April’s annualized sales pace of 323,000 units is down 23.1 percent on a year-ago basis. New home sales actually put together two sizeable increases in a row with April jumping 7.3 percent, following an 8.3 percent increase the month before. But the advances are from low levels as we saw large declines in January and February of 6.3 percent and 10.3 percent, respectively. The February number was a record low. April’s annualized sales pace of 323,000 units is down 23.1 percent on a year-ago basis.
Importantly, April’s improvement drew down supply to 6.5 months from 7.2 in March and 7.9 in February and down from a recent high of 12.1 set in January 2009. In a useful signpost for how deeply the residential sector has contracted, only 175,000 new homes are up for sale for the lowest total in data that goes back to 1963.
Low supply may be firming home prices, up 1.6 percent for a median $217,900 to pull the year-on-year rate back into positive ground at 4.6 percent. However, the price increase may be the effect of a shift in composition of sales more toward higher priced homes (or away from less expensive homes). More reliable home price data (further below) indicate that prices are under renewed downward pressure.
 The latest pending home sales number point again to how volatile sales have been and that there is no sustained strength in housing. The National Association of Realtor’s pending home sales index in April fell 11.6 percent from a downward revised 92.6 in March. Levels are still notably weak as sales are down 26.5 percent on a year ago basis but April 2010 was artificially high due to expiration of special tax credits for homebuyers. The latest pending home sales number point again to how volatile sales have been and that there is no sustained strength in housing. The National Association of Realtor’s pending home sales index in April fell 11.6 percent from a downward revised 92.6 in March. Levels are still notably weak as sales are down 26.5 percent on a year ago basis but April 2010 was artificially high due to expiration of special tax credits for homebuyers.
Regionally the April decline was centered in the largest region which is the South where pending sales plunged 17.2 percent. This decline could reflect the extraordinarily adverse weather that hit the region during the month. Also, higher gasoline prices are said to have cut down on house shopping nationally. With the return of more normal weather and with a dip in gasoline prices, sales may pick up in coming months. But real strength is dependent on healthier job growth and less restrictive credit.
 Due to weak demand, tight credit, and still hefty supply, house prices remain under renewed downward pressure. The recent downtrend in house prices continues as the FHFA purchase only house price index dipped another 0.3 percent in March, following a decrease of 1.5 percent in February. This index has declined for five months in a row after scattered improvement in 2009. The FHFA house price index is based on prices from repeat transactions and is not affected by shifts in the composition of home sales between low and high end. Due to weak demand, tight credit, and still hefty supply, house prices remain under renewed downward pressure. The recent downtrend in house prices continues as the FHFA purchase only house price index dipped another 0.3 percent in March, following a decrease of 1.5 percent in February. This index has declined for five months in a row after scattered improvement in 2009. The FHFA house price index is based on prices from repeat transactions and is not affected by shifts in the composition of home sales between low and high end.
On a year-on-year basis, the FHFA HPI is down 5.8 percent, compared to down 5.5 percent in February. Five of the nine Census Divisions declined on a monthly basis in March. On a year-ago basis, the region showing the greatest weakness is the Mountain Division, down by 9.5 percent, followed by Pacific, down 8.5 percent, and South Atlantic, down 8.4 percent.
 Once again, the new durables orders series is living up to its reputation as one of the most volatile monthly data series. Durables orders fell back in April, declining 3.6 percent, following a 4.4 percent jump in March. Excluding transportation, new orders slipped 1.5 percent, following a 2.5 percent rise in March. Weakness in the latest month was broad-based but also followed a broad-based jump in March. Once again, the new durables orders series is living up to its reputation as one of the most volatile monthly data series. Durables orders fell back in April, declining 3.6 percent, following a 4.4 percent jump in March. Excluding transportation, new orders slipped 1.5 percent, following a 2.5 percent rise in March. Weakness in the latest month was broad-based but also followed a broad-based jump in March.
Weakness in the latest month was led by transportation equipment which dropped a monthly 9.5 percent in April after a 10.3 percent boost the month before. Within transportation, the fall was led by a plunge in nondefense aircraft (essentially a drop in Boeing orders). Motor vehicles and defense aircraft also declined. The auto industry apparently has been harder hit than initially believed by parts shortages due to the earthquake and tsunami in Japan. Motor vehicle orders were notably higher earlier in March and sales have continued at healthy levels through April. Outside of transportation, weakness was widespread but generally followed strong gains in March.
Clearly, the latest durables report is disappointing but not so much in the context of its volatility and the strong gain in March. Also, Boeing orders certainly will rebound as will auto orders once supply disruptions ease. While there is some uncertainty, given overall demand and low inventories, durables orders and production are more likely than not to pick up strength in coming months.
The economy’s growth rate has moderated as it has moved from recovery to expansion. Yes, from a technical perspective, the recovery turned to expansion when output surpassed the previous peak which actually occurred in the third quarter of 2010 based on GDP. Housing is still in the doldrums but the consumer sector continues to advance and will strengthen along with job gains—and especially if oil prices continue to decline. The latter is a bit iffy unless the Libyan situation improves soon. And manufacturing likely is still on an uptrend—especially with continued help from a weak dollar encouraging exports.
The consumer is in the spotlight in this holiday shortened week, starting with consumer confidence Tuesday. At midweek, a boost in motor vehicle sales would lessen concerns about manufacturing strength and the consumer's willingness to spend. Thursday's jobless claims report precedes the highlight of the week — Friday’s employment report for May. Also garnering attention are the ISMs — manufacturing on Wednesday and nonmanufacturing at week’s close.
Memorial Day. All markets closed.
The Chicago PMI in April slowed to 67.6, down from 70 readings in March and February which were 25-year highs. The new orders index was strong at a reading of 66.3 though down from even stronger growth during the prior four months.
Chicago PMI Consensus Forecast for May 11: 63.0
Range: 59.0 to 67.0
The Conference Board's consumer confidence index rose 1.6 points in April to 65.4. Outside of February's 72.0, April was the best reading of the recovery. Improved optimism of the jobs market was the reason for the gain. A big headline was a 2.6 percentage point drop in those saying jobs are currently hard to get to 41.8 percent. This was the lowest reading in more than two years. Apparently, consumers are seeing improvement in the economy as more anticipate their income increasing six months out, 16.7 percent versus 15.2 in March. Looking ahead, there could be further modest improvement in confidence as gasoline prices have eased. However, the decline in jobless claims largely stalled for the month.
Consumer confidence Consensus Forecast for May 11: 66.5
Range: 57.0 to 71.0
Sales of domestic light motor vehicles rose to 10.1 million in April from 9.9 million the prior month. Imports slipped to 3.1 million from 3.2 million annualized. Sales of domestics and imports combined were essentially steady in April at a 13.2 million unit annualized pace, compared to 13.1 million in March. Demand is still healthy but prices have been firming and some models are seeing shortages due to supply disruptions from Japan.
Motor vehicle domestic sales Consensus Forecast for May 11: 9.7 million-unit rate
Range: 9.5 to 10.2 million-unit rate
The composite index from the ISM manufacturing survey decelerated slightly in April to 60.4 from 61.2 in March. Nonetheless, this is a very healthy pace. The composite index has been above the 60 mark for four consecutive months, indicating activity well above the breakeven mark of 50. Looking ahead, the indexes for new orders remained robust at 61.7 though lower than March’s 63.3. However, more recent regional manufacturing surveys have shown significant softening for May.
ISM manufacturing composite index Consensus Forecast for May 11: 57.5
Range: 55.0 to 59.5
Construction spending in March rebounded 1.4 percent after dropping a revised 2.4 percent in February. The latest rise was led by a 2.6 percent boost in private residential outlays, following a 6.8 percent plunge the prior month. Private nonresidential construction spending gained 1.8 percent, following a 1.0 percent rise in February. Public outlays edged up 0.1 percent after a 1.4 percent decrease the previous month. Looking ahead, the 10.6 percent plunge in housing starts in April points to a decline in the residential component of outlays for the month.
Construction spending Consensus Forecast for April 11: +0.1 percent
Range: -1.5 to +0.7 percent
Initial jobless claims for the May 21 week rose 10,000 to a 424,000 level. The Labor Department did not cite any weather or auto-related factors for the results. The four-week average of 438,500 is nearly 30,000 higher than the prior month.
Jobless Claims Consensus Forecast for 5/28/11: 420,000
Range: 410,000 to 430,000
Nonfarm business productivity slowed to an annualized 1.6 percent gain in the first quarter after advancing 2.9 percent in the previous quarter. The growth in productivity reflected an output gain of 3.1 percent in the nonfarm business sector, down from a 4.4 percent boost in the prior quarter. Hours worked increased an annualized 1.4 percent after a 1.5 percent rise in the fourth quarter. Unit labor costs worsened to a 1.0 percent increase from a 1.0 percent decline in the fourth quarter. Looking ahead, the revisions to first quarter numbers should be modest as the second estimate for first quarter real GDP (1.8 percent annualized) was unchanged from the initial estimate. Productivity and costs use many of the same source data for the output component as used for GDP.
Nonfarm Business Productivity Consensus Forecast for revised Q1 11: +1.7 percent annual rate
Range: +1.5 to +2.0 percent annual rate
Unit Labor Costs Consensus Forecast for revised Q1 11: +0.8 percent annual rate
Range: -0.5 to +1.2 percent annual rate
Factory orders in March jumped 3.0 percent after a 0.7 percent gain the prior month. Shipments, which ultimately of course track new orders, rose 2.7 percent in March following a 0.6 percent gain in February. More recently, durables orders fell back in April, declining 3.6 percent, following a revised 4.4 percent jump in March. Excluding transportation, new durables orders slipped 1.5 percent, following a 2.5 percent rise in March.
Factory orders Consensus Forecast for April 11: -0.9 percent
Range: -2.5 to -0.5 percent
Nonfarm payroll employment in April expanded a healthy 244,000, following a revised 221,000 advance in March and a 235,000 rise in February. Private nonfarm payrolls were even stronger, growing 268,000 in April, following a 231,000 rise in March. Government jobs fell 24,000, following a 10,000 dip in February. Wages were sluggish in April as average hourly earnings rose 0.1 percent, following a 0.2 percent gain in March. The average workweek for all workers posted at 34.3 hours, the same as in March.
From the household survey, the unemployment rate rose to 9.0 percent from 8.8 percent in March. Looking ahead, the headline payroll number will be important but a side show may be debate over how much McDonald's new “national hiring day” affected recent numbers. Was there a notable impact and was it more in May or in April since hiring appears to have been during and after the April payroll survey period'
Nonfarm payrolls Consensus Forecast for May 11: +190,000
Range: +125,000 to +250,000
Private payrolls Consensus Forecast for May 11: +210,000
Range: +155,000 to +275,000
Unemployment rate Consensus Forecast for May 11: 8.9 percent
Range: 8.7 to 9.1 percent
Average workweek Consensus Forecast for May 11: 34.3 hours
Range: 34.2 to 34.3 hours
Average hourly earnings Consensus Forecast for May 11: +0.2 percent
Range: +0.1 to +0.2 percent
The composite index from the ISM non-manufacturing survey dropped notably in April, coming in at 52.8 versus 57.3 the prior month. By components, new orders were down sharply while business activity and employment also tugged down on the headline reading. Supplier deliveries actually had a modest lift while the contribution from inventories was unchanged. The most notable deceleration was for the new orders index which slowed to 52.7 from 64.1 in April. Despite the lower number, new orders remained in positive territory (above breakeven of 50) as did the overall composite and the remaining components—meaning economic activity is still on an uptrend but a softer one.
ISM non-manufacturing composite index Consensus Forecast for May 11: 54.0
Range: 52.0 to 55.0
R. Mark Rogers is the author of The Complete Idiot’s Guide to Economic Indicators, Penguin Books, 2009.
Econoday Senior Writer Mark Pender contributed to this article.
|
