|
Soft numbers for economic indicators are standing out more to indicate that the recovery’s trajectory has leveled a bit, though likely temporarily. And the recovery’s initial surge in earnings also has tapered somewhat.
 Equities were choppy this week and ended down moderately. Economic news disappointed more on the downside than otherwise. Corporate news was mixed. The week started on a down note as the New York Fed’s Empire State manufacturing index came in notably below expectations. Also, worries about European debt resurfaced, especially with the loss of the IMF chief being arrested for alleged sexual misconduct with a hotel housekeeper in New York. The IMF has led efforts to rescue European countries with sovereign debt problems. Also pushing stocks down was a reduction in earnings forecast by home improvement retailer Lowe’s. Adding to market jitters, the U.S. government officially hit its legal borrowing limit. The Treasury is now using various accounting measures to delay the effective limit until August 2 to allow for political resolution for raising the debt ceiling. Equities were choppy this week and ended down moderately. Economic news disappointed more on the downside than otherwise. Corporate news was mixed. The week started on a down note as the New York Fed’s Empire State manufacturing index came in notably below expectations. Also, worries about European debt resurfaced, especially with the loss of the IMF chief being arrested for alleged sexual misconduct with a hotel housekeeper in New York. The IMF has led efforts to rescue European countries with sovereign debt problems. Also pushing stocks down was a reduction in earnings forecast by home improvement retailer Lowe’s. Adding to market jitters, the U.S. government officially hit its legal borrowing limit. The Treasury is now using various accounting measures to delay the effective limit until August 2 to allow for political resolution for raising the debt ceiling.
Stocks continued downward Tuesday on an expectedly flat number for industrial production and on a drop in housing starts. Hard hit were homebuilders and heavy construction equipment maker Caterpillar. Also, Hewlett-Packard lowered its sales forecast. In contrast, Home Depot rose after citing a jump in first quarter profit.
Equities rebounded at midweek on a jump in oil prices as oil inventories were lower than expected. The energy patch benefitted from the rise in oil prices—notably Chevron. Also supporting equities were the Fed’s FOMC minutes which more strongly indicated that policy will remain very accommodative for some time. Adding to upward momentum, computer maker Dell posted stronger-than-expected results.
Stocks gained on Thursday on a larger-than-forecast drop in initial jobless claims and on an extremely strong IPO by LinkedIn, which encouraged belief there will be more such IPOs. Stocks were up despite a decline in existing home sales, a dip in leading indicators, and a soft Philly Fed report. The week ended down on weak retailer numbers, notably from Gap and Aeropostale. Also, increased chatter that Greece will default on sovereign debt bumped stocks down. Apple pulled down the Nasdaq on news of an explosion at a factory in China that produces iPhones.
Equities were down this past week. The Dow was down 0.7 percent; the S&P 500, down 0.3 percent; the Nasdaq, down 0.9 percent; and the Russell 2000, down 0.8 percent.
For the year-to-date, major indexes are up as follows: the Dow, up 8.1 percent; the S&P 500, up 6.0 percent; the Nasdaq, up 5.7 percent; and the Russell 2000, up 5.8 percent.
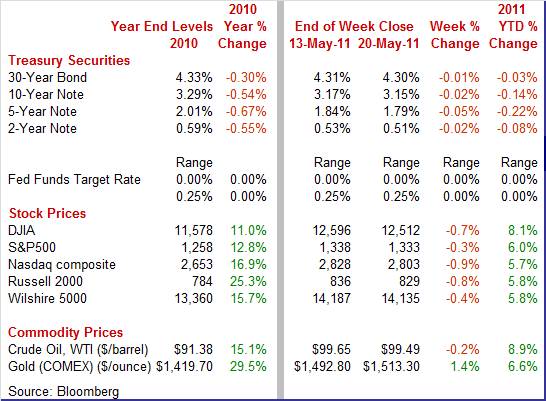
Weekly percent change column reflects percent changes for all components except interest rates. Interest rate changes are reflected in simple differences.
 Treasury yields end the week down slightly with the 3-month T-bill an exception. Rates softened as a result on mostly disappointing economic news for the week, including for Empire State, housing starts, industrial production, existing home sales, Philly Fed, and leading indicators. Providing some support for rates were better-than-expected jobless claims. Throughout the week, confirmation that the Fed will maintain very accommodative monetary policy weighed on rates. Treasury yields end the week down slightly with the 3-month T-bill an exception. Rates softened as a result on mostly disappointing economic news for the week, including for Empire State, housing starts, industrial production, existing home sales, Philly Fed, and leading indicators. Providing some support for rates were better-than-expected jobless claims. Throughout the week, confirmation that the Fed will maintain very accommodative monetary policy weighed on rates.
 Curiously, yields actually rose the day the Fed released FOMC minutes on Wednesday but the modest rise in rates was due to a flow of funds into equities as stocks posted healthy gains at midweek. Also, throughout the week, flight to safety concerns supported Treasuries as Greece increasingly is seen as defaulting on sovereign debt. The latest proposal to extend the maturity of Greek debt is seen by many as the same thing as default. Finally, overseas news added to slippage in rates as the German Bundesbank indicated that the German economy likely will moderate in coming months. Curiously, yields actually rose the day the Fed released FOMC minutes on Wednesday but the modest rise in rates was due to a flow of funds into equities as stocks posted healthy gains at midweek. Also, throughout the week, flight to safety concerns supported Treasuries as Greece increasingly is seen as defaulting on sovereign debt. The latest proposal to extend the maturity of Greek debt is seen by many as the same thing as default. Finally, overseas news added to slippage in rates as the German Bundesbank indicated that the German economy likely will moderate in coming months.
For this past week Treasury rates were down as follows: the 2-year note, down 2 basis points; the 5-year note, down 5 basis points; the 7-year note, down 3 basis points; the 10-year note, down 2 basis points; and the 30-year bond, down 1 basis point. The 3-month T-bill firmed 2 basis points. Treasury yields are near lows for the year.
 The spot price of crude oil ended the week essentially unchanged. There were two notable daily price moves, starting with Monday as Army Engineers opened gates to spillways on the Mississippi to reduce flooding in metro areas and also reducing the likelihood of flooding refineries. The spot price of West Texas Intermediate dipped almost $2 per barrel for the day. The spot price of crude oil ended the week essentially unchanged. There were two notable daily price moves, starting with Monday as Army Engineers opened gates to spillways on the Mississippi to reduce flooding in metro areas and also reducing the likelihood of flooding refineries. The spot price of West Texas Intermediate dipped almost $2 per barrel for the day.
At midweek, news of lower-than-expected crude inventories lifted WTI by $3 per barrel to $100 per barrel.
Net for the week, spot prices for West Texas Intermediate nudged down 16 cents per barrel to settle at $99.49, high but notably down from the recent high of over $113 per barrel in late April and early May.
Economic news was mixed this past week with manufacturing reports positive but decelerating and housing negative. Nearly all reports came in below expectations.
 Manufacturing has been leading the recovery but this sector weakened in April. However, the uptrend may not have softened too much. April likely reflected a temporary shortage of parts from Japan due to shutdowns from the earthquake and tsunami. Overall industrial production in April was unchanged, following a revised 0.7 percent gain the prior month (originally up 0.8 percent). Notably, manufacturing posted a 0.4 percent decline in April, following a 0.6 percent gain in March. The drop in manufacturing was led by auto assemblies which were weighed down by supply disruptions for parts from Japan. Foreign owned auto plants in the U.S. have grown to be a significant share of motor vehicle output. Manufacturing has been leading the recovery but this sector weakened in April. However, the uptrend may not have softened too much. April likely reflected a temporary shortage of parts from Japan due to shutdowns from the earthquake and tsunami. Overall industrial production in April was unchanged, following a revised 0.7 percent gain the prior month (originally up 0.8 percent). Notably, manufacturing posted a 0.4 percent decline in April, following a 0.6 percent gain in March. The drop in manufacturing was led by auto assemblies which were weighed down by supply disruptions for parts from Japan. Foreign owned auto plants in the U.S. have grown to be a significant share of motor vehicle output.
 Outside of autos, the softening in manufacturing was not as severe. Excluding motor vehicles, manufacturing rose 0.2 percent after a 0.4 percent advance in March. For other industrial sectors, utilities increased 1.7 percent after gaining 0.7 percent in March. Mining rose 0.8 percent after a 1.4 percent jump the month before. Outside of autos, the softening in manufacturing was not as severe. Excluding motor vehicles, manufacturing rose 0.2 percent after a 0.4 percent advance in March. For other industrial sectors, utilities increased 1.7 percent after gaining 0.7 percent in March. Mining rose 0.8 percent after a 1.4 percent jump the month before.
Within manufacturing, durable goods dropped 1.0 percent in April. The output of motor vehicles and parts fell 8.9 percent after increasing 3.6 percent in March. Nondurables edged up 0.1 percent in April after advancing 0.5 percent in March.
Indeed, motor vehicle assemblies declined notably to an annualized pace of 7.66 million units for autos and light trucks in April, down from 8.76 million the month before. This is a sharp contrast to how well unit sales have been holding up, indicating that auto producers had no reason to cut production except due to shortages of parts. As supply problems alleviate, assemblies will return to higher levels, based on healthy demand.
Overall capacity utilization in April slipped to 76.9 percent from 77.0 percent the prior month. From the Fed’s perspective, this is still too low to be concern for general supply side inflation.
The latest industrial production report was disappointing at the headline level and for total manufacturing. But the auto industry is relatively healthy based on demand, and recovery should be expected soon for assemblies. Non-auto manufacturing is mixed but still net positive. Nonetheless, recent manufacturing surveys suggest slower growth in output in May, though it is open for debate whether it is a trend or just a monthly blip down.
 Current manufacturing activity in New York State and in the mid-Atlantic region decelerated in May but expectations are higher for coming months. The Empire State index fell nearly 10 points to 11.88, a level that's well over zero to indicate month-to-month growth but below April's 21.70 level to indicate a slowing rate of growth. Current manufacturing activity in New York State and in the mid-Atlantic region decelerated in May but expectations are higher for coming months. The Empire State index fell nearly 10 points to 11.88, a level that's well over zero to indicate month-to-month growth but below April's 21.70 level to indicate a slowing rate of growth.
The news is definitely not that bad with new orders and shipments still strong, though again showing slower rates of growth than April. Unfilled orders show an increasing rate of growth with inventories posting a sizable build. Job indications are special positives with the number of employees on the rise and the workweek on the rise. The increased hiring certainly is a vote of confidence by New York manufacturers that output is still on a healthy uptrend.
 Like the Empire State report, the Philly Fed report showed slowing conditions in the manufacturing sector. The general business conditions index slowed to 3.9, still over zero to indicate month-to-month growth but well under April's 18.5 to indicate a much slower rate of growth. New orders and shipments both show slowing while unfilled orders and inventories turned negative. Like the Empire State report, the Philly Fed report showed slowing conditions in the manufacturing sector. The general business conditions index slowed to 3.9, still over zero to indicate month-to-month growth but well under April's 18.5 to indicate a much slower rate of growth. New orders and shipments both show slowing while unfilled orders and inventories turned negative.
The outlook numbers are mixed. For Empire, the outlook numbers showed broad-based improvement with the index for general business conditions rising to 52.69 from 47.44 in March (keeping in mind that breakeven for both surveys is zero). However, Philly index for the outlook in general business conditions eased to 16.6 from 33.6 in April. The latest reading is still higher than the comparable figure for current conditions in May.
 The best one can say is that housing is trending flat and is not declining—on average with emphasis on average. Housing starts in April gave back March’s gain, falling back 10.6 percent, following a rebound of 12.9 percent in March. The April annualized pace of 0.523 million units posted below the median market forecast for 0.570 million units and is down 23.9 percent on a year-ago basis. The drop in April was led by a 24.1 percent fall in the volatile multifamily starts component, following a 30.8 percent jump in March. The single-family component dipped 5.1 percent after rebounding 7.0 percent in March. The best one can say is that housing is trending flat and is not declining—on average with emphasis on average. Housing starts in April gave back March’s gain, falling back 10.6 percent, following a rebound of 12.9 percent in March. The April annualized pace of 0.523 million units posted below the median market forecast for 0.570 million units and is down 23.9 percent on a year-ago basis. The drop in April was led by a 24.1 percent fall in the volatile multifamily starts component, following a 30.8 percent jump in March. The single-family component dipped 5.1 percent after rebounding 7.0 percent in March.
The good news within the report was an upward revision to starts in March which were revised up to 0.585 million from the original estimate of 0.549 million.
Housing permits have been volatile in recent months but trending flat. Housing permits declined 4.0 percent in April, following a 7.5 percent surge the month before. Overall permits came in at an annualized rate of 0.551 million units and are down 12.8 percent on a year-ago basis.
The bottom line is that housing is flat and at anemic levels. Supply has edged down but remains high, ranging from seven to nine months in recent reports on home sales. With high foreclosure rates still threatening to lift existing home supply on the market, homebuilders simply cannot risk much speculative construction. This is keeping new activity new record lows. Certainly, we need to look to other sectors in the economy to keep the recovery moving forward. Recovery in housing appears to be some time off.
 The latest existing home sales report confirms that housing is still very anemic. The housing sector continues to stumble with April existing home sales coming in at a 5.05 million annual unit rate, down 0.8 percent in the month with the year-on-year rate moving into the negative double digits at 12.9 percent. Supply on the market ballooned to 9.2 months at the current sales rate compared to 8.3 months in March. The latest existing home sales report confirms that housing is still very anemic. The housing sector continues to stumble with April existing home sales coming in at a 5.05 million annual unit rate, down 0.8 percent in the month with the year-on-year rate moving into the negative double digits at 12.9 percent. Supply on the market ballooned to 9.2 months at the current sales rate compared to 8.3 months in March.
But price readings are positive with both the median and average moving higher, up 2.4 percent on the median to $163,700 with the average at $214,600 for a 3.5 percent gain. The price gain may have been due to a shift in composition of sales away from the low end to the high end. The price numbers are not based on repeat transaction. The ending of Fed purchases of mortgage-backed securities may be impacting mortgage rates which are now in the 4-3/4 percent vicinity, up from recent lows of a little over 4 percent. This is still low, indicating that it is tight credit conditions and high unemployment that are constraining sales instead of high finance costs.
 The economy appears to be hitting the pause button as the Conference Board's index of leading indicators dipped 0.3 percent in April following a 0.7 percent jump in March (originally up 0.4 percent.) The weakest factor is initial jobless claims which sliced off 0.33 percentage points from the index's growth. Vendor performance subtracted 0.21 percentage points. Also negative are building permits and the factory workweek (new orders for consumer goods and new orders for nondefense capital goods are also negative but these readings are imputed). Of these negatives, jobless claims are likely to turn positive based on improvement so far in May. The economy appears to be hitting the pause button as the Conference Board's index of leading indicators dipped 0.3 percent in April following a 0.7 percent jump in March (originally up 0.4 percent.) The weakest factor is initial jobless claims which sliced off 0.33 percentage points from the index's growth. Vendor performance subtracted 0.21 percentage points. Also negative are building permits and the factory workweek (new orders for consumer goods and new orders for nondefense capital goods are also negative but these readings are imputed). Of these negatives, jobless claims are likely to turn positive based on improvement so far in May.
Adding lift as always is the interest rate spread between the 10-year Treasury note and fed funds (adding 0.35 percentage points) with positive contributions also from stock prices, money supply, and consumer expectations. The coincident index edged up 0.1 percent in April versus a 0.2 percent rise the prior month.
One month is only one month and we may see improvement in May.
The Federal Reserve released the minutes of the FOMC’s meeting held on April 26 and April 27. The minutes gave a little more detail about the internal debate over when and how to begin unwinding its currently very accommodative policy. There was little dissention regarding the current status of policy although some indicated they saw little benefit from additional quantitative easing but so little reason to not finish QE2 since completion is close. Regarding inflation, most saw the recent effects of recent oil price hikes as transitory. Most within the FOMC see the fed funds rate as the preferred active tool for tightening, but for now most see an end to reinvestment of pay down on mortgage-backed securities and agency debt as the first step in tightening. For the long term, most are arguing for a "corridor" system of fed interest rates with interest on excess reserves at the bottom, the discount rate at the top and the fed funds rate in the middle. For the long term, the FOMC wants to return the balance sheet to Treasuries only.
The Fed initially will need to return to a neutral stance from the current accommodative stance. That means shrinking the balance sheet back to a level reflecting slow, long-term growth and using the fed funds rate as the primary policy tool. But along the way, the Fed has to choose whether to unwind initially more with rate increases or balance sheet shrinkage or a combination of both. The FOMC agreed on several principles to guide normalization of policy. First, the pace and sequencing of the policy steps would be driven by the Committee's monetary policy objectives for maximum employment and price stability. Second, in the intermediate term, the balance sheet would be reduced so that implementation of monetary policy would be through management of the fed funds rate rather than the size or composition of the balance sheet. Third, the balance sheet would return to Treasuries only. Last, asset sales would be communicated to the public in advance.
Basically, the Fed appears intent on keeping credit conditions loose for some time. Some unwinding of the Fed’s balance sheet or even slight increase in interest rates hardly means that monetary policy is tight but merely less accommodative. The consensus is that the fed funds rate will not be lifted until late this year at the earliest or even early 2012. But the Fed could choose to reinvest or not pay down on principle on mortgage-backed securities and/or agency debt at varying rates depending on the status of the economy, thereby affecting how fast quantitative easing unwinds.
The economy appears to have decelerated in April and somewhat in May but there is little sign of an outright decline. Outside of housing, demand is still doing well.
After an unexpected drop in existing home sales, Tuesday’s new home sales will garner extra attention. Similarly, markets will be hoping for a healthy durables orders report Wednesday --especially after last week's disappointing industrial production report. An update on first quarter GDP prints on Thursday. The latest reading on consumer sentiment is on tap Friday along with personal income and spending.
New home sales in March rebounded 11.1 percent, following a 13.5 percent plunge the month before. The March pace of 300,000 units annualized came off the record low of 270,000 in February—for a series that goes back to 1963. Likely, February was depressed by atypically severe winter weather and the March boost partly reflects a return to more seasonal weather. Supply did ease for the best reading since December with months’ supply posting at 7.3 months, down from 8.2 in February.
New home sales Consensus Forecast for April 11: 300 thousand-unit annual rate
Range: 285 thousand to 320 thousand-unit annual rate
Durable goods orders in March surged a revised 4.1 percent (benchmark revisions) after declining 1.1 percent the month before. Excluding transportation, new orders gained a revised 2.3 percent, following a 0.6 percent increase in February. The March advance was led by transportation (mainly motor vehicles) but gains were widespread elsewhere also. Early indications for April are mixed according to durables orders indexes in various manufacturing surveys. The ISM eased but remained at a strong level though the Empire State index softened more significantly and the orders index for Philly slowed sharply.
New orders for durable goods Consensus Forecast for April 11: -3.0 percent
Range: -5.7 percent to +0.5 percent
GDP growth slowed during the first quarter of 2011 according to the advance estimate. First quarter GDP growth eased to a 1.8 percent annualized pace, following a 3.1 percent boost in the fourth quarter. The softer growth in the first quarter was largely due to a sharp upturn in imports, a deceleration in personal consumption, a larger decrease in federal government spending, and decelerations in nonresidential fixed investment and in exports that were partly offset by a sharp upturn in private inventory investment. Nonetheless, relative strength was seen in personal spending, investment in equipment & software, and inventory investment. Exports also continued to rise although not as rapidly as earlier. Weakness included a drop in government purchases, nonresidential structures, and residential structures. A boost in imports also cut into overall growth. Economy-wide inflation picked up with the GDP price index jumping 1.9 percent from a modest 0.4 percent rise in the fourth quarter. Analysts had forecast 2.2 percent.
Real GDP Consensus Forecast for second estimate Q1 11: +2.1 percent annual rate
Range: +1.9 to +2.6 percent annual rate
GDP price index Consensus Forecast for second estimate Q1 11: +1.9 percent annual rate
Range: +1.9 to +2.0 percent annual rate
Initial jobless claims in the May 14 week fell 29,000 to 409,000, following the prior week's 40,000 decline. Auto and weather effects were no more than isolated in the week's data which saw the four-week average only very slightly higher at 439,000.
Jobless Claims Consensus Forecast for 5/21/11: 404,000
Range: 395,000 to 420,000
Personal income in March grew 0.5 percent, following a 0.4 percent gain in February. Wages & salaries rose a moderate 0.3 percent, softening a little from 0.4 percent in February. Consumer spending slowed somewhat, printing at a 0.6 percent rise in March after jumping 0.9 percent the prior month. On the inflation front, the PCE price index continued to be hot, jumping 0.4 percent and matching the February boost. However, the core rate decelerated a bit to a sluggish 0.1 percent rise in March, following a 0.2 percent gain in February. Looking ahead, the private wages & salaries component of personal income should be moderately strong as private aggregate earnings rose 0.4 percent for the month. Spending should post a reasonably healthy gain—at least in current dollars—as unit new motor vehicle sales improved 0.5 percent while retail sales excluding autos gained 0.6 percent. PCE inflation should remain relatively warm as the headline CPI jumped 0.4 percent while the core rose 0.2 percent in April.
Personal income Consensus Forecast for April 11: +0.4 percent
Range: +0.3 to +0.5 percent
Personal consumption expenditures Consensus Forecast for April 11: +0.4 percent
Range: +0.1 to +0.6 percent
Core PCE price index Consensus Forecast for April 11: +0.2 percent
Range: +0.1 to +0.4 percent
The Reuter's/University of Michigan's Consumer sentiment index for mid-May rose 2.6 points to 72.4 for its best reading in two months. However, improved optimism was about the future, not current conditions. The current conditions component dipped slightly, almost certainly due to higher gasoline and food costs. Meanwhile expectations about the economy in coming months improved. Inflation expectations were little changed for the near term as well as for the five year outlook.
Consumer sentiment Consensus Forecast for final May 11: 72.5
Range: 71.0 to 73.0
SIFMA Recommended Early Close 2:00 ET
R. Mark Rogers is the author of The Complete Idiot’s Guide to Economic Indicators, Penguin Books, 2009.
Econoday Senior Writer Mark Pender contributed to this article.
|
