|
Equities were little changed after a very volatile week. There was no dramatic economic news as indicators point to a continuation of the recovery. Traders, however, remained jittery over a variety of issues, including the direction of the recovery.
 Stocks were mixed for the week even though the first two days were positive. Blue chips were down slightly while techs and small caps posted small gains. Equities rose Monday on a jump in prices for oil and other commodities. Also, news from McDonald’s of better-than-expected sales lifted stocks. Stock advances on Tuesday were led by news that Microsoft is buying Skype, boosting optimism for more takeovers. Corporate earnings reports also were strong. Stocks were mixed for the week even though the first two days were positive. Blue chips were down slightly while techs and small caps posted small gains. Equities rose Monday on a jump in prices for oil and other commodities. Also, news from McDonald’s of better-than-expected sales lifted stocks. Stock advances on Tuesday were led by news that Microsoft is buying Skype, boosting optimism for more takeovers. Corporate earnings reports also were strong.
Equities fell sharply at mid-week on a rise in the dollar on worries over Europe’s sovereign debt problems. Concern over inflation in Europe and Asia came to fore due to reports from Germany and China and, in turn, raised expectations for rate increases. A drop in commodities prices also weighed on stocks. Oil fell over $5 per barrel, pulling down the energy patch.
On Thursday, equities headed back up on reports that the Obama Administration and Senate Republican leaders were closer to an agreement to raise the federal debt ceiling. Also helping lift stocks was a decline in initial jobless claims. Retail sales also gained and with sizeable upward revisions. However, on the last day of trading, stocks dropped as the dollar rose on concern that Europe’s sovereign debt crisis will worsen. In turn, economic growth would be softer.
Equities were mixed this past week. The Dow was down 0.3 percent; the S&P 500, down 0.2 percent; the Nasdaq, unchanged; and the Russell 2000, up 0.3 percent.
For the year-to-date, major indexes are up as follows: the Dow, up 8.8 percent; the S&P 500, up 6.4 percent; the Nasdaq, up 6.6 percent; and the Russell 2000, up 6.6 percent.
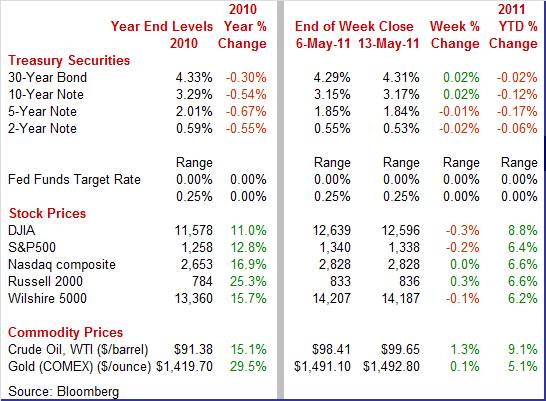
Weekly percent change column reflects percent changes for all components except interest rates. Interest rate changes are reflected in simple differences.
 This past week, Treasury yields swung back and forth but only moderately and ended the week little changed. After a flat opening day, rates rose moderately on Tuesday as worries about European sovereign debt problems eased. At mid-week, rates dipped as a drop in commodities prices eased concern that inflation is accelerating. In turn, demand was boosted for Treasuries. This past week, Treasury yields swung back and forth but only moderately and ended the week little changed. After a flat opening day, rates rose moderately on Tuesday as worries about European sovereign debt problems eased. At mid-week, rates dipped as a drop in commodities prices eased concern that inflation is accelerating. In turn, demand was boosted for Treasuries.
Treasury prices declined Thursday on a lackluster 30-year bond auction and on a flow of funds into equities as stocks were relatively positive. Despite a better-than-expected consumer sentiment number, yields slipped at close of the week as a drop in commodities prices helped to ease inflation concerns. The day’s report on consumer price inflation was hot at the headline level but met expectations. Also, traders are discounting strong energy components in the CPI based on the very recent decline in oil prices.
For this past week Treasury rates were mixed as follows: 3-month T-bill, up 1 basis point; the 2-year note, down 2 basis points; the 5-year note, down 1 basis point; the 7-year note, down 1 basis point; the 10-year note, up 2 basis points; and the 30-year bond, up 2 basis points.
 The spot price for crude saw two large swings for the week. Crude jumped over $4 per barrel on Monday on news that the global economy is still growing at a healthy pace. Specifically, German exports spiked to a record in March. Also supporting crude were concerns that the rising Mississippi River will flood Louisiana refineries. The spot price for crude saw two large swings for the week. Crude jumped over $4 per barrel on Monday on news that the global economy is still growing at a healthy pace. Specifically, German exports spiked to a record in March. Also supporting crude were concerns that the rising Mississippi River will flood Louisiana refineries.
Oil fell back below $100 per barrel on Wednesday after the Energy Department reported a jump in U.S. petroleum inventories and a decline in fuel demand. Spot crude fell about $5-1/2 bucks for the day.
Net for the week, spot prices for West Texas Intermediate firmed $1.24 per barrel to settle at $99.65. The week’s close was about $13 per barrel lower than the recent high seen in early May. Although still high, the recent direction has been down and has been encouraging for those (notably at the Fed) arguing that the recent jump in headline inflation is transitory.
The consumer sector—in terms of spending and sentiment—is still moving forward despite higher gasoline prices—at least for now. But inflation clearly is a concern as seen in this week’s CPI and PPI reports. The trade balance took a hit from higher oil prices but exports are expanding.
 Growth in consumer spending slowed in April. However, the easing is likely due to not just higher costs to fill the gas tank but also due to coming off rapid growth for several months. Essentially, spending was healthy overall in April but there are question marks as to how well it can hold up. The April report was much more complex than usual. Here’s the primer: 1) higher prices lifted some components, 2) upward revisions were significant, and 3) spending likely has been at an unsustainably strong pace in recent months. Growth in consumer spending slowed in April. However, the easing is likely due to not just higher costs to fill the gas tank but also due to coming off rapid growth for several months. Essentially, spending was healthy overall in April but there are question marks as to how well it can hold up. The April report was much more complex than usual. Here’s the primer: 1) higher prices lifted some components, 2) upward revisions were significant, and 3) spending likely has been at an unsustainably strong pace in recent months.
Overall retail sales in April gained 0.5 percent, following a revised 0.9 percent increase in March. However, March was revised upward significantly from the original 0.4 percent rise.
Excluding autos, sales grew 0.6 percent, following a 1.2 percent increase in March. The March number was notably higher than the first estimate of 0.8 percent. In the latest month, price hikes likely played a role in gasoline and grocery store sales which jumped 2.7 percent and 1.5 percent, respectively. Sales excluding autos and gasoline in April posted a modest 0.2 percent gain, following a 0.7 percent jump the prior month (originally 0.6 percent). Essentially, April was about as expected but March was a little stronger than previously believed.
For the current month, outside of autos and gasoline, components were mixed. Strength was led by food & beverage stores, nonstore retailers, and miscellaneous store retailers. Leading on the downside were electronics & appliance stores, sporting goods, hobby, book & music stores, and furniture & home furnishing.
Despite a soft number for ex-autos/ex-gasoline sales, the level of activity is still good taking into account upward revisions for March and three consecutive strong gains in each of the months in the first quarter. Looking at the core of the core, sales excluding autos and gasoline posted the following robust numbers this year: January, 0.5 percent; February, 0.9 percent; March, 0.7 percent; and April, 0.2 percent. The pace of the first four months of the year is not sustainable, so the April moderation is not so disconcerting. However, there likely was some slowing in sales from the impact of higher gasoline prices, but at this point, the effect appears to be modest.
 Maybe the recovery indeed is becoming more entrenched from the consumer perspective. Despite high gasoline prices and stubbornly slow downward movement in unemployment, consumers were not as pessimistic in early May. The Reuters/University of Michigan consumer sentiment index rose 2.6 points to 72.4 for its best reading in two months. Maybe the recovery indeed is becoming more entrenched from the consumer perspective. Despite high gasoline prices and stubbornly slow downward movement in unemployment, consumers were not as pessimistic in early May. The Reuters/University of Michigan consumer sentiment index rose 2.6 points to 72.4 for its best reading in two months.
 However, improved optimism was about the future, not current conditions. The current conditions component dipped slightly, almost certainly due to higher gasoline and food costs. Meanwhile expectations about the economy in coming months improved. Perhaps consumers have been listening to FedSpeak and hope or believe that currently high levels for gasoline prices are transitory and that more jobs are on the way. However, improved optimism was about the future, not current conditions. The current conditions component dipped slightly, almost certainly due to higher gasoline and food costs. Meanwhile expectations about the economy in coming months improved. Perhaps consumers have been listening to FedSpeak and hope or believe that currently high levels for gasoline prices are transitory and that more jobs are on the way.
Inflation expectations were little changed for the near term as well as for the five year outlook. This is good news for the Fed as various members of the FOMC have indicated that they are watching inflation expectations closely to see if they remain anchored.
 With the latest trade report, manufacturers are happy, consumers are not. The U.S. trade deficit worsened notably, largely on higher oil prices. But there are some positives in the report as well as negatives. The overall U.S. trade deficit in March expanded to $48.2 billion from a revised $45.4 billion gap in February. With the latest trade report, manufacturers are happy, consumers are not. The U.S. trade deficit worsened notably, largely on higher oil prices. But there are some positives in the report as well as negatives. The overall U.S. trade deficit in March expanded to $48.2 billion from a revised $45.4 billion gap in February.
The good news for manufacturers is that exports jumped 4.6 percent, following a 1.5 percent decline the previous month. Imports rebounded 4.9 percent after dropping 1.9 percent in February.
 The widening of the trade deficit was led by the petroleum gap which grew to $31.3 billion from $25.5 billion in February. The nonpetroleum goods shortfall shrank to $29.8 billion from $32.8 billion the prior month. The services surplus expanded somewhat to $13.9 billion from $13.7 billion in February. The widening of the trade deficit was led by the petroleum gap which grew to $31.3 billion from $25.5 billion in February. The nonpetroleum goods shortfall shrank to $29.8 billion from $32.8 billion the prior month. The services surplus expanded somewhat to $13.9 billion from $13.7 billion in February.
Looking at end use categories for goods, the increase in imports was led by a $7.7 billion jump in industrial supplies with $3.6 billion from oil imports. Auto imports rose $2.1 billion while capital goods ex autos gained $1.6 billion. Foods, feeds & beverages were essentially unchanged. However, consumer goods imports dipped $2.0 billion.
By end-use categories, the improvement in exports was led by a $2.5 billion jump in industrial supplies, followed by automotive exports, rising $1.6 billion. Also increasing were consumer goods, up $0.7 billion, and foods, feeds & beverages, up $0.6 billion.
The direction of the trade gap was not a surprise but the impact of higher oil prices was more than expected. However, the good news is that exports are back up and sharply. Export gains were broad based, likely benefiting from a soft dollar and moderately healthy economic growth overseas.
The import numbers suggest more than just the story that higher oil prices were the main cause of the wider deficit. Notably, the growing oil gap is a drain on U.S. consumers, businesses, and the economy. Consumers are not happy about the hit to their household budgets. Along this line of thought, the slippage in imports of consumer goods indicates that businesses may be notching down their forecasts for consumer spending overall. But there are two final and positive notes. The jump in auto imports indicates that consumers are still in the market to update an aged auto fleet. And the boost in capital goods imports suggests that businesses are now optimistic enough about the recovery to update or expand capacity.
 Business inventories jumped 1.0 percent in March, following a 0.7 percent increase the prior month. The latest gain was broad based with inventories for manufacturers up 1.1 percent, retailers up 0.9 percent, and wholesalers up 1.1 percent. The build in business inventories is lagging business sales which surged 2.2 percent in March, following a 0.5 percent rise in February. The stock-to-sales ratio fell another tenth to what is a new record low of 1.23. This reading indicates that inventories are too low. But rising sales point ahead to rising production, rising inventory build, and rising employment as well. Business inventories jumped 1.0 percent in March, following a 0.7 percent increase the prior month. The latest gain was broad based with inventories for manufacturers up 1.1 percent, retailers up 0.9 percent, and wholesalers up 1.1 percent. The build in business inventories is lagging business sales which surged 2.2 percent in March, following a 0.5 percent rise in February. The stock-to-sales ratio fell another tenth to what is a new record low of 1.23. This reading indicates that inventories are too low. But rising sales point ahead to rising production, rising inventory build, and rising employment as well.
 Inflation has become a growing threat to the recovery—emphasis on threat. The direction of underlying inflation is uncertain as consumer price inflation remains on two tracks with headline red hot and core more subdued. The consumer price index in April increased 0.4 percent, following a 0.5 percent hike in March. Excluding food and energy, the CPI gained 0.2 percent, up from a 0.1 percent rise in March. Inflation has become a growing threat to the recovery—emphasis on threat. The direction of underlying inflation is uncertain as consumer price inflation remains on two tracks with headline red hot and core more subdued. The consumer price index in April increased 0.4 percent, following a 0.5 percent hike in March. Excluding food and energy, the CPI gained 0.2 percent, up from a 0.1 percent rise in March.
 By major components, energy continued its upward surge, printing a 2.2 percent boost after jumping 3.5 percent in March. Gasoline jumped 3.3 percent, following a 5.6 percent surge in March. Food prices increased 0.4 percent in April, following a 0.8 percent gain the prior month. By major components, energy continued its upward surge, printing a 2.2 percent boost after jumping 3.5 percent in March. Gasoline jumped 3.3 percent, following a 5.6 percent surge in March. Food prices increased 0.4 percent in April, following a 0.8 percent gain the prior month.
Within the core, there was both upward pressure and softness. Upward pressure was led by a 0.8 percent increase in new & used vehicles and by a 0.4 percent bump up in medical care costs. On the soft side were a modest 0.1 percent rise in shelter costs, a flat number for recreation, education & communication up 0.1 percent, and “other” up 0.1 percent.
Year-on-year, overall CPI inflation accelerated to 3.1 (seasonally adjusted) from 2.7 percent in March. The core rate firmed to 1.3 percent in April from 1.2 percent in March on a year-ago basis. The headline year-ago number is at its strongest pace since 3.7 percent seen in October 2008.
Inflation’s threat to recovery likely comes from at least three angles. First, if energy costs do not come down, they could feed into larger cost increases for businesses, cutting into profits and leading to generalized price increases.
Next, such price increases could lead the Fed to tighten sooner than later. While the headline number has been above the Fed’s inflation target of about 1.7 to 2.0 percent (yearly) for some months, the core rate has been edging up toward the lower bound. Several Fed speakers have indicated that policy must tighten before core inflation exceeds the target band.
 Third, consumers are seeing erosion in spending power. A report released in tandem with the CPI is real earnings—and the news has not been good in recent months. Real hourly earnings are average hourly earnings deflated by the CPI. Real hourly earnings fell 0.3 percent in April, matching the decline the prior month. Third, consumers are seeing erosion in spending power. A report released in tandem with the CPI is real earnings—and the news has not been good in recent months. Real hourly earnings are average hourly earnings deflated by the CPI. Real hourly earnings fell 0.3 percent in April, matching the decline the prior month.
On a year-ago basis, real hourly earnings were down 1.2 percent, compared to down 0.7 percent in March. Indeed, real wages swing significantly as energy costs rise or fall sharply. We saw a large gain in real wages in 2008 on the plunge in oil prices but the reverse is currently true. In recent months, basically, consumer spending has been driven by pent up demand and job growth. Individual spending power has fallen on average but aggregate earnings are up on higher employment.
But modest relief may be coming as crude oil prices have retreated somewhat in recent days. Nonetheless, the consumer still is dealing with reduced real income and to maintain momentum the recovery will need to grow more jobs. A decline in oil prices would help, too.
Producer price inflation at the headline level continues to run hot while the core is more moderate. Nonetheless, the core has been a little warmer in recent months. And producer price inflation is quite hot “upstream” in the manufacturing process.
 Overall PPI finished goods inflation in April increased 0.8 percent, following a 0.7 percent jump in March. Energy increased 2.5 percent after a 2.6 percent advance in March. The main culprit was gasoline which rose 3.6 percent in April, following a 5.7 percent surge the month before. However, food also added to the latest PPI jump, rebounding 0.3 percent after a 0.2 percent dip in March. Overall PPI finished goods inflation in April increased 0.8 percent, following a 0.7 percent jump in March. Energy increased 2.5 percent after a 2.6 percent advance in March. The main culprit was gasoline which rose 3.6 percent in April, following a 5.7 percent surge the month before. However, food also added to the latest PPI jump, rebounding 0.3 percent after a 0.2 percent dip in March.
At the core level, PPI growth held steady at 0.3 percent. Upward pressure at the core was led by passenger cars and light trucks which gained 0.5 percent and 0.6 percent, respectively.
 For the overall PPI, the year-on-year rate in April came in at 6.6 percent, compared to 5.7 percent in March (seasonally adjusted). The core rate edged up to 2.1 percent from 2.0 percent the month before. For the overall PPI, the year-on-year rate in April came in at 6.6 percent, compared to 5.7 percent in March (seasonally adjusted). The core rate edged up to 2.1 percent from 2.0 percent the month before.
The year-ago numbers indicate that there may be some inflation pressure for goods that is building upstream for the consumer. Clearly, at the headline level higher energy and food costs have reached the consumer but hopefully there will be at least a partial reversal from recently lower oil prices.
Despite headwinds from higher prices, the consumer sector still has forward momentum. But that is at risk from less discretionary income due to the impact of higher gasoline and food prices on consumer budgets. A further easing in oil prices would certainly be favorable toward continued recovery.
Manufacturing and housing are this week's focus. Regional surveys including the Empire State (Monday) and the Philly Fed (Thursday) are on tap with industrial production scheduled for Tuesday. Housing starts are listed for Tuesday with key a reading on housing demand (existing home sales) scheduled for Thursday. Traders will be parsing the FOMC minutes at mid-week just in case something was omitted at Chairman Bernanke's post-meeting press conference.
The Empire State manufacturing index in April rose 4.2 points to 21.70 and well over the breakeven point of zero. Detail was robust as indexes for the number of employees, shipments, and new orders gained further in positive territory. A healthy reading for the headline index in May is likely as April’s new orders index was notably strong, rising 16.53 points on the month to 22.34, the highest reading since March 2010.
Empire State Manufacturing Survey Consensus Forecast for May11: 20.0
Range:15.0 to 22.5
Housing starts in March rebounded 7.2 percent, following a monthly 18.5 percent drop in February. The March annualized pace of 0.549 million was down 13.4 percent on a year-ago basis. The improvement in March was led by a monthly 7.7 percent boost in single-family starts, following an 8.8 percent decrease in February. There may be modest improvement ahead for housing starts. Housing permits gained 11.2 percent in March after decreasing 5.2 percent the prior month. Overall permits came in at an annualized rate of 0.534 million units.
Housing starts Consensus Forecast for April11: 0.570 million-unit rate
Range:0.549 million to 0.583 million-unit rate
Industrial production in March jumped 0.8 percent, following a 0.1 percent uptick the month before. Importantly, manufacturing continued a string of healthy gains, advancing 0.7 percent, following a 0.6 percent boost in February. Manufacturing output has risen nine consecutive months. Overall capacity utilization in March expanded to 77.4 percent from 76.9 percent in February. The March rate came in higher than the market forecast for 77.3 percent. Looking ahead, data are mixed. National and regional manufacturing surveys for April range from moderately strong to robust. However, the manufacturing production worker hours index in the employment situation was unchanged for the month.
Industrial production Consensus Forecast for April11: +0.4 percent
Range: -0.4 to +0.8 percent
Capacity utilization Consensus Forecast for April11: 77.6 percent
Range:77.0 to 77.9 percent
The Minutes of the April 26-27 FOMC meeting are scheduled for release at 2:00 p.m. ET. Traders will be parsing the release for indications of how and when the Fed might start unwinding its expanded balance sheet.
Initial jobless claims for the May 7 week fell 44,000 in the May 7 week to 434,000. Despite the decline, the four-week average continues to rise, up 4,000 to 436,750 for a very significant 40,000 increase from the month-ago comparison.
Jobless Claims Consensus Forecast for 5/14/11: 425,000
Range:410,000 to 440,000
Existing home sales rebounded 3.7 percent in March to an annual rate of 5.1 million. Sales had dropped a monthly 8.9 percent the prior month due to winter storms—especially in the South which makes up the bulk of home sales. Prices firmed slightly, up 2.2 percent for the median reading to $159,600. This follows a drop of 1.1 percent in February. The latest improvement is likely a seasonal effect (prices are not seasonally adjusted). Slightly more homes were on the market, 3.549 million, but the solid rise in sales brought down the supply reading slightly to a still very heavy 8.4 months.
Existing home sales Consensus Forecast for April11: 5.2 million-unit rate
Range:5.1 to 5.4 million-unit rate
The general business conditions index of the Philadelphia Fed's Business Outlook Survey eased in April to 18.5 from 43.4 in March. The latest number is still above breakeven of zero but reflects a slower growth rate. The details were still positive but disappointing for the most part, softening from strong numbers in March. The new orders index declined to 18.8 from 40.3 while shipments eased much less to 29.1 from 34.9 in March.
Philadelphia Fed survey Consensus Forecast for May11: 23.0
Range:15.0 to 28.0
The Conference Board's index of leading indicators in March rose 0.4 percent, slowing from February's rate of 1.0 percent. The strongest component was the spread between the 10-year T-note and fed funds rate which added 0.34 percentage points. The Fed is still providing plenty of liquidity in financial markets. The second strongest component was building permits which added 0.28 percentage points. The biggest negative was consumer expectations, subtracting 0.41 percentage points, and likely reflecting higher gasoline prices, still high unemployment, and geopolitical concerns. The coincident index advanced 0.2 percent in March, following an incremental gain of 0.1 percent in February.
Leading indicators Consensus Forecast for April11: 0.0 percent
Range: -0.1 to +0.4 percent
R. Mark Rogers is the author of The Complete Idiot’s Guide to Economic Indicators, Penguin Books, 2009.
Econoday Senior Writer Mark Pender contributed to this article.
|
