|
First quarter GDP disappointed, coming in notably lower than the prior quarter. In turn, quite a few pundits suggested that the recovery is at risk—especially with high gasoline prices eating into consumers’ discretionary income. But the latest economic indicators suggest that momentum is returning—albeit moderately.
 Although healthy gains were netted for the week, traders started cautiously on Monday ahead of the mid-week FOMC policy statement and first-ever post-FOMC press conference by Fed Chairman Bernanke. A dearth of earnings news helped stocks dip slightly on Monday despite a higher-than-expected rebound in new home sales. Although healthy gains were netted for the week, traders started cautiously on Monday ahead of the mid-week FOMC policy statement and first-ever post-FOMC press conference by Fed Chairman Bernanke. A dearth of earnings news helped stocks dip slightly on Monday despite a higher-than-expected rebound in new home sales.
However, the biggest daily gain for the week was Tuesday as earnings were positive for a number of companies, including Ford and 3M. Also adding to upward momentum was a better-than-expected reading on consumer confidence.
Wednesday was to be the big day with Bernanke’s post-FOMC press conference early in the afternoon. But first, a boost in durables orders sent stocks up with favorable earnings also lifting stocks. The FOMC statement was essentially as expected with no change in policy and a modest downgrade to the near-term economic forecast. But after Bernanke’s press conference, markets eventually decided that the chairman’s comments indicated that policy will remain loose for some time was a positive. Initially, markets had little reaction to the press conference as comments were noncontroversial. The Fed chairman stated that there would be no additional expansion of the Fed’s balance sheet after QE2 ends in June but did indicate the option remains undecided on whether to continue to reinvest pay down on mortgage-backed securities and federal agency securities.
Stocks rose Thursday despite a jump in initial jobless claims and slower-than-expected GDP growth. The reason was that traders remained in a positive mood after the FOMC statement and press conference. Other positives included a notable gain in pending home sales and mostly favorable earnings. The week closed with a healthy personal income report and better-than-expected consumer sentiment reading. Earnings also helped most indexes end the week on a positive note.
Throughout the week, a declining dollar also provided support for equities with energy, commodities, and export-oriented sectors being key beneficiaries. For the week, the dollar Index fell a little over 1-1/2 percent.
Indexes generally ended April at three-year highs.

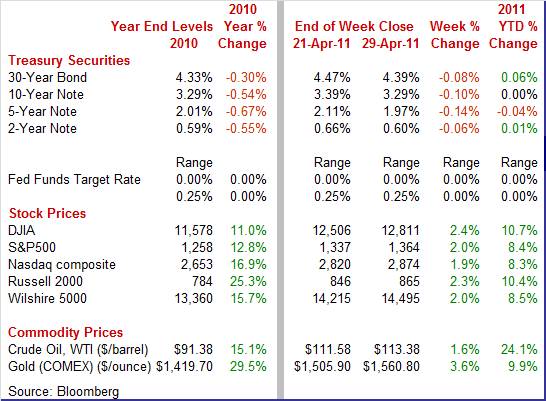
Equities were up this past week. The Dow was up 2.4 percent; the S&P 500, up 2.0 percent; the Nasdaq, up 1.9 percent; and the Russell 2000, up 2.3 percent.
Equities were up in April. The Dow was up 4.0 percent; the S&P 500, up 2.8 percent; the Nasdaq, up 3.3 percent; and the Russell 2000, up 2.6 percent.
For the year-to-date, major indexes are up as follows: the Dow, up 10.7 percent; the S&P 500, up 8.4 percent; the Nasdaq, up 8.3 percent; and the Russell 2000, up 10.4 percent.
Weekly percent change column reflects percent changes for all components except interest rates. Interest rate changes are reflected in simple differences.
 Bond traders clearly took the view that the economy is a little softer than earlier believed and expect monetary policy to remain easy for some time as rates declined notably despite continued increases in oil prices. Although bond traders were cautious ahead of the Wednesday FOMC announcement and press conference, Treasury yields eased as Treasuries were seen as overbought ahead of the long Easter weekend. But traders began to bet that the Fed would take a dovish stance and keep policy easy, leading to another dip in rates on Tuesday. Bond traders clearly took the view that the economy is a little softer than earlier believed and expect monetary policy to remain easy for some time as rates declined notably despite continued increases in oil prices. Although bond traders were cautious ahead of the Wednesday FOMC announcement and press conference, Treasury yields eased as Treasuries were seen as overbought ahead of the long Easter weekend. But traders began to bet that the Fed would take a dovish stance and keep policy easy, leading to another dip in rates on Tuesday.
 At mid-week and after the Fed’s announcement, Treasury rates firmed, largely on the Fed’s boost in its inflation forecast. But yields dipped again on Thursday on a disappointing GDP report and on an unexpected jump in initial jobless claims. At mid-week and after the Fed’s announcement, Treasury rates firmed, largely on the Fed’s boost in its inflation forecast. But yields dipped again on Thursday on a disappointing GDP report and on an unexpected jump in initial jobless claims.
On the last day of the week, economic news was mostly on the upside (personal income and sentiment) although the Chicago PMI was less positive. Nonetheless, rates edged down as some investors took end of month measures to purchase longer-term Treasuries to help their portfolios more closely match the duration of specific indexes based on Treasuries.
For this past week Treasury rates were down as follows: 3-month T-bill, down 1 basis point; the 2-year note, down 6 basis points; the 5-year note, down 14 basis points; the 7-year note, down 11 basis points; the 10-year note, down 10 basis points; and the 30-year bond, down 8 basis points.
The spot price of crude rose steadily this past week with Thursday being a minor exception. Prices were little changed the first two days of trading.  West Texas Intermediate rose about a buck a barrel on Wednesday after the Energy Department reported that gasoline stockpiles had dropped to the lowest level since August 2009. Crude edged down half a dollar on Thursday on weak GDP growth and the rise in jobless claims. But WTI ended the week with a dollar boost on better-than-expected consumer spending. West Texas Intermediate rose about a buck a barrel on Wednesday after the Energy Department reported that gasoline stockpiles had dropped to the lowest level since August 2009. Crude edged down half a dollar on Thursday on weak GDP growth and the rise in jobless claims. But WTI ended the week with a dollar boost on better-than-expected consumer spending.
Net for the week, spot prices for West Texas Intermediate advanced $1.80 per barrel to settle at $113.38. Crude is at its highest since late August 2008.
While the overall economic growth slowed for the first quarter on average, more recent numbers indicate that the consumer sector is holding up well and even housing is showing modest signs of improvement.
 The economy slowed during the first quarter of 2011. However, the detail shows moderate forward momentum. First quarter GDP growth eased to a 1.8 percent annualized pace, following a 3.1 percent boost in the fourth quarter. The economy slowed during the first quarter of 2011. However, the detail shows moderate forward momentum. First quarter GDP growth eased to a 1.8 percent annualized pace, following a 3.1 percent boost in the fourth quarter.
The softer growth in the first quarter was largely due to a sharp upturn in imports, a deceleration in personal consumption, a larger decrease in federal government spending, and decelerations in nonresidential fixed investment and in exports that were partly offset by a sharp upturn in private inventory investment.
Nonetheless, relative strength was seen in personal spending, investment in equipment & software, and inventory investment. Exports also continued to rise although not as rapidly as earlier. Weakness included a drop in government purchases, nonresidential structures, and residential structures. A boost in imports also cut into overall growth.
Final sales of domestic product posted at a sluggish 0.8 percent in the first quarter, compared to 6.7 percent the prior quarter. Final sales to domestic purchasers (takes out net exports) slowed to a 0.9 percent increase from a 3.2 percent rise in the fourth quarter. Deceleration in both was primarily due to a sharper drop in government purchases and a fall in structures investment—especially nonresidential but also residential.
Economy-wide inflation picked up with the GDP price index jumping 1.9 percent from a modest 0.4 percent rise in the fourth quarter. Analysts had forecast 2.2 percent.
While the first quarter growth rate was a setback, there are reasons to expect improvement ahead. First quarter weakness likely was due in part to severe winter weather and a late Easter (pushing some activity into the second quarter from the first). Notably, the important consumer and equipment sectors are showing signs of health—especially in more recent personal income and durables orders reports. Also, inventory investment has been relatively subdued and there is still room for inventory rebuilding to add to economic growth. Overall, the focus should be on likely forward (though moderate) momentum rather than on relatively old data from the first quarter.
 The consumer sector got some lift from income growth in March. Personal income grew 0.5 percent, following a 0.4 percent gain in February. Wages & salaries rose a moderate 0.3 percent, softening a little from 0.4 percent in February. The consumer sector got some lift from income growth in March. Personal income grew 0.5 percent, following a 0.4 percent gain in February. Wages & salaries rose a moderate 0.3 percent, softening a little from 0.4 percent in February.
 Consumer spending slowed somewhat in the latest month but was coming off a robust February. Personal consumption expenditures printed at a 0.6 percent rise in March after jumping 0.9 percent the prior month. Consumer spending slowed somewhat in the latest month but was coming off a robust February. Personal consumption expenditures printed at a 0.6 percent rise in March after jumping 0.9 percent the prior month.
Strength in spending was led by nondurables, up 0.9 percent, after a 1.7 percent surge in February. Both periods were boosted by increases in gasoline prices. Durables eased to up 0.1 percent, following a 2.1 percent jump the prior month. This largely reflected a softening in motor vehicle sales after a surge in February. Services spending advanced 0.5 percent after a 0.4 percent rise the month before.
Despite concerns about gasoline prices cutting into real spending, real PCEs managed to gain 0.2 percent, following a 0.5 percent surge in February.
 On the inflation front, the PCE price index continued to be hot, jumping 0.4 percent and matching the February boost. However, the core rate decelerated a bit to a sluggish 0.1 percent rise in March, following a 0.2 percent gain in February. On a year-ago basis, headline PCE inflation worsened to 1.8 percent from 1.6 percent in February. Core PCE price inflation was steady at 0.9 percent on a year-ago basis. The latest core numbers will let the Fed keep arguing that underlying inflation is still soft. On the inflation front, the PCE price index continued to be hot, jumping 0.4 percent and matching the February boost. However, the core rate decelerated a bit to a sluggish 0.1 percent rise in March, following a 0.2 percent gain in February. On a year-ago basis, headline PCE inflation worsened to 1.8 percent from 1.6 percent in February. Core PCE price inflation was steady at 0.9 percent on a year-ago basis. The latest core numbers will let the Fed keep arguing that underlying inflation is still soft.
The consumer sector is holding up a little better than expected despite high gasoline prices. The question is whether the price effects are “transitory” as hoped by the Fed. The income gains are at least helping to offset the impact of higher gasoline prices on consumers’ budgets. However, continued increases in gasoline prices will put not just the consumer sector at risk but overall economic growth.
 Even with still elevated unemployment and high gasoline prices, consumers were not as pessimistic in April as in March. But the consumer mood has not returned to the recovery high point in February. Even with still elevated unemployment and high gasoline prices, consumers were not as pessimistic in April as in March. But the consumer mood has not returned to the recovery high point in February.
The Conference Board’s consumer confidence index rose 1.6 points in April to 65.4. Outside of February's 72.0, April is the best reading of the recovery. Improved optimism of the jobs market is the reason for the gain. A big headline is a 2.6 percentage point drop in those saying jobs are currently hard to get to 41.8 percent. This is the lowest reading in more than two years. In an offset, though, fewer see more jobs six months from now, at 17.5 percent, compared to March's 19.6 percent and February's 21.2 percent. Apparently, consumers are seeing improvement in the economy as more anticipate their income increasing six months out, 16.7 percent versus 15.2 in March. Expectations of income gains should help to loosen up consumer wallets.
Improvement was also seen in the Reuter’s/University of Michigan index of consumer sentiment which rose to 69.8 for a final April reading versus 69.6 at mid-month and 67.5 in March. Back in February, before the Libyan civil war and the Japanese earthquake, consumer sentiment was at a recovery high of 77.5. Components of the composite index were mixed as expectations gained 0.4 point from mid-month to 61.6 and current conditions dipped 0.2 point to 82.5.
For now, income gains and the perception of an improved jobs market have improved consumer spirits a bit but continued hikes in gasoline prices would likely cause the reverse.
 Another sign of the first quarter ending on a positive note, manufacturing regained some of its luster with the March durables report, with new orders surging 2.5 percent after rising a revised 0.7 percent the month before (previously estimated at down 0.6 percent). Excluding transportation, new orders gained 1.3 percent, following a 0.6 percent increase in February. The March advance was led by transportation (mainly motor vehicles) but gains were widespread elsewhere also. Another sign of the first quarter ending on a positive note, manufacturing regained some of its luster with the March durables report, with new orders surging 2.5 percent after rising a revised 0.7 percent the month before (previously estimated at down 0.6 percent). Excluding transportation, new orders gained 1.3 percent, following a 0.6 percent increase in February. The March advance was led by transportation (mainly motor vehicles) but gains were widespread elsewhere also.
Transportation equipment jumped 5.9 percent, following a 0.9 percent increase in February. By subcomponents, sizeable gains were seen in motor vehicles and defense aircraft & parts with nondefense aircraft also rising. Outside of transportation, gains were widespread.
Businesses are bumping up purchases of equipment. Nondefense capital goods orders excluding aircraft in March increased 3.7 percent, following a 0.5 percent rise the prior month.
Overall, the durables report is encouraging and suggests that the first quarter ended with some return in strength.
 New home sales are showing some life but they still are at anemic levels. Sales in March rebounded 11.1 percent, following a 13.5 percent plunge the month before. The March pace of 300,000 units annualized comes off the record low of 270,000 in February—for a series that goes back to 1963. Likely, February was depressed by atypically severe winter weather and the March boost partly reflects a return to more seasonal weather. New home sales are showing some life but they still are at anemic levels. Sales in March rebounded 11.1 percent, following a 13.5 percent plunge the month before. The March pace of 300,000 units annualized comes off the record low of 270,000 in February—for a series that goes back to 1963. Likely, February was depressed by atypically severe winter weather and the March boost partly reflects a return to more seasonal weather.
Supply did ease for the best reading since December with months’ supply posting at 7.3 months, down from 8.2 in February.
The median price rose 2.9 percent to $213,800 for year-on-year contraction of 4.9 percent, less deep than February's contraction of 6.4 percent. Given other negative news on home prices, the rise in the median price for new home likely is attributable to a shift in composition of sales toward higher prices homes.
The bottom line is that housing ended the quarter a little better than at the start. But there is no reason to expect anything more than very incremental gains in coming months. And pending home sales supports the view that there may be modest improvement ahead.
 An additional sign of more momentum at the end of the first quarter than at the start is pending home sales. Pending home sales jumped 5.1 percent in March due, according to the National Association of Realtors, to better affordability, rising rents and job creation. March's gain was strongly centered in the largest region which is the South where contracts jumped 10.3 percent. Notably, the South had been hard hit by adverse winter weather in February. The latest report raises the possibility that modest momentum may once again be building for the existing home market. Pending home sales are based on contract signings for existing home sales instead of actual closings which show up in existing home sales data. Pending sales tend to lead existing sales by one to two months. An additional sign of more momentum at the end of the first quarter than at the start is pending home sales. Pending home sales jumped 5.1 percent in March due, according to the National Association of Realtors, to better affordability, rising rents and job creation. March's gain was strongly centered in the largest region which is the South where contracts jumped 10.3 percent. Notably, the South had been hard hit by adverse winter weather in February. The latest report raises the possibility that modest momentum may once again be building for the existing home market. Pending home sales are based on contract signings for existing home sales instead of actual closings which show up in existing home sales data. Pending sales tend to lead existing sales by one to two months.
 Home prices are still under pressure. Market forces of supply and demand continue to be in play as heavy supply weighs on prices while demand is still soft. One of the more reliable home price indexes, the S&P Case Shiller composite 10-city index (seasonally adjusted) showed a 0.2 percent decline for February, less steep than the 0.3 percent decrease in January and 0.4 percent decline in December. However, Case-Shiller published numbers are three-month moving averages of underlying data which indicates that underlying February prices showed little change for the month. Year-on-year contraction, however, is deepening, to minus 2.6 percent from minus 2.2 percent in January and minus 1.4 percent in December. Unadjusted data, which is widely looked at in this report, show a 1.1 percent monthly slide in February that reflected seasonal and atypical weather issues. The Case-Shiller series is a repeat transaction measure while prices in the new home sales (and existing) are not. Home prices are still under pressure. Market forces of supply and demand continue to be in play as heavy supply weighs on prices while demand is still soft. One of the more reliable home price indexes, the S&P Case Shiller composite 10-city index (seasonally adjusted) showed a 0.2 percent decline for February, less steep than the 0.3 percent decrease in January and 0.4 percent decline in December. However, Case-Shiller published numbers are three-month moving averages of underlying data which indicates that underlying February prices showed little change for the month. Year-on-year contraction, however, is deepening, to minus 2.6 percent from minus 2.2 percent in January and minus 1.4 percent in December. Unadjusted data, which is widely looked at in this report, show a 1.1 percent monthly slide in February that reflected seasonal and atypical weather issues. The Case-Shiller series is a repeat transaction measure while prices in the new home sales (and existing) are not.
At the April 26-27 FOMC meeting, the Fed retained its "extended period" language for keeping the target rate extremely low. The Fed also decided to finish QE2 as earlier planned and announced. Regarding the economy, the statement said that “the economic recovery is proceeding at a moderate pace and overall conditions in the labor market are improving gradually.”
While noting that some prices have risen significantly, the FOMC participants overall see inflation expectations as stable and underlying inflation as subdued.
“Commodity prices have risen significantly since last summer, and concerns about global supplies of crude oil have contributed to a further increase in oil prices since the Committee met in March. Inflation has picked up in recent months, but longer-term inflation expectations have remained stable and measures of underlying inflation are still subdued.”
Despite some District bank presidents questioning in earlier speeches the need for the second round of quantitative easing, the FOMC voted to complete the $600 billion in expansion of the Fed’s balance sheet in QE2.
There was no discussion of what should happen with the balance sheet level after June. That is, we do not know if the Fed will let the balance sheet unwind with pay down on mortgage-backed securities and agency debt and maturation of Treasuries. Or the Fed could continue to reinvest pay down. This decision will need to be made at the next FOMC meeting.
The latest FOMC meeting added a new facet to the FOMC cycle of events—the chairman’s press conference. Following each FOMC meeting in which participant’s update the Fed’s economic forecast, the chairman holds a press conference after the announcement to explain the forecast and to take Q&A in general.
With the latest forecast, the Fed raised the inflation outlook while lowering GDP numbers. The forecast for unemployment was bumped down. The central tendency forecast table is below.
During Q&A, Bernanke said he and the FOMC agreed with most private forecasters that Q1 will be soft but the sluggishness is expected to be “transitory.”
On the issue of how long the fed funds rate remains low for an “extended period,” Bernanke said it is conditioned on how stable inflation expectations remain and on progress on bringing unemployment down. He admitted that there is uncertainty and it will depend on how the economy evolves.
Regarding the end of QE2, Bernanke indicated that it is unlikely to have significant effects. He said an early step in unwinding would be to stop re-investing pay down on securities. Bernanke said that decision will be based on the evolving outlook and that the FOMC will have to make a judgment on that issue.
Despite the deceleration in GDP growth for the first quarter, there are numerous signs that the slowdown is temporary. Severe winter weather likely damped some activity early in the quarter. Also, a very late Easter may have moved some first quarter activity into the second quarter. Importantly, March indicators mostly are healthier than earlier in the first quarter—meaning that some momentum is returning.
May kicks off with the ISM manufacturing report which could confirm manufacturing's strength that was seen in durables orders. Tuesday, auto manufacturers will post April sales numbers. The week reaches a crescendo with Friday’s jobs report which will spotlight whether momentum is being regained after a sluggish first quarter.
The composite index from the ISM manufacturing survey eased in March, edging down 0.2 points, but still came in at a strong reading of 61.2. Strength was in a slowing in supplier deliveries and continued healthy production and employment. Looking ahead, the new orders index showed deceleration to 63.3 in March from 68.0 the prior month.
ISM manufacturing composite index Consensus Forecast for April 11: 59.5
Range: 58.0 to 60.5
Construction spending in February declined 1.4 percent after falling 1.8 percent in January.
The February drop was led by a 3.7 percent decline in private residential outlays, following a 3.6 percent rise the prior month. Private nonresidential construction spending edged up 0.9 percent, following an 8.0 percent drop in January. Public outlays declined 1.3 percent after a 0.5 percent dip the previous month. Atypically severe winter weather likely weighed on construction activity.
Construction spending Consensus Forecast for March 11: +0.5 percent
Range: -0.5 to +1.0 percent
Sales of domestic light motor vehicles in March slipped 3.3 percent to 9.9 million units while imports edged up 0.4 percent to 3.2 million units. Combined domestic and import light vehicle sales posted at 13.1 million units annualized—down 2.4 percent from 13.4 million units the prior month. The dip was attributed to simply coming off a strong pace and due to an easing in manufacturer incentives during March.
Motor vehicle domestic sales Consensus Forecast for April 11: 9.9 million-unit rate
Range: 9.8 to 10.2 million-unit rate
Factory orders in February slipped 0.1 while shipments decelerated to a rise of 0.3 percent. Meanwhile, inventories continued to build, up 0.8 percent for the month. More recently, new factory orders for durables surged 2.5 percent in March after rising a revised 0.7 percent the month before (previously estimated at down 0.6 percent).
Factory orders Consensus Forecast for March 11: +2.0 percent
Range: +1.7 to +2.8 percent
The composite index from the ISM non-manufacturing survey in March eased 2.4 points to 57.3, which is still well above 50 to indicate month-to-month growth. But it is down from February’s 59.7 which is the recovery’s high. Slowing was especially pronounced in output as indicated by the business activity index which declined 7.2 points to 59.7, again above 50 to indicate growth but below February's rate of growth. The new orders index also moderated yet very slightly, down three tenths to 64.1. But this pace is still somewhat high, indicating a healthy rate of growth for orders.
ISM non-manufacturing composite index Consensus Forecast for April 11: 57.0
Range: 54.5 to 60.0
Initial jobless claims for the April 23 week unexpectedly jumped 25,000 to 429,000—nearly 40,000 above expectations. The four-week average rose a steep 9,250 to 408,500 and was nearly 15,000 above the month-ago level.
Jobless Claims Consensus Forecast for 4/30/11: 410,000
Range: 400,000 to 450,000
Nonfarm business productivity for the fourth quarter rose an annualized 2.6 percent with unit labor costs posting at an annualized 0.6 percent dip. Overall, the productivity and cost numbers have been favorable toward corporate profits as companies have squeezed more out of workers not laid off during the recent downturn. However, first quarter numbers are not likely to look good as first quarter GDP was a disappointing 1.8 percent annualized increase. The productivity number uses many of the same source data for its output component as in GDP.
Nonfarm Business Productivity Consensus Forecast for initial Q1 11: +1.3 percent annual rate
Range: +0.5 to +3.1 percent annual rate
Unit Labor Costs Consensus Forecast for initial Q1 11: +0.8 percent annual rate
Range: -0.4 to +1.2 percent annual rate
Nonfarm payroll employment in March gained 216,000, following a revised 194,000 increase in February and a 68,000 rise in January. Job gains were seen in both goods-producing and service-providing sectors. Private service-providing jobs increased 199,000 after a 167,000 rise in February. The biggest negative in the employment report was for wages as average hourly earnings for all workers were flat, matching February. Another disappointment was the average workweek for all workers which posted at 34.3 hours and showing no improvement from February. From the household survey, the unemployment rate edged down to 8.8 percent in March from 8.9 percent the month before.
Nonfarm payrolls Consensus Forecast for April 11: +185,000
Range: +140,000 to +325,000
Private payrolls Consensus Forecast for April 11: +200,000
Range: +165,000 to +350,000
Unemployment rate Consensus Forecast for April 11: 8.8 percent
Range: 8.6 to 8.9 percent
Average workweek Consensus Forecast for April 11: 34.3 hours
Range: 34.3 to 34.3 hours
Average hourly earnings Consensus Forecast for April 11: +0.2 percent
Range: +0.1 to +0.2 percent
Consumer credit outstanding $7.6 billion in February, following a $4.4 billion gain the month before. This measure of short-term debt, however, was boosted entirely by a surge in non-revolving credit which jumped $10.3 billion, reflecting a jump in motor vehicle purchases. Partially offsetting was a $2.7 billion decline in revolving debt, following a $3.9 billion drop in January. Given that unit new motor vehicle sales dipped in March, we are likely to see weakness in consumer credit for the same month.
Consumer credit Consensus Forecast for March 11: +$5.0 billion
Range: +$2.0 billion to +$7.0 billion
R. Mark Rogers is the author of The Complete Idiot’s Guide to Economic Indicators, Penguin Books, 2009.
Econoday Senior Writer Mark Pender contributed to this article.
|
