|
This past week, equities took a dive early in the week on a downgrade to the long-term credit rating of the U.S. government. But traders quickly forgot the rating news and focused on mostly favorable earnings reports. Economic news was mixed but mostly positive.
 It's not news but traders can have a short memory and this past week was a prime example. Equities fell generally more than 1 percent on Monday on a variety of factors. First, China on Sunday announced another rate increase to slow domestic inflation. Then concern grew that Greece would not be able to avoid default and was seeking a restructuring of debt. But the biggest news was Standard & Poor's downgrade of the U.S. credit outlook. For the near term, the government's AAA rating was left untouched but the outlook was downgraded to “negative” from “stable.” By close Monday, prospects for equities looked notably dimmer. It's not news but traders can have a short memory and this past week was a prime example. Equities fell generally more than 1 percent on Monday on a variety of factors. First, China on Sunday announced another rate increase to slow domestic inflation. Then concern grew that Greece would not be able to avoid default and was seeking a restructuring of debt. But the biggest news was Standard & Poor's downgrade of the U.S. credit outlook. For the near term, the government's AAA rating was left untouched but the outlook was downgraded to “negative” from “stable.” By close Monday, prospects for equities looked notably dimmer.
But stocks got some modest lift on Tuesday on a boost in housing starts and on strong earnings from key companies including Johnson & Johnson which was one of the standouts. After close, earnings news prepped Wednesday for a sharp gain as a number of techs, led by Intel, topped expectations. And indeed, equities rose sharply Wednesday with techs leading the way. Adding to upward momentum was an expectedly strong gain in existing home sales, boosting homebuilders. The consumer sector gained on cosmetics maker L'Oreal reporting a surge in sales. By close Wednesday, Monday's worries over the U.S. credit rating and selloff were a distant memory.
Equities rose modestly on Thursday, the last day of trading with markets closed in observance of Good Friday. Again, techs were a big part of the story as Apple's release of its quarterly profits after close Wednesday beat expectations. Qualcomm also topped analysts' forecast. But stock gains might have been higher had the Philly Fed manufacturing report not disappointed. Also, initial jobless claims fell less than expected.
Equities were up this past week. The Dow was up 1.3 percent; the S&P 500, up 1.3 percent; the Nasdaq, up 2.0 percent; and the Russell 2000, up 1.3 percent.
For the year-to-date, major indexes are up as follows: the Dow, up 8.0 percent; the S&P 500, up 6.3 percent; the Nasdaq, up 6.3 percent; and the Russell 2000, up 7.9 percent.
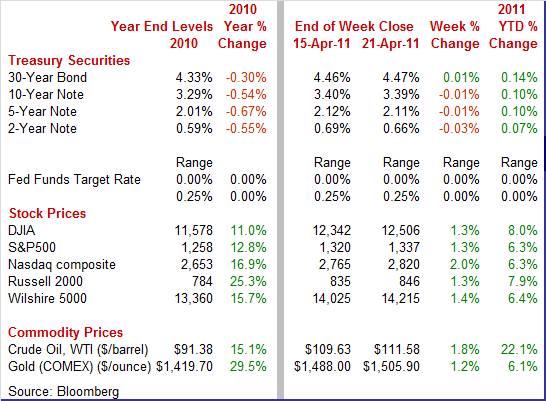
Weekly percent change column reflects percent changes for all components except interest rates. Interest rate changes are reflected in simple differences.
 Despite moderate volatility a couple days this past week and scares from more than one source, Treasury yields ended the week little changed. Traders were looking over both shoulders at the start of the week. Standard & Poor's downgraded its long-term outlook for the U.S. credit rating based on lack of progress in the federal government enacting a plan to reduce the federal deficit. However, offsetting this shock was speculation that Greece will not be able to avoid default. In turn, stocks fell sharply and funds moved to the safety of Treasuries. Despite moderate volatility a couple days this past week and scares from more than one source, Treasury yields ended the week little changed. Traders were looking over both shoulders at the start of the week. Standard & Poor's downgraded its long-term outlook for the U.S. credit rating based on lack of progress in the federal government enacting a plan to reduce the federal deficit. However, offsetting this shock was speculation that Greece will not be able to avoid default. In turn, stocks fell sharply and funds moved to the safety of Treasuries.
Rates bumped up on Wednesday on better-than-expected existing home sales and on modest reversal of flight to safety on favorable earnings reports making equities more attractive.
 By the last day of trading on Thursday, most were sitting tight ahead of the three-day Easter weekend and ahead of this coming week's FOMC meeting. By the last day of trading on Thursday, most were sitting tight ahead of the three-day Easter weekend and ahead of this coming week's FOMC meeting.
For this past week Treasury rates were little changed but mostly on the downside: 3-month T-bill, down 1 basis point; the 2-year note, down 3 basis points; the 5-year note, down 1 basis point; the 7-year note, down 2 basis points; and the 10-year note, down 1 basis point. The 30-year bond edged up 1 basis point.
 The spot price of crude rebounded from a dip the prior week. But prices initially headed downward with a $2.51 per barrel drop on Monday after Saudi Arabian Oil Minister described global markets as “oversupplied.” The drop in equities also led some traders to believe that weakness would transfer to economic growth, tugging on oil demand. The spot price of crude rebounded from a dip the prior week. But prices initially headed downward with a $2.51 per barrel drop on Monday after Saudi Arabian Oil Minister described global markets as “oversupplied.” The drop in equities also led some traders to believe that weakness would transfer to economic growth, tugging on oil demand.
Crude rose somewhat Tuesday on a decline in the dollar. The dollar fell on speculation that the European Central Bank will soon raise rates further.
The jump in crude was largely on Wednesday as a surge in stocks lifted oil by $2.55 per barrel. Another gain in equities on Thursday—based on strong earnings—lifted confidence in the economy and in demand for crude.
Net for the week, spot prices for West Texas Intermediate advanced $1.95 per barrel to settle at $111.58.
Housing news took the spotlight most of the week although the Philly Fed report took center stage the last day of trading.
 Numbers for most housing indicators were quite volatile over the winter months as atypical seasonal weather impacted construction and sales traffic. But housing construction may be returning to seasonal normalcy. Starts are up but still at a depressed pace. Housing starts in March rebounded 7.2 percent, following a monthly 18.5 percent drop in February. The March annualized pace of 0.549 million is down 13.4 percent on a year-ago basis. Numbers for most housing indicators were quite volatile over the winter months as atypical seasonal weather impacted construction and sales traffic. But housing construction may be returning to seasonal normalcy. Starts are up but still at a depressed pace. Housing starts in March rebounded 7.2 percent, following a monthly 18.5 percent drop in February. The March annualized pace of 0.549 million is down 13.4 percent on a year-ago basis.
The improvement in March was led by a monthly 7.7 percent boost in single-family starts, following an 8.8 percent decrease in February. The multifamily component made a 5.8 percent partial comeback after plunging 39.4 percent in February. Overall starts for February were revised up to 0.512 million units annualized from the original estimate of 0.479 million.
 By region, the rebound in starts in was led by a 32.3 percent jump in the Midwest which is where February starts took the biggest hit (down 45.1 percent), likely due to severe winter storms. Also improving were the West, up 27.6 percent, and the Northeast, up 5.4 percent. The South slipped 3.3 percent, which also was impacted by atypical winter weather. By region, the rebound in starts in was led by a 32.3 percent jump in the Midwest which is where February starts took the biggest hit (down 45.1 percent), likely due to severe winter storms. Also improving were the West, up 27.6 percent, and the Northeast, up 5.4 percent. The South slipped 3.3 percent, which also was impacted by atypical winter weather.
There may be modest improvement ahead for housing starts. Housing permits gained 11.2 percent in March after decreasing 5.2 percent the prior month. Overall permits came in at an annualized rate of 0.534 million units and are down 13.3 percent on a year-ago basis.
But the bottom line is that after volatility is discounted, starts are still bumping along bottom. Activity is still at a depressed level. Despite the favorable numbers, it is good that they were not much better. Supply is still high and too much of a boost in starts would simply mean pullback later until demand is more robust. For construction to resume to a truly sustainable uptrend, sales must pick up substantially and new and existing home supply must come down. We are quite a way from that.
 Existing home sales have been bumpy over the last few months and rebounded a little in the latest month. Existing home sales rebounded 3.7 percent in March to an annual rate of 5.1 million. Sales had dropped a monthly 8.9 percent the prior month due to winter storms—especially in the South which makes up the bulk of home sales. Existing home sales have been bumpy over the last few months and rebounded a little in the latest month. Existing home sales rebounded 3.7 percent in March to an annual rate of 5.1 million. Sales had dropped a monthly 8.9 percent the prior month due to winter storms—especially in the South which makes up the bulk of home sales.
Prices firmed slightly, up 2.2 percent for the median reading to $159,600. This follows a drop of 1.1 percent in February. The latest improvement is likely a seasonal effect (prices are not seasonally adjusted). Yet year-on-year, price contraction of 5.9 percent is a little deeper than 5.2 percent in the prior month. Distressed sales made up 40 percent of all sales for the highest rate in nearly two years and certainly helps to explain price sluggishness.
Slightly more homes were on the market, 3.549 million, but the solid rise in sales brought down the supply reading slightly to a still very heavy 8.4 months. There is still plenty of inventory to be worked off and if the market improves, fence sitters who have wanted to sell but were reluctant to put their home on a weak market may choose to do so—further delaying a full strengthening in this sector. The housing market may be lifting slightly but is still near the bottom.
 While the existing home sales report showed a modest rise in home prices, the more reliable FHFA home price index suggests otherwise. Home prices continued a recent downtrend and it appears to be worsening somewhat. The FHFA purchase only house price index declined 1.6 percent in February, following a revised decrease of 1.0 percent in January (originally down 0.3 percent). The latest weakening is consistent with the increased share of home sales being distressed sales. The FHFA home price index is seasonally adjusted and is based on repeat transactions (comparing same houses) whereas the existing home sales report has neither of these key features. While the existing home sales report showed a modest rise in home prices, the more reliable FHFA home price index suggests otherwise. Home prices continued a recent downtrend and it appears to be worsening somewhat. The FHFA purchase only house price index declined 1.6 percent in February, following a revised decrease of 1.0 percent in January (originally down 0.3 percent). The latest weakening is consistent with the increased share of home sales being distressed sales. The FHFA home price index is seasonally adjusted and is based on repeat transactions (comparing same houses) whereas the existing home sales report has neither of these key features.
On a year-on-year basis, the FHFA HPI is down 5.7 percent, compared to down 4.8 percent in January.
 Manufacturing may not be as robust as believed. According to the Philly Fed, manufacturing growth in the mid-Atlantic states is slowing as its general business activity index eased in April to 18.5 from 43.4 in March. The latest number is still above breakeven of zero but reflects a slower growth rate. Manufacturing may not be as robust as believed. According to the Philly Fed, manufacturing growth in the mid-Atlantic states is slowing as its general business activity index eased in April to 18.5 from 43.4 in March. The latest number is still above breakeven of zero but reflects a slower growth rate.
The details are still positive but disappointing for the most part, softening from strong numbers in March. The new orders index declined to 18.8 from 40.3 while shipments eased much less to 29.1 from 34.9 in March. Labor series were mixed as the number of employees index dipped 5.9 points to 12.3 while the workweek index rose 4.5 points to 17.7. Prices remain elevated with output prices, in a sign of cost pass through, continuing to gain traction.
Both delivery times and inventory accumulation slowed in what could be early effects from Japanese-based shortages. In a special question about Japan, 10 percent of respondents report ongoing effects, 10 percent expect future effects, while a sizable 80 percent see no effect at all with the latter reading a reminder that not all manufacturers are exporters or depend on Japanese parts.
 The index of leading economic indicators is pointing to sustained growth through year end but not accelerating growth. The index for March rose 0.4 percent, less than half February's rate of 1.0 percent (revised from 0.8 percent). The index of leading economic indicators is pointing to sustained growth through year end but not accelerating growth. The index for March rose 0.4 percent, less than half February's rate of 1.0 percent (revised from 0.8 percent).
Components provide some interesting detail. The strongest component was the spread between the 10-year T-note and fed funds rate which added 0.34 percentage points. The Fed is still providing plenty of liquidity in financial markets. The second strongest component was building permits which added 0.28 percentage points. Vendor performance followed closely, adding 0.27. Incremental positives were seen in the factory workweek, new orders for consumer goods, and in initial jobless claims.
The biggest negative was consumer expectations, subtracting 0.41 percentage points, and likely reflecting higher gasoline prices, still high unemployment, and geopolitical concerns. The second biggest detractor was money supply which sliced off 0.06 percentage point from the index. This suggests why some within the Fed do not want to cut quantitative easing short—expansive liquidity is not translating yet into strong growth in the money supply. Other modest negatives were new orders for nondefense capital goods and stock prices.
The coincident index is consistent with the view of some economists that the first quarter slowed from the fourth. This index advanced 0.2 percent in March, following an incremental gain of 0.1 percent in February.
The latest economic news was mixed showing a somewhat improved housing sector in terms of activity but not price. Manufacturing may have hit a bump in the road but remains on an uptrend. The recovery continues but at an uneven pace. Meanwhile, companies are still mostly finding ways to boost earnings.
Earnings news will have to compete with a surge of new economic data. On Monday, new home sales is on tap followed by one of two readings on the consumer's mood on Tuesday in the consumer confidence report. Wednesday is loaded with durables in the morning, the Fed's FOMC announcement just after noon and Chairman Bernanke's first FOMC press conference in early afternoon. Thursday sees the first estimate of first quarter GDP and the week closes with personal income and the second reading on the consumer mood with Michigan's consumer sentiment index.
New home sales plunged 16.9 percent in February to an annual rate of 250,000. February's pace was a record low for a series going back to 1963. Supply on the market rose to 8.9 months from January's 7.4 months and compared against 8.0 months in February last year. The median price fell 13.9 percent in the month to $202,100, putting the year-ago rate at down 8.9 percent. It should be pointed out that prices for both existing and new home sales are affected by the mix of sales between low and high end. Looking ahead, we may see some comeback in March if existing home sales provide any guidance. Last week's release showed existing home sales posting a 3.7 percent gain, partially rebounding from an 8.9 percent drop in February. Atypical winter weather may have bumped February numbers down and March could be reflecting a return to normalcy—though at a still depressed level of activity.
New home sales Consensus Forecast for March 11: 280 thousand-unit annual rate
Range: 270 thousand to 300 thousand-unit annual rate
The Conference Board's consumer confidence index in March fell 8.6 points to 63.4, erasing two months of improvement. Geopolitical uncertainties in Libya and the Middle East and higher prices for gasoline and food continue have begun to make consumers nervous. But nerves appear to have calmed a bit as seen in a modest gain in the University of Michigan's consumer sentiment index for mid-April.
Consumer confidence Consensus Forecast for April 11: 65
Range: 63 to 65
Durable goods orders in February dipped a revised 0.6 percent (originally down 0.9 percent), following a 3.6 percent rebound in January. Excluding transportation, new orders for durable goods decreased 0.3 percent (first estimate at down 0.6 percent) after a 3.0 percent drop in January. Transportation led February's decrease, slipping 1.5 percent after a huge 29.7 percent jump in January. Outside of transportation, the numbers were mixed.
New orders for durable goods Consensus Forecast for March 11: +1.9 percent
Range: +0.5 percent to +3.0 percent
The FOMC announcement at 12:15 p.m. ET (moved up to make way for the chairman's press conference later in the afternoon) for the April 26-27 FOMC policy meeting is expected to leave the target rate unchanged at a range of zero to 0.25 percent. Given divergent views on the need (or not) for further quantitative easing, the focus of the announcement likely will be any hint regarding any possible QE3 or more likely how the Fed's balance sheet will be unwound. That is, will the Fed take action to slow the natural unwinding from pay down on mortgage-backed securities and other debt'
FOMC Consensus Forecast for 4/27/11 policy vote on fed funds target range: unchanged at a range of zero to 0.25 percent
Chairman press conference after the FOMC meeting statement is scheduled for 2:15 p.m. ET. Fed Chairman Ben Bernanke conducts a press conference after FOMC meetings in which participants present their quarterly economic forecasts. Bernanke is expected to comment on the forecast and take Q&A. The status of the recovery and quantitative easing are likely the hot topics although reporters could slip in questions on the federal deficit as well as the downgrade to the federal government's long-term credit outlook.
GDP growth for the final estimate for the fourth quarter was revised up to 3.1 percent annualized growth from the second estimate of 2.8 percent. As with the prior estimate, the fourth quarter was still stronger than the third quarter pace of 2.6 percent. Demand numbers were little changed. Final sales of domestic product were unrevised net from the second estimate of 6.7 percent. Final sales to domestic purchasers (takes out net exports) were revised up marginally to 3.2 percent from the second estimate of 3.1 percent for the fourth quarter. On the inflation front, the GDP price index was unrevised compared to the second estimate of 0.4 percent.
Real GDP Consensus Forecast for advance estimate Q1 11: +2.0 percent annual rate
Range: +1.5 to +3.0 percent annual rate
GDP price index Consensus Forecast for advance estimate Q1 11: +2.2 percent annual rate
Range: +1.5 to +2.5 percent annual rate
Initial jobless claims for the April 16 week fell 13,000 to 403,000, not quite as low as expected and compared with 416,000 in the prior week (revised 4,000 higher). The latest improvement was too modest to keep the four-week average from rising for the fourth time in five weeks, up 2,250 to 399,000.
Jobless Claims Consensus Forecast for 4/23/11: 390,000
Range: 280,000 to 410,000
Personal income in February advanced 0.3 percent, following a 1.2 percent increase the prior month. Wages & salaries gained a moderately healthy 0.3 percent, matching the rise in January. As in recent months, consumer spending in February was led by auto sales and higher gasoline prices. Personal consumption expenditures jumped 0.7 percent, following a 0.3 percent rise in January. On the inflation front, the PCE price index increased a notably warm 0.4 percent, topping the 0.3 percent boost in January. The core rate gained 0.2 percent in February, matching the prior month's pace. Looking ahead, the wages & salaries component of personal income in March is likely to be positive but soft as aggregate earnings advanced 0.2 percent for the month. Spending may be mixed as unit new motor vehicle sales slipped 2.4 percent in March while retail sales excluding autos jumped 0.8 percent. PCE inflation also is likely to be mixed as the headline CPI jumped 0.5 percent in March while the core CPI edged up 0.1 percent.
Personal income Consensus Forecast for March 11: +0.3 percent
Range: +0.2 to +0.5 percent
Personal consumption expenditures Consensus Forecast for March 11: +0.5 percent
Range: +0.1 to +0.7 percent
Core PCE price index Consensus Forecast for March 11: +0.1 percent
Range: +0.1 to +0.3 percent
The Chicago PMI in March eased 2.4 points to 57.3 but remained in positive territory (above 50), indicating continued moderate growth in activity. But a healthy number for April is likely as the March new orders index new orders slipped 1-1/2 points in March to 74.2, still well over 50 to indicate month-to-month growth.
Chicago PMI Consensus Forecast for April 11: 68.0
Range: 65.0 to 69.1
The Reuter's/University of Michigan's Consumer sentiment index for the mid-April reading rose 2.1 points to 69.6 from the final number of 67.5 for March. However, this is still near six-month lows. The gain was centered in the expectations component which is the composite's leading component and which gained 3.3 points to a 61.2 level. The current conditions component, at 82.7 for a small 0.2 point gain, has been holding up better than expectations. Inflation expectations remain very elevated for the one-year outlook, unchanged at 4.6 percent, but they did fall back three tenths for the five-year outlook to 2.9 percent.
Consumer sentiment Consensus Forecast for final April 11: 69.6
Range: 68.0 to 70.0
R. Mark Rogers is the author of The Complete Idiot's Guide to Economic Indicators, Penguin Books, 2009.
Econoday Senior Writer Mark Pender contributed to this article.
|
