|
Equity indexes with the exception of the Shanghai Composite and Bolsa ended the holiday-shortened trading week in positive territory as better than expected earnings overcame market negatives. But it was not smooth sailing. Markets dropped in heavy volume Monday after Standard & Poor's downgraded the credit outlook of the United States. Adding to worries about the global economy, the People’s Bank of China moved to curb liquidity by increasing the required reserves for the fourth time this year and extending the fight against excessive liquidity and stubbornly high inflation. Investors also focused on Greece where financial markets are increasingly convinced that the country will have to renegotiate terms of its public debt. Greek officials denied that some form of debt rescheduling is imminent.
Although Standard & Poors affirmed its AAA credit ratings on U.S. sovereign debt, the agency said that its outlook on the long term rating was revised to negative from stable due to the country’s rising deficits and the government’s inability to reach an agreement on addressing them. Analysts said that Standard & Poor’s had previously warned that the U.S.’s top rating could be at risk and that its move was probably timed to follow the International Monetary Fund’s warning on the country’s budget deficit last week.
|
|
2010 |
2011 |
% Change |
|
Index |
Dec. 31 |
Apr 15 |
Apr 21 |
Week |
Year |
| Asia/Pacific |
|
|
|
|
|
|
| Australia |
All Ordinaries |
4846.9 |
4939.3 |
4995.7 |
1.1% |
3.1% |
| Japan |
Nikkei 225 |
10228.9 |
9591.5 |
9685.8 |
1.0% |
-5.3% |
|
Topix |
898.8 |
841.3 |
841.7 |
0.1% |
-6.4% |
| Hong Kong |
Hang Seng |
23035.5 |
24008.1 |
24138.3 |
0.5% |
4.8% |
| S. Korea |
Kospi |
2051.0 |
2140.5 |
2198.5 |
2.7% |
7.2% |
| Singapore |
STI |
3190.0 |
3153.3 |
3194.7 |
1.3% |
0.1% |
| China |
Shanghai Composite |
2808.1 |
3050.5 |
3026.7 |
-0.8% |
9.7% |
|
|
|
|
|
|
|
| India |
Sensex 30 |
20509.1 |
19386.8 |
19602.2 |
1.1% |
-4.4% |
| Indonesia |
Jakarta Composite |
3703.5 |
3730.5 |
3801.1 |
1.9% |
2.6% |
| Malaysia |
KLCI |
1518.9 |
1521.9 |
1526.3 |
0.3% |
0.5% |
| Philippines |
PSEi |
4201.1 |
4251.6 |
4274.8 |
0.5% |
1.8% |
| Taiwan |
Taiex |
8972.5 |
8718.1 |
8957.7 |
2.7% |
-0.2% |
| Thailand |
SET |
1032.8 |
1084.9 |
1109.9 |
2.3% |
7.5% |
|
|
|
|
|
|
|
| Europe |
|
|
|
|
|
|
| UK |
FTSE 100 |
5899.9 |
5996.0 |
6018.3 |
0.4% |
2.0% |
| France |
CAC |
3804.8 |
3974.5 |
4021.9 |
1.2% |
5.7% |
| Germany |
XETRA DAX |
6914.2 |
7178.3 |
7295.5 |
1.6% |
5.5% |
|
|
|
|
|
|
|
| North America |
|
|
|
|
|
|
| United States |
Dow |
11577.5 |
12341.8 |
12506.0 |
1.3% |
8.0% |
|
NASDAQ |
2652.9 |
2764.7 |
2820.2 |
2.0% |
6.3% |
|
S&P 500 |
1257.6 |
1319.7 |
1337.4 |
1.3% |
6.3% |
| Canada |
S&P/TSX Comp. |
13443.2 |
13799.1 |
13972.0 |
1.3% |
3.9% |
| Mexico |
Bolsa |
38550.8 |
36988.4 |
36816.3 |
-0.5% |
-4.5% |
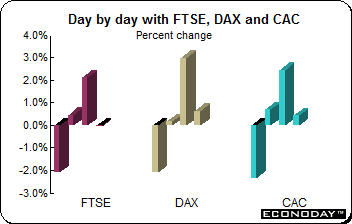 After sinking on Monday, the FTSE, CAC and DAX rallied and finished the holiday-shortened week in positive territory. Strength was in the auto and technology sectors, as worries about sovereign debt abated following relatively successful Spanish and Portuguese bond auctions. Optimism over the emerging U.S. earnings season also helped sentiment. Monday’s plunge occurred after Standard & Poor's retained its AAA rating but cut its outlook on the U.S. to negative from stable. S&P questioned the ability of Congress to agree on budget balancing measures. This elevated further worries in markets already spooked by European debt fears. But the negative reaction did not last for long. On the week, the FTSE was up 0.4 percent, the CAC gained 1.2 percent and the DAX advanced 1.6 percent. After sinking on Monday, the FTSE, CAC and DAX rallied and finished the holiday-shortened week in positive territory. Strength was in the auto and technology sectors, as worries about sovereign debt abated following relatively successful Spanish and Portuguese bond auctions. Optimism over the emerging U.S. earnings season also helped sentiment. Monday’s plunge occurred after Standard & Poor's retained its AAA rating but cut its outlook on the U.S. to negative from stable. S&P questioned the ability of Congress to agree on budget balancing measures. This elevated further worries in markets already spooked by European debt fears. But the negative reaction did not last for long. On the week, the FTSE was up 0.4 percent, the CAC gained 1.2 percent and the DAX advanced 1.6 percent.
Favorable economic data from the flash service and manufacturing PMIs helped boost morale and alleviate worries about growth. European services and manufacturing growth unexpectedly accelerated in April, suggesting the economy is weathering surging energy costs and tougher austerity measures. A composite index based on a survey of eurozone purchasing managers in both industries edged up to 57.8 from 57.6 in March. A reading above 50 indicates growth.
As widely anticipated, minutes of this month's monetary policy committee meeting once again highlighted the sharply opposing policy views with the voting pattern unchanged from March. The previous sole dissenter calling for an increase in QE (Adam Posen) maintained his stance and joined the same other five members opting for a steady hand on interest rates. MPC members Dale and Weale underscored their preference for a 25 basis point increase while arch-hawk Sentance continued to press for a full 50 basis point increase. The minutes indicate that in general the MPC had become more wary about tightening policy too soon. Crucial to the outcome of the discussions, wage growth had shown no signs of any significant acceleration and there remained much uncertainty as to whether the fourth quarter economic slowdown was just a weather-related temporary phenomenon or a real shift in trend.
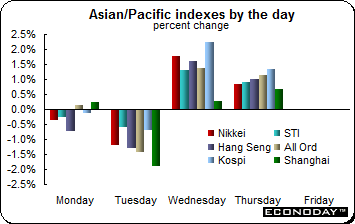 After beginning the week on negative note, equities rallied on Wednesday and Thursday and in the process wiped out earlier losses on better than anticipated earnings — especially from the technology sector. Only the Shanghai Composite was down on the week. With little in the way of new economic data in the region, earnings were in focus. Wednesday’s turnaround was spurred on by strong U.S. earnings and better than expected U.S. economic data. On the week, gains ranged from 0.1 percent (Topix) to 2.7 percent (Kospi and Taiex). After beginning the week on negative note, equities rallied on Wednesday and Thursday and in the process wiped out earlier losses on better than anticipated earnings — especially from the technology sector. Only the Shanghai Composite was down on the week. With little in the way of new economic data in the region, earnings were in focus. Wednesday’s turnaround was spurred on by strong U.S. earnings and better than expected U.S. economic data. On the week, gains ranged from 0.1 percent (Topix) to 2.7 percent (Kospi and Taiex).
Over the weekend, the People’s Bank of China once again increased its reserve requirements by 50 basis points to 20.5 percent to cool off the growth rate amid rising inflation. The fourth such increase this year came after the consumer price index jumped by 5.4 percent. The increase had little impact on the markets — the move had been widely expected by investors who have become familiar with the PBoC’s weekend and holiday timed monetary responses. Despite the fundamentally good economic backdrop in many of the fast growing Asian economies, investors are increasingly fretting about how policy makers will act to contain the mounting inflation that is plaguing much of the region.
 The U.S. dollar was battered last week as traders flocked to riskier and higher yielding assets. With monetary policy edging back towards normal in many countries and with the Federal Reserve expected to maintain its easy policy into the future, investors are trading on interest rate spreads. Investors sent gold through the $1,500 level and silver hit new highs as well. The U.S. dollar was battered last week as traders flocked to riskier and higher yielding assets. With monetary policy edging back towards normal in many countries and with the Federal Reserve expected to maintain its easy policy into the future, investors are trading on interest rate spreads. Investors sent gold through the $1,500 level and silver hit new highs as well.
The Australian dollar climbed to a record Friday after first quarter producer prices rose more than economists estimated, providing additional evidence growth is accelerating. The Australian dollar strengthened for a third day against its U.S. counterpart as equity gains boosted demand for the nation’s higher yielding assets. The benchmark interest rate is 4.75 percent in Australia compared with as low as zero in the U.S. and Japan, attracting investors to the higher-yielding assets. The pound surged against the dollar as well after data showed retail sales unexpectedly gained and the UK budget deficit was below estimates, buoying recovery confidence and strengthening the case for higher interest rates. Traders expect that the Bank of England will lift interest rates this year while the Federal Reserve will probably keep its expansionary stance into 2012.
The euro was lifted on the week, in part by diminishing worries about the region's ongoing sovereign debt woes. Spain successfully auctioned off debt and alleviating — for the moment — some concerns that it might be the next country to face a debt crisis following Portugal, Ireland and Greece. Analysts also said reports that Finland's incoming prime minister would support a planned Portuguese bailout package helped allay concerns. Uncertainty about whether Finland would block a rescue package increased after a strong election showing by a populist, anti-bailout party.
With some of those nerves eased, traders again got back to focusing on interest-rate differentials which favor nearly every other currency against the dollar. Rising commodity prices provided an additional lift to currencies like the Canadian and Australian dollars.
Selected currencies — weekly results
|
|
2010 |
2011 |
% Change |
|
|
Dec 31 |
Apr 15 |
Apr 21 |
Week |
2011 |
| U.S. $ per currency |
|
|
|
|
|
|
| Australia |
A$ |
1.022 |
1.057 |
1.075 |
1.7% |
5.2% |
| New Zealand |
NZ$ |
0.779 |
0.800 |
0.802 |
0.3% |
2.9% |
| Canada |
C$ |
1.003 |
1.043 |
1.049 |
0.6% |
4.6% |
| Eurozone |
euro (€) |
1.337 |
1.443 |
1.455 |
0.9% |
8.8% |
| UK |
pound sterling (£) |
1.560 |
1.633 |
1.652 |
1.2% |
5.9% |
|
|
|
|
|
|
|
| Currency per U.S. $ |
|
|
|
|
|
|
| China |
yuan |
6.607 |
6.532 |
6.522 |
0.2% |
1.3% |
| Hong Kong |
HK$* |
7.773 |
7.774 |
7.767 |
0.1% |
0.1% |
| India |
rupee |
44.705 |
44.335 |
44.368 |
-0.1% |
0.8% |
| Japan |
yen |
81.230 |
83.132 |
81.787 |
1.6% |
-0.7% |
| Malaysia |
ringgit |
3.064 |
3.023 |
3.007 |
0.5% |
1.9% |
| Singapore |
Singapore $ |
1.283 |
1.243 |
1.235 |
0.6% |
3.8% |
| South Korea |
won |
1126.000 |
1089.800 |
1080.120 |
0.9% |
4.2% |
| Taiwan |
Taiwan $ |
29.299 |
29.024 |
28.880 |
0.5% |
1.5% |
| Thailand |
baht |
30.060 |
30.135 |
29.910 |
0.8% |
0.5% |
| Switzerland |
Swiss franc |
0.934 |
0.892 |
0.885 |
0.8% |
5.5% |
| *Pegged to U.S. dollar |
|
|
|
|
|
|
| Source: Bloomberg |
|
|
|
|
|
|
 March producer prices were up 0.4 percent and 6.2 percent on the year. The smallest monthly increase in overall prices since November 2010 was largely due to the capital goods area where prices were unchanged from last time. However, basics edged up 0.1 percent alongside durable consumer goods while nondurables climbed 0.3 percent. As a result, the core index was up a modest 0.2 percent and 4.4 percent on a year ago. Predictably the main upward pressure stemmed from energy where prices advanced a further 1.2 percent on the month and 10.5 percent from March 2010. March producer prices were up 0.4 percent and 6.2 percent on the year. The smallest monthly increase in overall prices since November 2010 was largely due to the capital goods area where prices were unchanged from last time. However, basics edged up 0.1 percent alongside durable consumer goods while nondurables climbed 0.3 percent. As a result, the core index was up a modest 0.2 percent and 4.4 percent on a year ago. Predictably the main upward pressure stemmed from energy where prices advanced a further 1.2 percent on the month and 10.5 percent from March 2010.
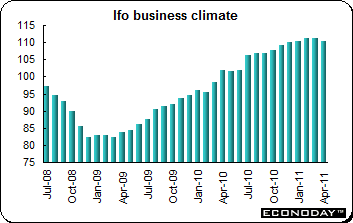 April Ifo economic sentiment slipped to 110.4 from 111.1 in March but easily strong enough to indicate a continued high level of activity. Among the components, the current conditions index edged up 0.5 points to 116.3 while expectations slipped 1.8 points to 104.7. Across the major sectors morale in manufacturing dipped 1.1 points to 28.8 and declined 3.6 points to 18.8 in wholesale. Confidence in retail was off 3 points at 9.1 but construction saw a 2 point rise to 5.7 and services improved 0.9 points to 28.9. April Ifo economic sentiment slipped to 110.4 from 111.1 in March but easily strong enough to indicate a continued high level of activity. Among the components, the current conditions index edged up 0.5 points to 116.3 while expectations slipped 1.8 points to 104.7. Across the major sectors morale in manufacturing dipped 1.1 points to 28.8 and declined 3.6 points to 18.8 in wholesale. Confidence in retail was off 3 points at 9.1 but construction saw a 2 point rise to 5.7 and services improved 0.9 points to 28.9.
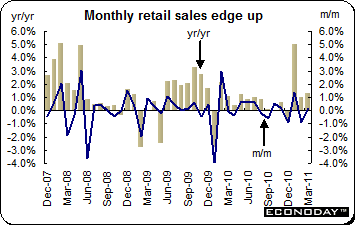 March retail sales volumes were up 0.2 percent and 1.3 percent on the year. Excluding fuel, sales also were up 0.3 percent and were 0.9 percent higher on the year. Food purchases were up 0.7 percent without which sales would have declined 0.3 percent. Sizeable declines were reported in household goods (1.1 percent) and clothing & footwear (0.6 percent) as well as less marked slide in the other stores category (0.3 percent). However, non-specialized stores (1.4 percent) performed well and non-store retailing (0.6 percent) also saw stronger demand. March retail sales volumes were up 0.2 percent and 1.3 percent on the year. Excluding fuel, sales also were up 0.3 percent and were 0.9 percent higher on the year. Food purchases were up 0.7 percent without which sales would have declined 0.3 percent. Sizeable declines were reported in household goods (1.1 percent) and clothing & footwear (0.6 percent) as well as less marked slide in the other stores category (0.3 percent). However, non-specialized stores (1.4 percent) performed well and non-store retailing (0.6 percent) also saw stronger demand.
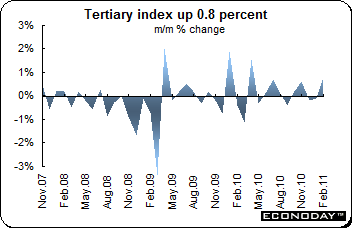 February index of tertiary industry activity was up 0.8 percent. On the year, the index was up 2 percent. Contributing to the increase were wholesale & retail trade which was up 1.8 percent, scientific research, professional & technical services which gained 3.5 percent and finance & insurance which was up 1.9 percent. Other industries that were up included transport & postal activities (up 0.9 percent), accommodations, eating & drinking services (up 1.3 percent) information & communications (up 0.5 percent), miscellaneous services (up 0.8 percent) and medical, health care & welfare (up 0.4 percent). Those industries that were down on the month included electricity, gas, heat supply & water (down 1.4 percent), living related & personal services & amusement services (down 0.7 percent), learning support (down 1.4 percent) and compound services (down 3.9 percent). Real estate and goods rental and leasing was flat on the month. February index of tertiary industry activity was up 0.8 percent. On the year, the index was up 2 percent. Contributing to the increase were wholesale & retail trade which was up 1.8 percent, scientific research, professional & technical services which gained 3.5 percent and finance & insurance which was up 1.9 percent. Other industries that were up included transport & postal activities (up 0.9 percent), accommodations, eating & drinking services (up 1.3 percent) information & communications (up 0.5 percent), miscellaneous services (up 0.8 percent) and medical, health care & welfare (up 0.4 percent). Those industries that were down on the month included electricity, gas, heat supply & water (down 1.4 percent), living related & personal services & amusement services (down 0.7 percent), learning support (down 1.4 percent) and compound services (down 3.9 percent). Real estate and goods rental and leasing was flat on the month.
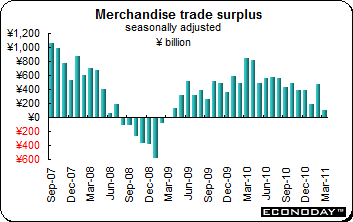 March unadjusted merchandise trade surplus was ¥196.5 billion, down from ¥931.9 billion a year ago. Exports declined 2.2 percent while imports were up 11.9 percent when compared with the previous year. On a seasonally adjusted basis, the merchandise trade surplus was ¥96.3 billion, down from ¥477.4 billion in February. According to the Ministry of Finance, the March 11 earthquake hurt exports but especially autos. In trade with the U.S., exports were down 3.4 percent while imports dropped 6.6 percent. Exports to the EU were up 3.2 percent on the year while imports were down 3.1 percent. Exports to Asia were virtually unchanged when compared with last year while imports jumped 17.3 percent. Exports to China jumped 3.8 percent while imports soared by 25 percent on the year. March unadjusted merchandise trade surplus was ¥196.5 billion, down from ¥931.9 billion a year ago. Exports declined 2.2 percent while imports were up 11.9 percent when compared with the previous year. On a seasonally adjusted basis, the merchandise trade surplus was ¥96.3 billion, down from ¥477.4 billion in February. According to the Ministry of Finance, the March 11 earthquake hurt exports but especially autos. In trade with the U.S., exports were down 3.4 percent while imports dropped 6.6 percent. Exports to the EU were up 3.2 percent on the year while imports were down 3.1 percent. Exports to Asia were virtually unchanged when compared with last year while imports jumped 17.3 percent. Exports to China jumped 3.8 percent while imports soared by 25 percent on the year.
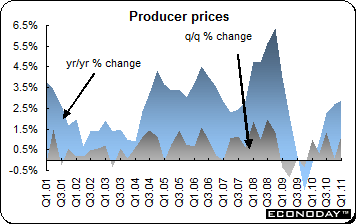 First quarter producer price index was up a greater than expected 1.2 percent. On the year, prices were up 2.9 percent. Domestic prices were up 1.4 percent and 3.9 percent on the year while imports were down 0.3 percent and declined 3.9 percent on the year. The price increase was mainly due to the 13.7 percent jump in petroleum refining and a 13.7 percent jump in other agriculture prices. Electricity, gas & water prices were up 2.7 percent. The increases were partly offset by the 7.6 percent decline in the prices received for commercial fishing. Intermediate commodity prices were up 2.3 percent on the quarter and 4.4 percent when compared with a year ago. Here too, the increase in prices reflects a 14.2 percent jump in petroleum refining along with a 9.4 percent rise in prices for grain, sheep, beef and dairy cattle farming. Oil & gas extraction jumped 11.1 percent. Preliminary stage prices were up 2.6 percent on the quarter and 5.5 percent on the year. Domestic prices were up 2.4 percent and 5.4 percent on the year while import prices were up 3.9 percent and 5.4 percent on the year. First quarter producer price index was up a greater than expected 1.2 percent. On the year, prices were up 2.9 percent. Domestic prices were up 1.4 percent and 3.9 percent on the year while imports were down 0.3 percent and declined 3.9 percent on the year. The price increase was mainly due to the 13.7 percent jump in petroleum refining and a 13.7 percent jump in other agriculture prices. Electricity, gas & water prices were up 2.7 percent. The increases were partly offset by the 7.6 percent decline in the prices received for commercial fishing. Intermediate commodity prices were up 2.3 percent on the quarter and 4.4 percent when compared with a year ago. Here too, the increase in prices reflects a 14.2 percent jump in petroleum refining along with a 9.4 percent rise in prices for grain, sheep, beef and dairy cattle farming. Oil & gas extraction jumped 11.1 percent. Preliminary stage prices were up 2.6 percent on the quarter and 5.5 percent on the year. Domestic prices were up 2.4 percent and 5.4 percent on the year while import prices were up 3.9 percent and 5.4 percent on the year.
 March consumer prices jumped 1.1 percent and were up 3.3 percent on the year, its highest level since September 2008. Core CPI excluding food & energy were up 0.6 percent from February to stand 2.1 percent higher on the year. The Bank of Canada’s preferred measure jumped 0.7 percent on the month and was 1.7 percent stronger than in March 2010 after a 0.9 percent annual increase in February. The seasonally adjusted CPI was up 0.8 percent on the month and the steepest monthly increase since October 2010. Food prices surged 1.6 percent surge while clothing & footwear climbed 2.1 percent. Transportation costs were up a relatively modest 0.6 percent while recreation, education & reading posted a 0.5 percent advance and health & personal care was up 0.3 percent. Among the weakest sub-sectors, shelter edged up just 0.1 percent while alcohol & tobacco charges slipped 0.1 percent. March consumer prices jumped 1.1 percent and were up 3.3 percent on the year, its highest level since September 2008. Core CPI excluding food & energy were up 0.6 percent from February to stand 2.1 percent higher on the year. The Bank of Canada’s preferred measure jumped 0.7 percent on the month and was 1.7 percent stronger than in March 2010 after a 0.9 percent annual increase in February. The seasonally adjusted CPI was up 0.8 percent on the month and the steepest monthly increase since October 2010. Food prices surged 1.6 percent surge while clothing & footwear climbed 2.1 percent. Transportation costs were up a relatively modest 0.6 percent while recreation, education & reading posted a 0.5 percent advance and health & personal care was up 0.3 percent. Among the weakest sub-sectors, shelter edged up just 0.1 percent while alcohol & tobacco charges slipped 0.1 percent.
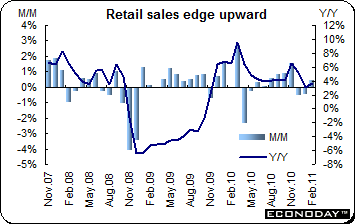 February retail sales were up 0.4 percent and 3.7 percent when compared with last year. Volumes also rose 0.4 percent from January. Higher purchases were reported in nine of the eleven sub-sectors but the most significant contribution came from gasoline stations where nominal sales rose 1.3 percent. The other main areas of strength were clothing (3.1 percent), furniture & home furnishings (2.1 percent), sporting goods & hobbies (1.4 percent) and miscellaneous stores (1.6 percent). Food & beverage sales were up a more subdued 0.3 percent on the month. Weaker demand was seen in motor vehicles and parts & electronics (both down 0.6 percent), the former declining for the third consecutive month and the latter down for the fourth month in a row. February retail sales were up 0.4 percent and 3.7 percent when compared with last year. Volumes also rose 0.4 percent from January. Higher purchases were reported in nine of the eleven sub-sectors but the most significant contribution came from gasoline stations where nominal sales rose 1.3 percent. The other main areas of strength were clothing (3.1 percent), furniture & home furnishings (2.1 percent), sporting goods & hobbies (1.4 percent) and miscellaneous stores (1.6 percent). Food & beverage sales were up a more subdued 0.3 percent on the month. Weaker demand was seen in motor vehicles and parts & electronics (both down 0.6 percent), the former declining for the third consecutive month and the latter down for the fourth month in a row.
Investors focused on earnings reports from companies such as Intel, Apple, IBM and General Electric. The U.S. dollar dropped as investors became less risk averse.
While the pace last week was languid, the pace of new economic information picks up in the last week of April. Highlighting the calendar is the FOMC announcement and Chairman Ben Bernanke’s first post announcement press conference. The Bank of Japan is also scheduled as is the Reserve Bank of New Zealand. No policy changes are expected. In Japan, new data for the month of March is scheduled and will partially show the impact of the March 11th disaster. Also on tap are advance estimates of UK and U.S. first quarter gross domestic product.
| Central Bank activities |
|
| April 26,27 |
United States |
FOMC Meeting and Press Conference |
| April 27 |
New Zealand |
Reserve Bank of New Zealand Announcement |
| April 28 |
Japan |
Bank of Japan Policy Announcement |
|
|
|
| The following indicators will be released this week... |
| Europe |
|
|
| April 26 |
Germany |
Retail Sales (March) |
| April 27 |
UK |
Gross Domestic Product (Q2.2011, preliminary) |
| April 28 |
Germany |
Unemployment (April) |
|
France |
Consumption of Manufactured Goods (March) |
| April 29 |
EMU |
M3 Money Supply (March) |
|
|
Harmonized Index of Consumer Prices (April, flash) |
|
|
Business and Consumer Sentiment (April) |
|
|
Unemployment (March) |
|
France |
Producer Price Index (March) |
|
italy |
Producer Price Index (March) |
|
|
|
| Asia/Pacific |
|
|
| April 27 |
Japan |
Retail Sales (March) |
|
Australia |
Consumer Price Index (Q1. 2011) |
| April 28 |
Japan |
Consumer Price Index (March) |
|
|
All Household Spending (March) |
|
|
Unemployment (March) |
|
|
Industrial Production (March) |
|
|
|
| Americas |
|
|
| April 29 |
Canada |
Monthly Gross Domestic Product (February) |
Anne D Picker is the author of International Economic Indicators and Central Banks.
|
