|
This past week, the economic news was favorable outside of headline inflation numbers. But a mix of diverse negative news bumped equities down. The mix ranged from the IMF, Japan’s nuclear woes, bank bashing, to disappointing earnings.
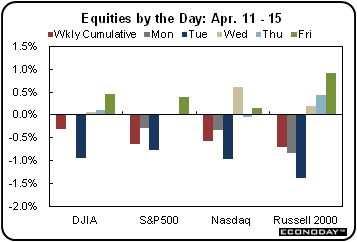 Equities ended the week down despite signs that the U.S. economy is strengthening. The biggest negatives were on Monday and Tuesday, starting with a downgrade of the U.S. recovery by the International Monetary Fund. The weakened forecast pulled down the price of crude, energy patch stocks and overall equities. Also, GM slipped after China forecast slower-than-expected auto sales. Equities ended the week down despite signs that the U.S. economy is strengthening. The biggest negatives were on Monday and Tuesday, starting with a downgrade of the U.S. recovery by the International Monetary Fund. The weakened forecast pulled down the price of crude, energy patch stocks and overall equities. Also, GM slipped after China forecast slower-than-expected auto sales.
A variety of factors tugged stocks down on Tuesday, including a Monday after close release of earnings by Alcoa. Earnings were in line but revenues disappointed. Comments on higher energy and materials costs weighed on the company shares as well as equities in general. Also bumping stocks down was a re-rating of the damage from Japan’s stricken nuclear reactor to equal that of Chernobyl—meaning that in the end more radiation may be released than by the Soviet reactor.
Equities began to recover at mid-week with a mostly favorable retail sales report. But stocks declined in early trading after JPMorgan warned that mortgage-related losses would continue for some time. Comments from a Senate report blasting Goldman Sachs for their reckless financial strategies ahead of the recent financial crisis also weighed on financials. An upward reversal for the day started after the Fed’s Beige Book indicated that the recovery was slowly spreading and becoming more entrenched. Also, President Barack Obama’s afternoon speech on his plan to cut the U.S. budget deficit over 12 years was encouraging to markets. Stocks rose Thursday after the U.S. House approved a plan to avert a government shutdown, more than offsetting an unexpected jump in jobless claims.
The week ended on a positive note as favorable reports on consumer prices (core), Empire State, industrial production, and consumer sentiment lifted stocks.
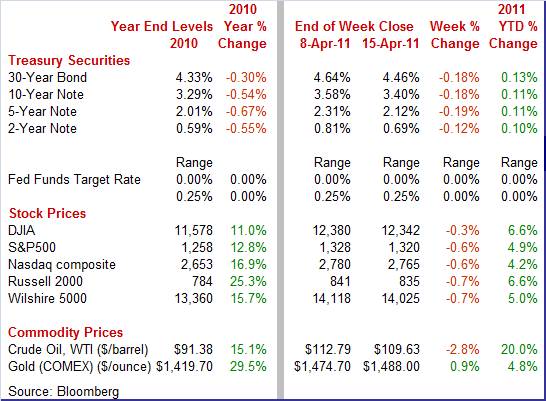
Equities were down this past week. The Dow was down 0.3 percent; the S&P 500, down 0.6 percent; the Nasdaq, down 0.6 percent; and the Russell 2000, down 0.7 percent.
For the year-to-date, major indexes are up as follows: the Dow, up 6.6 percent; the S&P 500, up 4.9 percent; the Nasdaq, up 4.2 percent; and the Russell 2000, up 6.6 percent.
Weekly percent change column reflects percent changes for all components except interest rates. Interest rate changes are reflected in simple differences.
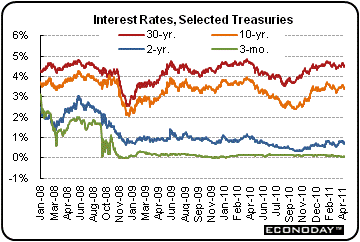
Treasury rates declined notably this past week with most of the action on Tuesday and Friday. On Tuesday, rates declined on flight to safety as stocks and commodities dropped on news of a worsening in Japan’s nuclear crisis.
On Friday, yields eased substantially on a better-than-expected core CPI released that morning. Analysts had expected a 0.2 percent increase in core inflation for March but it came in at 0.1 percent. Headline inflation was high at 0.5 percent but matched forecasts.
 For this past week Treasury rates were down as follows: the 2-year note, down 12 basis points; the 5-year note, down 12 basis points; the 7-year note, down 19 basis points; the 10-year note, down 18 basis points; and the 30-year bond, down 18 basis points. The 3-month T-bill rose 2 basis points. For this past week Treasury rates were down as follows: the 2-year note, down 12 basis points; the 5-year note, down 12 basis points; the 7-year note, down 19 basis points; the 10-year note, down 18 basis points; and the 30-year bond, down 18 basis points. The 3-month T-bill rose 2 basis points.
Despite softness in rates this past week, yields on the longer maturities remain elevated on concern that the Fed indeed will conclude quantitative easing after June, that inflation is more likely to head up, and the Federal deficit still requires massive borrowing for many years to come.
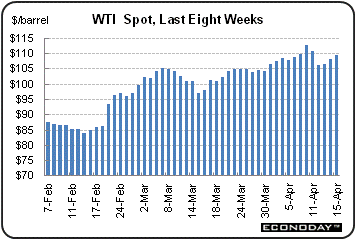 This past week, crude came off the recent high of $112.79 set at close April 8. Weakness was largely during the first two days of the week. The spot price of West Texas Intermediate was bumped down by the IMF’s lowered forecast for the U.S. The biggest drop was Tuesday—well over a $4-1/2 per barrel fall—after the International Energy Agency stated that oil prices above $100 per barrel were starting to dampen the global economy. But crude got some lift on Friday after healthy economic reports on manufacturing and consumer sentiment. This past week, crude came off the recent high of $112.79 set at close April 8. Weakness was largely during the first two days of the week. The spot price of West Texas Intermediate was bumped down by the IMF’s lowered forecast for the U.S. The biggest drop was Tuesday—well over a $4-1/2 per barrel fall—after the International Energy Agency stated that oil prices above $100 per barrel were starting to dampen the global economy. But crude got some lift on Friday after healthy economic reports on manufacturing and consumer sentiment.
Net for the week, spot prices for West Texas Intermediate fell $3.16 per barrel to settle at $109.63.
It was a good week for the economy with consumer and manufacturing sectors posting healthy reports. Inflation, however, was hot at the headline level.
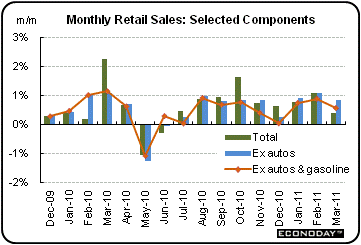 Many economists expected the March retail sales report to be dominated by a price-induced jump in gasoline sales. While service station sales indeed were robust, sales were mostly healthy outside this component. Overall retail sales advanced 0.4 percent, following a revised 1.1 percent gain in February and a revised 0.8 percent increase in January. Many economists expected the March retail sales report to be dominated by a price-induced jump in gasoline sales. While service station sales indeed were robust, sales were mostly healthy outside this component. Overall retail sales advanced 0.4 percent, following a revised 1.1 percent gain in February and a revised 0.8 percent increase in January.
Sales at motor vehicle & parts dealers declined 1.7 percent in the latest month but this was not a surprise as earlier released unit new motor vehicle sales were down 2.4 percent for the month. These two data series (autos in retail sales and unit new motor vehicle sales), however, are based on somewhat different methodologies.
Excluding autos, sales gained 0.8 percent, following a 1.1 percent increase in February. Importantly, sales excluding autos and gasoline in March advanced 0.6 percent, following a 0.9 percent increase in February. Some of components that were strong include furniture & home furnishings, building materials, electronics & appliance stores, clothing, general merchandise, and food services & drinking places.
The widespread strength in retail sales is encouraging, apparently reflecting greater willing on the part of consumers to spend. Some interesting patterns are showing up, however. Gains in furniture & home furnishings; building materials; and electronics & appliance stores suggest that while home sales are anemic, homeowners are starting to spend money on improving the quality of the homes. Also, increases in very discretionary spending such as food services & drinking places are favorable. But rising costs for gasoline and food may be cutting into discretionary income and could dampen spending unless offset by improved employment gains.
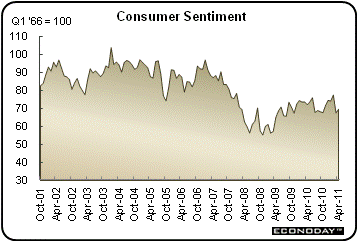 Recently, the consumer mood has soured on higher gasoline prices with continued high unemployment also weighing on sentiment. But the latest reading from the Reuters/University of Michigan report shows a mild bounce back. Recently, the consumer mood has soured on higher gasoline prices with continued high unemployment also weighing on sentiment. But the latest reading from the Reuters/University of Michigan report shows a mild bounce back.
The consumer sentiment index for the mid-April reading rose 2.1 points to 69.6 from the final number of 67.5 for March. However, this is still near six-month lows.
The gain was centered in the expectations component which is the composite's leading component and which gained 3.3 points to a 61.2 level that, however, is still near a six-month low. The current conditions component, at 82.7 for a small 0.2 point gain, has been holding up better than expectations.
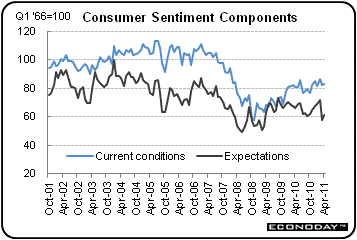 Inflation expectations remain very elevated for the one-year outlook, unchanged at 4.6 percent, but they did fall back three tenths for the five-year outlook to 2.9 percent. This report is positive, pointing to another bounce off lows for consumer spirits. Inflation expectations remain very elevated for the one-year outlook, unchanged at 4.6 percent, but they did fall back three tenths for the five-year outlook to 2.9 percent. This report is positive, pointing to another bounce off lows for consumer spirits.
However, the latest retail sales and sentiment reports are a quandary. Consumer spending is up although consumer sentiment is at low levels. One of two possible explanations is that it is consumers with jobs boosting spending and mainly those without jobs keeping sentiment low. Second, spending is likely up on pent up demand as recession delayed purchases are now being made. The good news is that consumers are opening their wallets although high food and energy costs are clouds that could not only worsen spirits but also impact spending.
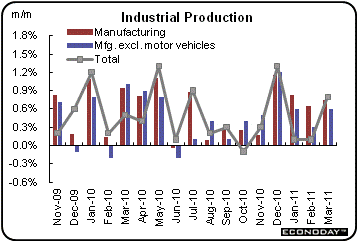 One sector remains quite strong in this recovery—manufacturing. Overall industrial production in March jumped 0.8 percent, following a 0.1 percent uptick the month before. Importantly, manufacturing continued a string of healthy gains, advancing 0.7 percent, following a 0.6 percent boost in February. Manufacturing output has risen nine consecutive months. One sector remains quite strong in this recovery—manufacturing. Overall industrial production in March jumped 0.8 percent, following a 0.1 percent uptick the month before. Importantly, manufacturing continued a string of healthy gains, advancing 0.7 percent, following a 0.6 percent boost in February. Manufacturing output has risen nine consecutive months.
For the latest month, a jump in auto production helped but other manufacturing components also were positive. For other sectors, utilities rebounded 1.7 percent after dropping 3.6 percent in February. Off and on atypical temperatures have caused some recent volatility in utilities output. Mining gained 0.6 percent in March after a 0.3 percent rise the month before.
Within manufacturing, durables advanced 1.0 percent in March, and gains were widespread across its major categories. The output of motor vehicles and parts rose 3.0 percent, following an increase of 4.6 percent in February. Excluding autos, manufacturing rose 0.6 percent in March after a 0.3 percent gain the month before. Also in durables, sizable gains in output also were recorded in the following industries: wood products, fabricated metal products, nonmetallic mineral products, and aerospace and miscellaneous transportation equipment.
Nondurables manufacturing rose 0.5 percent in March. Leading the boost were chemicals and paper.
Overall capacity utilization in March expanded to 77.4 percent from 76.9 percent in February. The March rate came in higher than the market forecast for 77.3 percent.
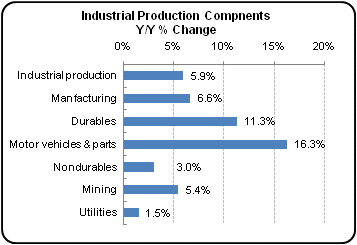 Over the past 12 months, industrial production has been strong with a 5.9 percent gain and with manufacturing up a notable 6.6 percent. Manufacturing has been led by durables (up 11.3 percent) with motor vehicles being particularly robust (up 16.3 percent). Nondurables have been more moderate with a 3.0 percent year-on-year gain. Mining is up 5.4 percent due in part to incentives from higher commodities prices, including for oil. Interestingly, the economy has been more energy efficient. With growth in the overall economy being moderate, utilities output has lagged, rising a mere 1.5 percent over the past twelve months. Over the past 12 months, industrial production has been strong with a 5.9 percent gain and with manufacturing up a notable 6.6 percent. Manufacturing has been led by durables (up 11.3 percent) with motor vehicles being particularly robust (up 16.3 percent). Nondurables have been more moderate with a 3.0 percent year-on-year gain. Mining is up 5.4 percent due in part to incentives from higher commodities prices, including for oil. Interestingly, the economy has been more energy efficient. With growth in the overall economy being moderate, utilities output has lagged, rising a mere 1.5 percent over the past twelve months.
Overall, the manufacturing sector remains robust in March and April is also likely to be a healthy month according to a strengthened Empire State manufacturing report posted this past week.
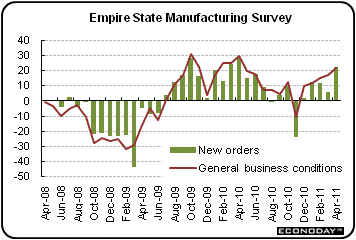 Early reports on manufacturing in April are starting off on the right foot. The New York Fed’s Empire State manufacturing survey printed a headline number of 21.70 for April which was up 4.2 points from the March reading and well over the breakeven point of zero. Early reports on manufacturing in April are starting off on the right foot. The New York Fed’s Empire State manufacturing survey printed a headline number of 21.70 for April which was up 4.2 points from the March reading and well over the breakeven point of zero.
Detail was robust as indexes for the number of employees, shipments, and new orders gained further in positive territory. The new orders index was notably strong, rising 16.53 points on the month to 22.34, the highest reading since March 2010.
On the negative side, indexes for both prices paid and prices received firmed. But overall, this is a quite favorable report for manufacturing.
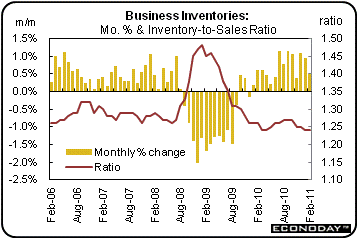 Based on business inventories, forward momentum for manufacturing remains from the need to add to backroom shelves and warehouse stocks. Growth in business inventories slowed in February, to 0.5 percent from January's 1.0 percent. Sales, however, were a little soft, rising only 0.2 percent in the latest month on a 0.8 percent drop in the merchant wholesalers component. Based on business inventories, forward momentum for manufacturing remains from the need to add to backroom shelves and warehouse stocks. Growth in business inventories slowed in February, to 0.5 percent from January's 1.0 percent. Sales, however, were a little soft, rising only 0.2 percent in the latest month on a 0.8 percent drop in the merchant wholesalers component.
But for a broader picture, overall business sales are up a strong 10.9 percent in February on a year-ago basis while inventories have lagged a little with a 9.4 percent boost. Meanwhile, the inventory-to-sales ratio remains very low at 1.24, unchanged from January. The bottom line is that manufacturers are still likely to get healthy orders just to keep restocking inventories. Already, March sales look good at the retail level.
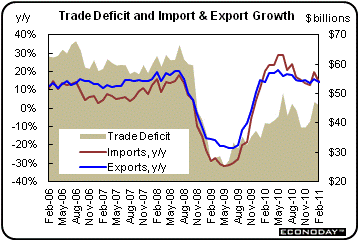 The nation's trade gap narrowed moderately in February, to $45.8 billion from January's $47.0 billion. Despite the shrinkage, February's gap is still on the high end of trend. The nation's trade gap narrowed moderately in February, to $45.8 billion from January's $47.0 billion. Despite the shrinkage, February's gap is still on the high end of trend.
The February narrowing reflected a 1.7 percent drop in imports and a 1.4 percent dip in exports. However, both imports and imports came off very strong increases in January of 5.4 percent and 2.6 percent, respectively.
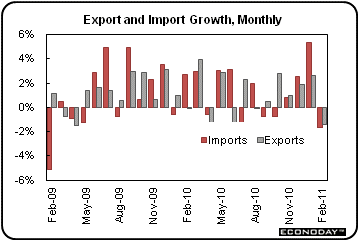 Most of the improvement in the overall deficit was in the petroleum goods gap which narrowed to $25.8 billion from $26.9 billion in January. The non-petroleum goods deficit actually widened to $32.7 billion from $32.3 billion the month before. The services surplus improved $13.6 billion in February from $13.3 the month before. Most of the improvement in the overall deficit was in the petroleum goods gap which narrowed to $25.8 billion from $26.9 billion in January. The non-petroleum goods deficit actually widened to $32.7 billion from $32.3 billion the month before. The services surplus improved $13.6 billion in February from $13.3 the month before.
Within goods, the export side shows declines for autos, industrial supplies and, despite a jump in civilian aircraft, a decline for capital goods exports. On the import side, capital goods dipped as and did auto imports. However, food imports and imports of consumer goods both rose and are at record levels. Imports of capital goods dipped as and did auto imports. Auto imports may become a big issue as the Japanese supplier issue unfolds. However, rebuilding in Japan may lead to strength in U.S. exports.
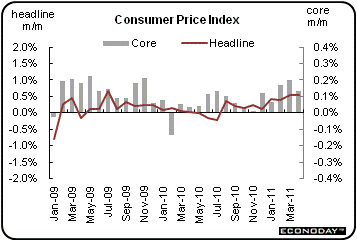 The March CPI report is a tale of two cities—headline is hot while the core is subdued. The consumer price index in March posted a 0.5 percent hike, matching the increase in February. Excluding food and energy, the CPI eased to 0.1 percent, following a 0.2 percent rise and coming in below analysts’ forecast for 0.2 percent. The March CPI report is a tale of two cities—headline is hot while the core is subdued. The consumer price index in March posted a 0.5 percent hike, matching the increase in February. Excluding food and energy, the CPI eased to 0.1 percent, following a 0.2 percent rise and coming in below analysts’ forecast for 0.2 percent.
By major components, energy jumped 3.5 percent after surging 3.4 percent in February. Gasoline increased 5.6 percent, following a 4.7 percent hike in February. Food price inflation worsened to a 0.8 percent gain, following a 0.6 percent boost in February.
The core was softened by a 0.5 percent decline in apparel prices, a 0.1 percent dip in household furnishings, a flat recreation component, and shelter rising only 0.1 percent. On the upside, notable gains were seen in new & used vehicles, up 0.8 percent, and public transportation, up 1.3 percent largely on airline fares.
Year-on-year, overall CPI inflation worsened to 2.7 (seasonally adjusted) from 2.2 percent in February. The core rate rose to 1.2 percent from 1.1 percent on a year-ago basis.
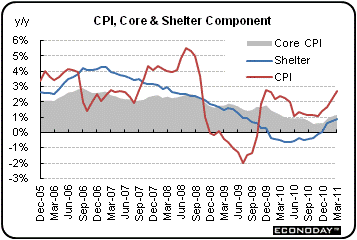
The latest CPI report raises issues for the Fed. The two inflation measures are on opposite sides of the Fed’s implicit inflation target of 1-1/2 to 2 percent on a year-ago basis. If recent increases in food and energy costs are transitory, then perhaps the core is the proper measure for monetary policy—emphasis on perhaps. If these costs continue to rise, then eventually the core rate will follow. The counter argument is that long-term inflation depends more on the direction of wage inflation and currently that is very soft.
The Fed has said that it does not want underlying (read core) inflation to be too low. What often is overlooked is that a huge portion of the core CPI is shelter costs—41.4 percent in the latest reading. The rent and owners’ equivalent rent subcomponents (within shelter) make up 39.9 percent of the core. Some within the Fed have said that one objective of the quantitative easing is to boost inflation back to appropriate rates. This necessarily means that housing must strengthen before the core rate meets this objective. But this raises a technical question—what if non-rent components of the core are accelerating while rent components are still sluggish due to a continuing anemic housing market' The Fed may need to reconsider how it uses the CPI or PCE price index to measure its inflation targets (implicit) at least for this cycle. The bottom line is that this report raises the debate about what counts in making monetary policy.
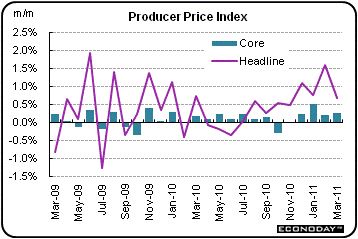 Producer price inflation at the headline level in March remained under heightened upward pressure from higher oil costs. Meanwhile the core was bumped up but not to the same degree. Overall PPI inflation in March eased but came in at a still hot 0.7 percent after surging 1.6 percent in February. Energy led the latest gain while food edged back from a huge surge in February. At the core level, the PPI firmed to a 0.3 percent rise, following a 0.2 percent advance in February. Producer price inflation at the headline level in March remained under heightened upward pressure from higher oil costs. Meanwhile the core was bumped up but not to the same degree. Overall PPI inflation in March eased but came in at a still hot 0.7 percent after surging 1.6 percent in February. Energy led the latest gain while food edged back from a huge surge in February. At the core level, the PPI firmed to a 0.3 percent rise, following a 0.2 percent advance in February.
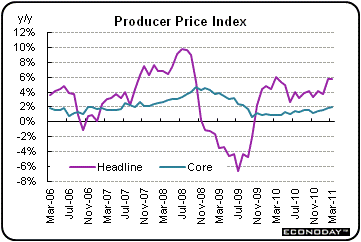 By components, food prices edged back 0.2 percent after surging 3.9 percent in February. Energy continued upward, jumping 2.6 percent, following a 3.3 percent jump in February. About 80 percent of the boost in energy came from a 5.7 percent spike in gasoline, following a 3.7 percent increase in February. Heating oil rose 2.7 percent in the latest month. By components, food prices edged back 0.2 percent after surging 3.9 percent in February. Energy continued upward, jumping 2.6 percent, following a 3.3 percent jump in February. About 80 percent of the boost in energy came from a 5.7 percent spike in gasoline, following a 3.7 percent increase in February. Heating oil rose 2.7 percent in the latest month.
The biggest culprits in the core acceleration were light motor trucks and passenger cars, which rose 0.7 percent and 0.9 percent, respectively.
For the overall PPI, the year-on-year rate in March posted at 5.7 percent, compared to 5.8 percent in February (seasonally adjusted). The core rate rose to 2.0 percent from 1.9 percent the prior month. On a not seasonally adjusted basis for March, the year-ago the headline PPI was up 5.8 percent while the core was up 1.9 percent.
The latest Beige Book reports that the economy is continuing to improve. As has been the case for some time, leading the economy is manufacturing with consumers also contributing. Labor markets are gradually improving. However, higher commodity costs are putting upward pressure on prices. But wage inflation remains subdued.
"Reports from the twelve Federal Reserve Districts indicated that economic activity generally continued to improve since the last report. While many Districts described the improvements as only moderate, most Districts stated that gains were widespread across sectors, and Kansas City described its economic gains as solid. Manufacturing continued to lead, with virtually every District citing examples of steady improvement, often with reports of increased hiring. Retailers in the Boston District reported mixed sales results and retail sales remained weak in the Richmond District, but all other Districts experienced at least slight gains in consumer spending and the New York District cited robust sales. Business services, including freight-related activities, improved in most Districts. Loan demand was either unchanged or up slightly in most Districts, with New York, St. Louis, and Kansas City citing weaker lending. Residential and commercial real estate performance varied across Districts. Seven of the Districts described commercial real estate as slightly improved, while five noted that their markets were flat. While most Districts noted little change in their residential real estate markets, half of the Districts cited at least pockets of weakening.
Importantly, the jobs picture is improving albeit slowly.
"Most Districts reported signs of improvement in at least some of their labor markets and Boston, Richmond, Chicago, and Kansas City cited examples of concern among their contacts about being able to obtain certain types of skilled workers. Some businesses in the Philadelphia and Cleveland Districts still preferred to hire temporary over permanent workers.
For the most part inflation is at the commodity level although price pressures are rising. But labor costs are still sluggish.
"Wage pressures were described by most Districts as weak or subdued, but higher commodity costs were widely reported to be putting increasing pressures on prices. Energy prices were cited most often, but raw materials in general were an increasing concern of businesses. The ability to pass through cost increases varied across Districts, with manufacturers generally finding less resistance to price increases than either retail or construction (where weak demand was a limiting factor)."
Overall, the latest Beige Book shows the recovery continuing. There is ammunition for both the hawks and doves to continue to plead their cases at the April 26-27 FOMC. The economy is growing but has weak spots. There is still slack in labor markets but commodity prices are boosting inflation pressures. And the latest CPI and PPI will add to the debate.
The recovery has grown more entrenched but with the caveat that if energy costs rise further, growth could be at risk. A stabilization of oil prices (or even some retrenchment) is key for healthy economic growth to continue.
Housing takes center stage during the first part of the week with housing starts posting on Tuesday and existing home sales on Wednesday. Thursday, traders check jobless claims to see if last week’s jump was a technicality related to the start of the quarter. The week concludes with a reading on manufacturing on Thursday with the Philly Fed survey. Markets are closed Friday for observance of Good Friday.
Housing starts in February dropped a monthly 22.5 percent after jumping 18.4 percent the prior month. The February annualized pace of 0.479 million units was down 20.8 percent on a year-ago basis. The February reversal was led by a monthly 46.1 percent drop in multifamily starts, following an 87.4 percent surge in January. Also, the single-family component fell 11.8 percent in February after edging up 1.4 percent the prior month. Housing permits declined 8.2 percent in February, following a 10.2 percent decrease in February. Looking ahead, housing starts are notoriously volatile in winter months when seasonal factors are so large and anything can happen coming off those months.
Housing starts Consensus Forecast for March 11: 0.525 million-unit rate
Range: 0.500 million to 0.620 million-unit rate
Existing home sales in February fell 9.6 percent to an annual rate of 4.88 million. Year-on-year, sales are down 2.8 percent. Declines were evenly split between single-family homes and condos and were also evenly split across regions. Supply rose 3.5 percent to 3.488 million homes in what is 8.6 months of supply at the current sales rate, up from 7.5 months in January and even above year-ago February supply of 8.4 months.
Existing home sales Consensus Forecast for March 11: 5.00 million-unit rate
Range: 4.75 to 5.10 million-unit rate
Initial jobless claims jumped 27,000 in the April 9 week to a much higher-than-expected total of 412,000 and the first plus 400,000 reading since early March. The Labor Department said effects tied to the beginning of a quarter may be behind the rise. Supply disruptions tied to Japan were not cited. The four-week average rose 5,500 to 395,750 for its highest reading since mid March.
Jobless Claims Consensus Forecast for 4/16/11: 390,000
Range: 385,000 to 410,000
The Conference Board's index of leading indicators in February jumped 0.8 percent after edging up only 0.1 percent the month before. Strength was in the interest rate spread (10-year T-note less fed funds), which added 0.36 percentage points, and in a drop in unemployment claims, which added 0.33 percentage points to the leading index. Eight of the 10 components were positive. Looking ahead to March, the decline in jobless claims will likely end up a positive as will the rate spread. But with Treasury yields down on flight to safety, the positive contribution will likely be lower than in February. Also, stock prices, a big plus in February, were down slightly according to the S&P500.
Leading indicators Consensus Forecast for March 11: +0.3 percent
Range: +0.1 to +0.5 percent
The general business conditions index of the Philadelphia Fed's Business Outlook Survey jumped 7.5 points to 43.4 in March. This was the strongest reading not only for this recovery but since a 47.0 mark set January 1984. Looking ahead, the April number is likely to be healthy as the March new orders index jumped more than 16.6 points to 40.3, well above zero to indicate month-to-month growth. Also, released this past week, the Empire State index in April jumped 4.2 points to 21.7, suggesting a strengthening in manufacturing in April.
Philadelphia Fed survey Consensus Forecast for April 11: 36.0
Range: 32.0 to 43.8
SIFMA Recommended Early Close 2:00 ET
Good Friday, All Markets Closed, Banks Open
R. Mark Rogers is the author of The Complete Idiot’s Guide to Economic Indicators, Penguin Books, 2009.
Econoday Senior Writer Mark Pender contributed to this article.
|

 BONDS
BONDS