|
Economic news in the U.S. was relatively sparse but markets had a lot to digest. Monetary policy around the world is in transition, geopolitical events continue to make markets nervous, and the U.S. federal government appears headed toward a temporary shutdown. Overall, the economy is holding up relatively well, all considered, but downside risks have risen.
 Equities mostly ended down this past week with a flat Dow being the “winner” among key indexes for the period. But the week started on a positive note with merger activity taking the spotlight. Newmont Mining Corp. made an offer to buy Equinox Minerals while miner Molycorp Inc. separately purchased a European producer. Also lifting stocks was news that General Electric might not be liable for financial damages from Japan’s nuclear crisis. Equities mostly ended down this past week with a flat Dow being the “winner” among key indexes for the period. But the week started on a positive note with merger activity taking the spotlight. Newmont Mining Corp. made an offer to buy Equinox Minerals while miner Molycorp Inc. separately purchased a European producer. Also lifting stocks was news that General Electric might not be liable for financial damages from Japan’s nuclear crisis.
Equities dipped Tuesday with negative sentiment initially coming from overseas after the China raised a key interest rate. Late in the day, stocks were further weighed down by the release of the latest Fed minutes which indicated that the inflation hawks were becoming more concerned about inflation pressures and that the Fed should unwind its loose policy sooner than later. Also, Boeing tugged down on Blue Chips on worries that the company’s 737 airliner could see more problems related to the recent in-flight damage on a Southwest Airlines flight. Also weighing on stocks was a disappointing ISM non-manufacturing report.
Stocks advanced Wednesday largely with techs rising on news that Cisco Systems will sell or spin off its consumer business. Equities were rocked Thursday despite modest improvement in initial jobless claims. A 7.1-magnitude earthquake in Japan sent stocks down. On further stalemate in Libya, oil topped $110 per barrel. And the European Central Bank raised its benchmark rate by a quarter percentage point. Meanwhile, traders were nervous that Congress and the Obama Administration would not avert a shutdown of the federal government on midnight Friday if the debt ceiling were not raised.
Equities fell further the last day of the week on news of no resolution of the federal debt crisis and on crude oil topping $112 per barrel on supply problems from not just Libya but also Nigeria.
Equities were mostly down this past week. The Dow was up a few points, essentially unchanged; the S&P 500, was down 0.3 percent; the Nasdaq, down 0.3 percent; and the Russell 2000, down 0.7 percent.
For the year-to-date, major indexes are up as follows: the Dow, up 6.9 percent; the S&P 500, up 5.6 percent; the Nasdaq, up 4.8 percent; and the Russell 2000, up 7.3 percent.
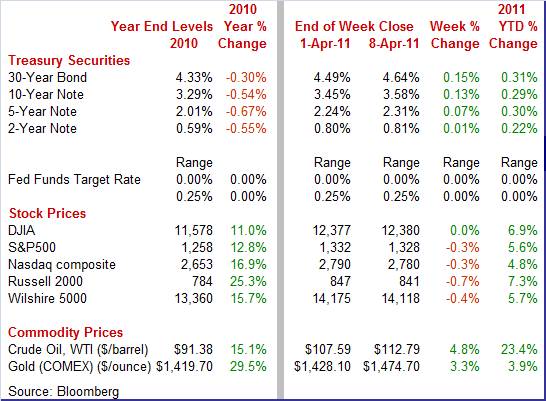
Weekly percent change column reflects percent changes for all components except interest rates. Interest rate changes are reflected in simple differences.
 Treasury yields were notably up except on the short end. There were some minor daily nuances but three key factors were behind the firming in rates. The odds of further quantitative easing have gone down after the Fed’s FOMC minutes indicated increased concern that policy is too loose. This means that there will be fewer buyers of Treasuries in coming months. On a similar note, China and the European Central Bank both raised policy rates. And oil continuing to rise during the week added to inflation concerns. Treasury yields were notably up except on the short end. There were some minor daily nuances but three key factors were behind the firming in rates. The odds of further quantitative easing have gone down after the Fed’s FOMC minutes indicated increased concern that policy is too loose. This means that there will be fewer buyers of Treasuries in coming months. On a similar note, China and the European Central Bank both raised policy rates. And oil continuing to rise during the week added to inflation concerns.
For this past week Treasury rates were mostly up as follows: the 2-year note, up 1 basis point; the 5-year note, up 7 basis points; the 7-year note, up 10 basis points; the 10-year note, up 13 basis points; and the 30-year bond, up 15 basis points. The 3-month T-bill slipped 2 basis points.
 The price of crude surged this past week. It mainly was all about potential supply disruption and a lower dollar. But the spot price of West Texas Intermediate nudged up at the start of the week on a favorable angle—the prior Friday’s employment report indicated healthy demand in the U.S., the world’s largest consumer of crude. The price of crude surged this past week. It mainly was all about potential supply disruption and a lower dollar. But the spot price of West Texas Intermediate nudged up at the start of the week on a favorable angle—the prior Friday’s employment report indicated healthy demand in the U.S., the world’s largest consumer of crude.
The only slippage in price during the week was Tuesday after China raised interest rates and an ISM non-manufacturing report was mildly disappointing.
 Prices rose Wednesday on continued conflict in Libya and further unrest in North Africa and the Middle East. And Nigeria came into play on worries that the pending presidential election on April 16 could lead to violence there and disrupt oil supplies. Crude bumped up more than $1 per barrel Thursday on news that forces loyal to Qaddafi set fire to a key oil field in the country. Prices rose Wednesday on continued conflict in Libya and further unrest in North Africa and the Middle East. And Nigeria came into play on worries that the pending presidential election on April 16 could lead to violence there and disrupt oil supplies. Crude bumped up more than $1 per barrel Thursday on news that forces loyal to Qaddafi set fire to a key oil field in the country.
But crude jumped the most on Friday (up almost $3) on violence in Nigeria and on further strikes by pro-Qaddafi forces on oil fields. Traders have concluded that oil exports from Libya will not resume for some time. Also, throughout the week, a lower dollar has provided upward pressure on crude.
Net for the week, spot prices for West Texas Intermediate surged $5.20 per barrel to settle at $112.79.
It was a relatively quiet week for U.S. economic news. The non-manufacturing sector continued to grow but not as rapidly. Meanwhile, the consumer juggled a split personality—consolidating revolving debt while at the same time boosting auto sales.
 The recovery is still on—but the pace is not even. Growth in the US non-manufacturing sector slowed in March according to the latest ISM report. The composite index eased 2.4 points to 57.3, which is still well above 50 to indicate month-to-month growth. But it is down from February’s 59.7 which is the recovery’s high. The recovery is still on—but the pace is not even. Growth in the US non-manufacturing sector slowed in March according to the latest ISM report. The composite index eased 2.4 points to 57.3, which is still well above 50 to indicate month-to-month growth. But it is down from February’s 59.7 which is the recovery’s high.
Slowing was especially pronounced in output as indicated by the business activity index which declined 7.2 points to 59.7, again above 50 to indicate growth but below February's rate of growth.
The slowing in production growth has moderated hiring plans as the employment index slipped 1.9 points to 53.7, not much above breakeven and indicating only modest growth for employment.
Despite moderation in overall growth—which is still a nice contrast to outright decline in activity—the outlook is still good. The new orders index also moderated yet very slightly, down three tenths to 64.1 which nevertheless represents a second straight month of slowing. But this pace is still somewhat high, indicating a healthy rate of growth for orders. Backlogs are up, posting at 56.0 in March, up 4.0 points from February.
The big negative is on the inflation front. Price inputs remain severely elevated but a little less severely than February.
 Consumer credit outstanding posted a nice gain in February but it was due to selective purchases rather than a spending binge. And the details show that the consumer continues to rebuild household balance sheets where it had serious deficiencies—charge card debt. A broader view, however, shows mortgage debt remaining a problem area for many. Consumer credit outstanding posted a nice gain in February but it was due to selective purchases rather than a spending binge. And the details show that the consumer continues to rebuild household balance sheets where it had serious deficiencies—charge card debt. A broader view, however, shows mortgage debt remaining a problem area for many.
Overall consumer credit outstanding expanded $7.6 billion in February, following a $4.4 billion gain the month before. This measure of short-term debt, however, was boosted entirely by surge in non-revolving credit which jumped $10.3 billion, reflecting a jump in motor vehicle purchases.
 Partially offsetting was a $2.7 billion decline in revolving debt, following a $3.9 billion drop in January. Consumers appear to be more cautious about purchase decisions—likely rationally replacing the aging auto fleet (with the average age bumped up during the recession as purchases were put off). But more mundane purchases are more likely to be made with cash and consumers are paying down credit card balances. Given the recently favorable chain store sales numbers, the softness in revolving credit is less of a reluctance to spend but more of a preference to improve household balance sheets. Partially offsetting was a $2.7 billion decline in revolving debt, following a $3.9 billion drop in January. Consumers appear to be more cautious about purchase decisions—likely rationally replacing the aging auto fleet (with the average age bumped up during the recession as purchases were put off). But more mundane purchases are more likely to be made with cash and consumers are paying down credit card balances. Given the recently favorable chain store sales numbers, the softness in revolving credit is less of a reluctance to spend but more of a preference to improve household balance sheets.
 Other measures provide a broader picture of how well or not the consumer is improving household balance sheets. One data difficulty about the consumer credit outstanding data is that one does not know how much of the decline in revolving debt is from pay down and how much is from charge offs of bad debt by banks. Other measures provide a broader picture of how well or not the consumer is improving household balance sheets. One data difficulty about the consumer credit outstanding data is that one does not know how much of the decline in revolving debt is from pay down and how much is from charge offs of bad debt by banks.
 On this issue, there is good news and bad news. The bad news is that the charge off rate on consumer loans is high while the good news is that it has come down from the cycle high. The charge off rate stood at 5.1 percent in the fourth quarter of 2010—well above the pre-recession low of 1.8 percent at the start of 2006. But it is down from the cycle high of 6.6 percent in the second quarter of 2010. So, there has been improvement. On this issue, there is good news and bad news. The bad news is that the charge off rate on consumer loans is high while the good news is that it has come down from the cycle high. The charge off rate stood at 5.1 percent in the fourth quarter of 2010—well above the pre-recession low of 1.8 percent at the start of 2006. But it is down from the cycle high of 6.6 percent in the second quarter of 2010. So, there has been improvement.
Another area of progress has been in credit card delinquency rates. One-month delinquency rates are down to 4.1 percent in December 2010 from a recent high of 6.2 percent in March 2009. The 3-month rate has eased to 2.2 percent in December from the cycle high of 3.2 percent most recently seen in February of last year. So, it appears that the consumer is making progress strengthening household balance sheets in terms of credit card debt, and enough consumers feel secure about their jobs to boost auto sales. However, consumer credit outstanding does not include mortgage debt and that is one area showing little progress.
Households with unemployment or underemployment problems and/or are in severely depressed housing markets are still struggling to make payments on mortgages. Or are still deciding to “walk away” or not. For commercial banks the delinquency rate on residential real estate was a still whopping high 10.6 percent in the final quarter of 2010. While this is down from the recent high of 11.0 percent in the first quarter of last year, it is still dramatically above the more typical 2 percent vicinity before the recent recession.
Overall, most consumers are making progress—albeit slowly—in improving balance sheets. While this apparent new conservatism about spending is restraining the recovery relative to past patterns, it also likely means that the recovery for now is less susceptible to reversal from the consumer sector. That is, the spending pattern may be more stable. But balance sheets are still a problem for the unemployed and for some of those in very weak housing markets.
The minutes of the Fed’s March 15 policy meeting show moderate disagreement regarding quantitative easing. The bottom line is that the Fed is not likely to change QE2 but is starting to think about its exit strategy from a very loose monetary policy. Timing will depend on incoming data.
A few FOMC participants believed policy might need to be tightened later this year with QE2 being cut short. A few others believed that “exceptional accommodation” might be needed beyond 2011. Some doubted the benefits of QE2 but believed it not appropriate to change the announced plan for QE2.
Overall, the FOMC sees the recovery as gaining traction. “Participants' judgment that the recovery was gaining traction reflected both the incoming economic indicators and information received from business contacts.” But there are increased risks seen coming from higher commodity prices, turmoil in North Africa and the Middle East, and the problems in Japan. Most see higher commodity prices as having a transitory effect and inflation expectations appear to be stable for now. But inflation expectations have taken on a bigger role in policy debate.
The Board’s staff economists revised down their GDP forecast for 2011 but not by much.
The apparent direction of increased disagreement within the Fed was highlighted by differences in Fed speakers just this week. Atlanta Fed President Dennis Lockhart characterized the economy as still fragile and the impact of higher commodities as transitory. In contrast, Dallas Fed President Richard Fisher said that the Fed may need to curtail the second round of quantitative easing and that it certainly should not be extended beyond June. The Dallas Fed president indicated that global inflation is gaining and that there is the risk that the Fed will be perceived as monetizing U.S. debt. Overall, the Fed’s anti-inflation hawks are becoming more vocal and may have more impact on policy.
The economy continues to have forward momentum with not just manufacturing gaining but also non-manufacturing. And a mixed consumer sector continues to support the recovery although at a cyclically moderate pace due to continued high unemployment and restructuring of household balance sheets. But for the long-term, the consumer sector is becoming financially healthier. Meanwhile, the Fed is trying to anticipate when to move toward a neutral policy position and then whether to adopt a tight stance.
At time of publication, no agreement had been reached on federal debt ceiling legislation. Release of government-produced indicators is contingent upon enactment of at least a temporary lifting of the federal debt ceiling. That is, if the federal government shuts down, federal government produced indicators will not be released as scheduled.
The heavy hitters start Tuesday with international trade, followed by retail trade on Wednesday. A check on the impact of higher energy costs starts with the PPI on Thursday with a reading at the consumer level on Friday with the CPI. The week finishes with industrial production and consumer sentiment.
The U.S. international trade gap in January widened to $46.3 billion from a revised $40.3 billion shortfall in December. The expansion of the trade deficit was led by the nonpetroleum goods gap which grew to $32.0 billion from $27.0 billion in December. The petroleum shortfall widened moderately to $26.7 billion from $25.5 billion the prior month. Exports of goods and services gained 2.7 percent, following a 2.0 percent boost the prior month. Imports posted a huge 5.2 percent increase after rising 2.6 percent in December.
International trade balance Consensus Forecast for February 11: -$44.0 billion
Range: -$47.5 billion to -$41.9 billion
The U.S. Treasury monthly budget report showed a seasonal worsening in the deficit in February to $222.5 billion from a shortfall of $49.8 billion in January. Five months into the 2011 fiscal year, the government's deficit stands at $641.3 billion. February's gap of $222.5 billion was slightly larger than the $220.9 billion gap in February last year. There are no special factors in the February data. Looking ahead, the month of March typically shows a deficit for the month. Over the past 10 years, the average deficit for the month of March has been $77.5 billion and $98.6 billion over the past 5 years. The March 2010 deficit came in at $65.4 billion.
Treasury Statement Consensus Forecast for March 11: -$189.0 billion
Range: -$190.0 billion to -$189.0 billion.
Retail sales in February surged 1.0 percent, following a 0.7 percent boost in January and a 0.6 percent increase in December. Autos led the headline number up, jumping 2.3 percent, following a 1.2 percent gain in January. Excluding autos, sales advanced 0.7 percent, following a 0.6 percent gain in January. A notable part of this increase was price related on higher gasoline prices. Gasoline sales were up 1.4 percent after a 1.3 percent boost the month before. Nonetheless, sales excluding autos and gasoline improved a strong 0.6 percent, following a 0.5 percent rise in January.
Retail sales Consensus Forecast for March 11: +0.5 percent
Range: 0.0 to +1.2 percent
Retail sales excluding motor vehicles Consensus Forecast for March 11: +0.7 percent
Range: +0.2 to +1.8 percent
Business inventories in January jumped 0.9 percent to make a strong start for the first quarter. More notable, business sales surged 2.0 percent in January to pull down the stock-to-sales ratio by two tenths to 1.23. This indicates that inventories are still too low.
Business inventories Consensus Forecast for February 11: +0.8 percent
Range: +0.7 to +1.1 percent
The Beige Book being prepared for the April 26-27 meeting is released this afternoon. With Fed speakers raising the volume on policy differences, markets will likely be sensitive to the latest reading of anecdotal economic news from the District Banks’ contacts.
The producer price index in February jumped a strong 1.6 percent, following a January boost of 0.8 percent. However, at the core level, the PPI slowed to a 0.2 percent rise after jumping 0.5 percent in January. By components, food prices surged 3.9 percent, after a 0.3 percent rise in January. The energy component remained under strong upward pressure, gaining 3.3 percent after jumping 1.8 percent in January.
PPI Consensus Forecast for March 11: +1.0 percent
Range: +0.4 to +1.6 percent
PPI ex food & energy Consensus Forecast for March 11: +0.2 percent
Range: +0.1 to +0.4 percent
Initial jobless claims for the April 2 week fell 10,000 to 382,000 from 392,000 in the prior week (revised from 388,000). The four-week average of 389,500 is down more than 5,000 from a month ago. Continuing claims edged lower in the March 26 week, to a four-week average of 3.746 million with the month-ago comparison showing a 100,000 decline.
Jobless Claims Consensus Forecast for 4/9/11: 380,000
Range: 375,000 to 385,000
The consumer price index in February jumped 0.5 percent, following a 0.4 percent boost in January. Excluding food and energy, CPI inflation increased 0.2 percent, matching the rise in the prior month. Although the overall CPI was led upward by energy, food also played a major role. Energy surged 3.4 percent in February after increasing 2.1 percent in January. Food price inflation remained strong with a 0.6 percent increase, following a 0.5 percent gain in January. The core was led up by new vehicles, medical care, and airline fares. On the soft side was shelter which edged up marginally. The apparel index was one of the few to decline.
CPI Consensus Forecast for March 11: +0.5 percent
Range: +0.3 to +0.5 percent
CPI ex food & energy Consensus Forecast for March 11: +0.2 percent
Range: +0.1 to +0.2 percent
The Empire State manufacturing index in March rose 2.07 points to 17.50 for a reading well above breakeven zero and suggesting a mild month-to-month acceleration in growth. However, indexes for new orders, shipments, and inventories all eased compared to February but remained in positive territory, indicating slowing but still growing activity. The index for new orders slowed to 5.81 from 11.80 in February.
Empire State Manufacturing Survey Consensus Forecast for April 11: 17.5
Range: 8.0 to 21.1
Industrial production in February slipped 0.1 percent, following a 0.3 percent gain the prior month. The dip in February was led by a 4.2 percent drop in utilities output, following a 4.5 percent decrease the month before. Utilities were down on atypically warm weather for the month. In contrast, manufacturing output posted a 0.4 percent gain after a 0.9 percent surge in January. Mining output rebounded 0.8 percent, following a 0.7 percent decline in January. Total capacity utilization in February edged down to 76.3 percent from 76.4 percent the prior month. Looking ahead, the manufacturing component of industrial production should be moderately healthy. Recent manufacturing surveys show activity remaining moderately positive. Also, the index of production worker hours from the employment situation rose 0.5 percent in March.
Industrial production Consensus Forecast for March 11: +0.6 percent
Range: +0.4 to +0.9 percent
Capacity utilization Consensus Forecast for March 11: 77.3 percent
Range: 76.7 to 77.6 percent
The Reuter's/University of Michigan's Consumer sentiment index for the final March reading came in at 67.5, compared to 68.2 at mid-month which implies a 66.8 reading in the second half of the month. For the final reading for the month, March is down a sharp 10 points from February’s reading of 77.5. Expectations, the leading component of the index, sagged in the final reading of March to 57.9 from a mid-month 58.3. Current conditions fell a little more than one point to 82.5.
Consumer sentiment Consensus Forecast for preliminary April 11: 69.0
Range: 65.0 to 71.5
R. Mark Rogers is the author of The Complete Idiot’s Guide to Economic Indicators, Penguin Books, 2009.
Econoday Senior Writer Mark Pender contributed to this article.
|
