|
The employment report is a key marker of the health of the consumer sector and the latest release shows progress. However, there are soft spots. And the consumer—despite recently strong spending numbers—is wary about the future.
 Equities posted solid gains for the week despite mixed economic news and ongoing geopolitical concerns. Equities posted solid gains for the week despite mixed economic news and ongoing geopolitical concerns.
At the open of the week, equities headed down despite somewhat better than expected pending home sales and strong personal spending numbers. Hotelier Marriott led the consumer sector down and broad indexes after an announcement that revenue growth is being damped by weak demand in North America. Concern about Japan’s damaged nuclear power plant also weighed on stocks.
On Tuesday, stocks posted notable gains even though home prices declined along with consumer confidence. Amazon boosted techs on the introduction of its Cloud Music service, beating rivals Apple and Google to the punch. Home Depot lifted consumer stocks as it sold bonds to finance buybacks. At midweek, positive results from the ADP employment report put traders in a bullish mood, bumping equities up.
 But equities were mixed on Thursday as Blue Chips slipped and techs and small caps rose slightly. Initial jobless claims dipped for the latest week but the prior week was revised up. Essentially, it was a quiet day of trading ahead of the Friday jobs report. But equities were mixed on Thursday as Blue Chips slipped and techs and small caps rose slightly. Initial jobless claims dipped for the latest week but the prior week was revised up. Essentially, it was a quiet day of trading ahead of the Friday jobs report.
Equities rose moderately on the last day of trading as many took the view that the March employment situation was relatively strong and topped expectations—even though the strength is debatable. Gains eased late in the day as funds that track the S&P 500 Index sold to raise money to purchase shares of BlackRock that was added to the index after the close of trading.
Equities were up this past week. The Dow was up 1.3 percent; the S&P 500, up 1.4 percent; the Nasdaq, up 1.7 percent; and the Russell 2000, up 2.8 percent.
For the month of March, major indexes are mixed as follows: the Dow, up 0.8 percent; the S&P 500, down 0.1 percent; the Nasdaq, down negligibly but essentially flat; and the Russell 2000, up 2.4 percent.
For the first quarter, major indexes are up as follows: the Dow, up 6.4 percent; the S&P 500, up 5.4 percent; the Nasdaq, up 4.8 percent; and the Russell 2000, up 7.6 percent.
For the year-to-date, major indexes are up as follows: the Dow, up 6.9 percent; the S&P 500, up 5.9 percent; the Nasdaq, up 5.2 percent; and the Russell 2000, up 8.1 percent.
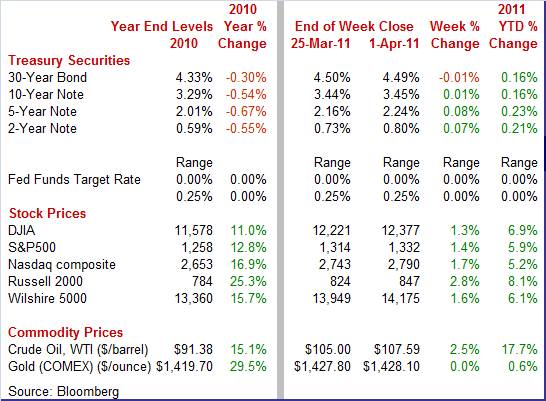
Weekly percent change column reflects percent changes for all components except interest rates. Interest rate changes are reflected in simple differences.
 Rates were little changed at the start of the week as better-than-expected pending home sales were partially offset by a mixed report on personal income. Despite disappointing news, rates rose on Tuesday after St. Louis Fed President James Bullard stated that the Fed may need to trim QE2 by $100 billion. Rates were little changed at the start of the week as better-than-expected pending home sales were partially offset by a mixed report on personal income. Despite disappointing news, rates rose on Tuesday after St. Louis Fed President James Bullard stated that the Fed may need to trim QE2 by $100 billion.
 At midweek, Treasury yields eased even though ADP employment was relatively healthy. The dip was in response to a favorable auction for 7-year notes. At midweek, Treasury yields eased even though ADP employment was relatively healthy. The dip was in response to a favorable auction for 7-year notes.
Rates firmed Thursday on a dip in initial jobless claims and on the belief that the Friday employment situation report would be healthy. But on Friday, yields eased slightly after New York Fed President William Dudley described the U.S. recovery as “still tenuous.” Earlier in the day, many analysts had interpreted the March employment report as strong—though some see weak spots.
For this past week Treasury rates were mostly up as follows: the 2-year note, up 7 basis points; the 5-year note, up 8 basis points; the 7-year note, up 6 basis points; and the 10-year note, up 1 basis point. The 3-month T-bill slipped 2 basis points while the 30-year bond edged down 1 basis point.
 Crude ended the week notably higher but the week started in the other direction. Reports that anti-Gaddafi forces recaptured key oil ports sent oil about $2 lower on Monday. Crude ended the week notably higher but the week started in the other direction. Reports that anti-Gaddafi forces recaptured key oil ports sent oil about $2 lower on Monday.
The big jump during the week was on Thursday. The primary reason was reversals for Libyan rebels. Also, a decline in the dollar (about 0.6 percent against the euro) provided upward pressure on crude on speculation the European Central Bank is preparing to raise interest rates to fend off rising inflation.
The spot price for West Texas Intermediate hit a 30-month high after the March payroll numbers came in above expectations and the conflict in Libya worsened.
Net for the week, spot prices for West Texas Intermediate increased $2.59 per barrel to settle at $107.59.
The consumer sector is moving forward but with uneven progress. The latest employment situation has pluses and minuses. And despite strong spending numbers, the consumer is nervous about the health of the economy. No surprise—the housing sector is still anemic and apparently losing some of its earlier gains in the recovery. At least manufacturing is continuing to grow—but not as rapidly as in recent months.
 The latest employment report looked moderately healthy at the headline level but there clearly are some weak spots. Overall payroll employment in March gained 216,000, following a revised 194,000 increase in February and a 68,000 rise in January. The January and February revisions were up net 7,000. Private nonfarm payrolls posted a 230,000 increase in March, following a 240,000 rise in February. The latest employment report looked moderately healthy at the headline level but there clearly are some weak spots. Overall payroll employment in March gained 216,000, following a revised 194,000 increase in February and a 68,000 rise in January. The January and February revisions were up net 7,000. Private nonfarm payrolls posted a 230,000 increase in March, following a 240,000 rise in February.
By major sectors, job gains were seen in both goods-producing and service-providing sectors. Goods-producing jobs advanced 31,000, following a 73,000 boost in February. For the latest month, manufacturing jobs grew 17,000 after a 32,000 gain in February. However, construction employment dipped 1,000, following a 37,000 boost the prior month. Mining jumped 14,000 in March.
Private service-providing jobs increased 199,000 after a 167,000 rise in February. Health care rose 44,500, temp help gained 28,800, leisure & hospitality increased 37,000, and retail rose 17,700.
Government jobs fell 14,000, following a 46,000 drop in February. For the latest month, state & local government declined 15,000 with 9,200 in local government education.
The biggest negative in the employment report was for wages. The earnings picture in March is disappointing as average hourly earnings for all workers were flat, matching February. On a year-ago basis, wages were up only 1.7 percent, equaling the February pace. Earnings clearly are lagging headline inflation.
Another disappointment was the average workweek for all workers which posted at 34.3 hours and showing no improvement from February.
Turning to the household survey, the unemployment rate edged down to 8.8 percent in March from 8.9 percent the month before.
Looking ahead, the wages and salaries component of personal income is likely to be soft as private weekly aggregate earnings rose a modest 0.2 percent in March. Production worker hours in manufacturing advanced 0.5 percent, suggesting a strong gain in the manufacturing component of industrial production for March
The March employment report is mixed. The job numbers are moderately good—for this recovery. But they are still soft relative to typical recoveries. And average hourly earnings point to sluggishness in the labor market. The labor market is improving net, but very slowly. And consumers’ wallets are falling behind inflation—at least for now.
 Despite problems with confidence readings, the consumer sector is holding up reasonably well by other key measures for income and spending. First, personal income in February advanced 0.3 percent, following a 1.2 percent advance the prior month. Wages & salaries gained a moderately healthy 0.3 percent, matching the rise in January. Despite problems with confidence readings, the consumer sector is holding up reasonably well by other key measures for income and spending. First, personal income in February advanced 0.3 percent, following a 1.2 percent advance the prior month. Wages & salaries gained a moderately healthy 0.3 percent, matching the rise in January.
As in recent months, consumer spending in February was led by auto sales and higher gasoline prices. Personal consumption expenditures jumped 0.7 percent, following a 0.3 percent rise in January.

For PCEs in February, strength was led by durables, up 1.6 percent while nondurables (includes gasoline) was up a robust 1.4 percent. Services spending nudged up 0.2 percent.
But consumers are worrying that income gains are being eroded by higher food and energy costs. On the inflation front, the PCE price index increased a notably warm 0.4 percent, topping the 0.3 percent boost in January. For the latest month, food prices jumped 0.8 percent while energy surged a monthly 3.5 percent. The core rate gained 0.2 percent in February, matching the prior month’s pace.
 On a year-ago basis, headline PCE prices are up 1.6 percent in February—up notably from 1.2 percent the month before. Core inflation nudged up to a 0.9 percent year-on-year pace versus 0.8 percent in January. On a year-ago basis, headline PCE prices are up 1.6 percent in February—up notably from 1.2 percent the month before. Core inflation nudged up to a 0.9 percent year-on-year pace versus 0.8 percent in January.
But even with the high inflation numbers for February, real spending still gained 0.3 percent, following no change in January. But real disposable income slipped 0.1 percent in February after a 0.5 percent boost the month before.
Overall, the consumer sector in some key measures is doing fine other than the worry about inflation eroding spending power. Income and spending over the last two months both have been relatively strong. But for the consumer sector to keep contributing to lifting the recovery, inflation is going to have to soften and/or income will need to pick up the pace—which is not likely until employment strengthens.
 The consumer is being rattled by not just economic factors but by geopolitical events. The Conference Board's composite index fell 8.6 points to 63.4, erasing two months of improvement. As recently as a month ago, it appeared that confidence was on a strengthening trend. Ongoing uncertainties in Libya and the Middle East continue to pressure oil prices and are beginning to make consumers nervous. The consumer is being rattled by not just economic factors but by geopolitical events. The Conference Board's composite index fell 8.6 points to 63.4, erasing two months of improvement. As recently as a month ago, it appeared that confidence was on a strengthening trend. Ongoing uncertainties in Libya and the Middle East continue to pressure oil prices and are beginning to make consumers nervous.
In terms of pocketbook issues, consumers are worrying about higher inflation eroding spending power and there is continuing concern about difficulty obtaining jobs. Inflation expectations for one year out jumped to 6.7 percent from 5.6 percent in February. High food and especially high gas prices are behind the heightened inflation expectations. Income worries are up as those seeing their income falling over the next six months now equal those seeing an increase, a shift lower from three prior months when optimists had outnumbered pessimists.
While there has been modest improvement in actual job numbers, the gains have been too small for most consumers to have noticed. Specifically, the assessment of the jobs market is deteriorating. Those saying jobs are currently hard to get rose two tenths to 44.6 percent. For the six-month view on jobs, pessimists are once again outnumbering optimists.
Currently, consumer income and spending are doing better than consumers say they feel. But prolonged gloominess on the consumers’ part could turn to reality in terms of spending unless the jobs picture improves.
 A strong point for the consumer sector has been auto sales. The pace eased a bit in March but remained robust. Combined domestic and import light vehicle sales posted at 13.1 million units annualized—down 2.4 percent from 13.4 million units the prior month. The dip was attributed to simply coming off a strong pace and due to an easing in manufacturer incentives during March. Sales of light trucks slowed to a 6.1 million annual rate from 6.6 million in February. Meanwhile, autos actually rose to 7.0 million units annualized from 6.8 million the month before. Truck sales may be slowing in part as a result of higher gasoline prices. A strong point for the consumer sector has been auto sales. The pace eased a bit in March but remained robust. Combined domestic and import light vehicle sales posted at 13.1 million units annualized—down 2.4 percent from 13.4 million units the prior month. The dip was attributed to simply coming off a strong pace and due to an easing in manufacturer incentives during March. Sales of light trucks slowed to a 6.1 million annual rate from 6.6 million in February. Meanwhile, autos actually rose to 7.0 million units annualized from 6.8 million the month before. Truck sales may be slowing in part as a result of higher gasoline prices.
Total domestic units sold slipped 3.3 percent to 9.9 million units while imports edged up 0.4 percent to 3.2 million units.
Overall, consumers—at least those with jobs—are feeling confident enough to take on a new car note. Also, apparently the aging of the auto fleet during the recession helped bump up pent up demand.
 Pending sales for existing home rose 2.1 percent in February after declining 2.8 percent the month before. However, the level of activity is still weak with the year-ago pace at down 8.2 percent. Pending sales for existing home rose 2.1 percent in February after declining 2.8 percent the month before. However, the level of activity is still weak with the year-ago pace at down 8.2 percent.
February's gain would have been higher if not for a steep 10.9 percent monthly decline in the Northeast which the National Association of Realtors said may be weather related.
Despite the slow start, the National Association of Realtors (which produces the data for pending and existing home sales) sees sales of existing homes picking up steam to an annual rate of 5.268 million for a solid 7.4 percent annual gain. There are signs that there may be improvement ahead for existing home sales. Mortgage Bankers Association’s data on home purchase applications have been picking up which, together with this report, are positive indications for March existing home sales.
 The rate of decline is slower, but the direction is still in the wrong direction—down. The Case-Shiller home price index for January (10-city composite) showed a 0.2 percent decline, following December's 0.4 percent decrease and a series of sharper contractions. But the adjusted series does show a deepening in the year-on-year decline, to minus 2.0 percent from minus 1.3 percent in December, minus 0.5 percent in November and positive comparisons in the prior months. The rate of decline is slower, but the direction is still in the wrong direction—down. The Case-Shiller home price index for January (10-city composite) showed a 0.2 percent decline, following December's 0.4 percent decrease and a series of sharper contractions. But the adjusted series does show a deepening in the year-on-year decline, to minus 2.0 percent from minus 1.3 percent in December, minus 0.5 percent in November and positive comparisons in the prior months.
Basically, weak demand—as indicated by anemic sales of both new and existing homes—and heavy supply are bumping prices down. A little more than half of the 20 cities sampled show continuing monthly declines. Year-on-year, declines for Phoenix, Detroit, Portland, Minneapolis and Chicago are in the high single digits.
 New orders, export orders and backlog orders slowed during March in an otherwise solid ISM manufacturing report. The composite headline index, which got a big lift from a slowing in supplier deliveries and from continued strength in production and employment, edged back only two tenths to a still very strong 61.2 that indicates month-to-month growth in overall activity at roughly the same level as February. New orders, export orders and backlog orders slowed during March in an otherwise solid ISM manufacturing report. The composite headline index, which got a big lift from a slowing in supplier deliveries and from continued strength in production and employment, edged back only two tenths to a still very strong 61.2 that indicates month-to-month growth in overall activity at roughly the same level as February.
But the order data show significant slowing in the rate of monthly increase in a hint that manufacturing momentum, or at least that of ISM's sample, may have peaked in February. Input prices remain severely elevated but are not likely to be distorting the ISM's data which are based on volume, not dollar totals. On the Japanese situation, the ISM said it's still too early to see any impact which it suspects will ultimately be centered in technology and autos.
The recovery continues though with more question marks this month than one or two months ago. The consumer sector is making spotty progress while manufacturing moves forward and housing takes another step back.
Tuesday’s release of the ISM non-manufacturing survey will indicate whether this sector is catching up with manufacturing. Later in the day, the Fed’s FOMC meeting minutes are released with bond traders paying close attention to whether there are hints that QE2 is likely to be cut short. And there is a checkup on the consumer sector with Thursday’s initial jobless claims and consumer credit reports.
The composite index from the ISM non-manufacturing survey firmed to 59.7 in February from 59.4 the prior month. The latest is the strongest reading since 61.3 seen for August 2005 and indicates that the bulk of the economy is accelerating. February's strength in the composite index was centered in the business activity component (akin to a production reading on the manufacturing side) and in employment which came in at 55.6 for a more than one point gain and the best reading of the recovery. The March composite is likely to be solid as the new orders indexes for February and January were quite strong.
ISM non-manufacturing composite index Consensus Forecast for March 11: 59.7
Range: 57.7 to 68.8
The Minutes of the March 15 FOMC meeting are scheduled for release at 2:00 p.m. ET. While the policy decision on rates was not a surprise, the internal debate at the Fed on whether to complete QE2 is heating up and the minutes may give more inside on potential divisions on this issue.
Initial jobless claims in the March 26 week declined 6,000 to 388,000. The latest four-week average with a 3,250 increase to 394,250 was little changed. Continuing claims fell 51,000 in data for the March 19 week although it is likely that a sizeable portion of the decline is due to expiration of benefits.
Jobless Claims Consensus Forecast for 4/2/11: 385,000
Range: 380,000 to 390,000
Consumer credit outstanding rose $5.0 billion in January, following a $4.1 billion gain the prior month. The latest increase was entirely from the nonrevolving component which surged $9.3 billion in January following December's $2.1 billion gain. This component largely reflects financing for motor vehicles. Revolving credit failed to post a second month of improvement, contracting $4.2 billion in January following December's $2.0 billion gain. This category is largely credit card debt. Looking ahead, at least the nonrevolving component should post a gain as unit new motor vehicle sales in February surged a monthly 6.4 percent.
Consumer credit Consensus Forecast for February 11: +$5.0 billion
Range: -$2.0 billion to +$5.5 billion
R. Mark Rogers is the author of The Complete Idiot’s Guide to Economic Indicators, Penguin Books, 2009.
Econoday Senior Writer Mark Pender contributed to this article.
|
