|
This week, the economic news was mostly negative—especially for housing. In fact, the brief recovery for housing appears to have turned into another recession for this sector, albeit a less dramatic one. Also, global events remain notable risks to a strengthening in the recovery. Meanwhile, corporate earnings remain healthy.
 Equities posted a sizeable comeback this past week despite headwinds from disappointing economic news and ongoing events in Japan, North Africa, and the Middle East. Basically, the negative economic and geopolitical news was not too negative and the overall earnings picture continued to improve. Equities posted a sizeable comeback this past week despite headwinds from disappointing economic news and ongoing events in Japan, North Africa, and the Middle East. Basically, the negative economic and geopolitical news was not too negative and the overall earnings picture continued to improve.
At the start of the week, merger activity boosted stocks as AT&T agreed to buy T-Mobile USA, pending regulatory approval. Insurers AIG and Hartford Financial Services Group led financials upward while reports said Japan was making progress in restoring power to two damaged reactors. And higher oil prices lifted the energy patch. Stocks rose significantly despite a sharp drop in existing home sales.
On Tuesday, equities edged down as European debt problems resurfaced regarding Portugal’s willingness to stick with a deficit-cutting plan. The consumer sector was tugged down after a profit forecast from drugstore chain Walgreen fell short of expectations and after cruise line Carnival projected disappointing profits. Also weighing on stocks was concern about the continued conflict between pro- and anti-Qaddafi forces and also continuing violence in the Middle East. Equities posted modest gains at mid-week, primarily on higher metals prices boosting commodity producers and despite a huge fall in new home sales.
Thursday, the durables report showed new orders unexpectedly declining but traders focused on a surprise dip in initial unemployment claims. Equities gained—especially in the tech sector after Linux vendor Red Hat reported outstanding earnings and boosted its forecast. Micron Technologies also beat estimates.
At week’s close, corporate news again beat economic news. Although fourth quarter GDP was revised up slightly more than expected, consumer sentiment plunged more than estimated. But forecasts from Oracle and Accenture topped estimates and boosted stocks overall.
Equities were up significantly this past week. The Dow was up 3.1 percent; the S&P 500, up 2.7 percent; the Nasdaq, up 3.8 percent; and the Russell 2000, up 3.7 percent.
For the year-to-date, major indexes are up as follows: the Dow, up 5.6 percent; the S&P 500, up 4.5 percent; the Nasdaq, up 3.4 percent; and the Russell 2000, up 5.1 percent.
Weekly percent change column reflects percent changes for all components except interest rates. Interest rate changes are reflected in simple differences.
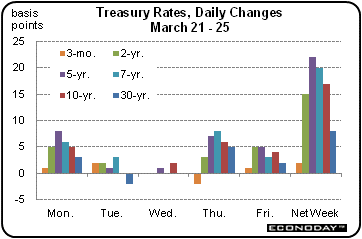 Treasury rates headed up and it was all about looking for higher yields and worrying about pending moves in monetary policy. Rates had fallen sharply the prior week on flight to safety. Without a doubt, this week geopolitical concerns remained and rates were still low. But the situations in North Africa and the Middle East appeared no worse. Treasury rates headed up and it was all about looking for higher yields and worrying about pending moves in monetary policy. Rates had fallen sharply the prior week on flight to safety. Without a doubt, this week geopolitical concerns remained and rates were still low. But the situations in North Africa and the Middle East appeared no worse.
 Importantly, corporate earnings were looking good and equities were rising, so essentially funds flowed out of Treasuries and into stocks. Finally, comments from central bankers overseas and in the U.S. indicated that higher policy rates are coming. Importantly, corporate earnings were looking good and equities were rising, so essentially funds flowed out of Treasuries and into stocks. Finally, comments from central bankers overseas and in the U.S. indicated that higher policy rates are coming.
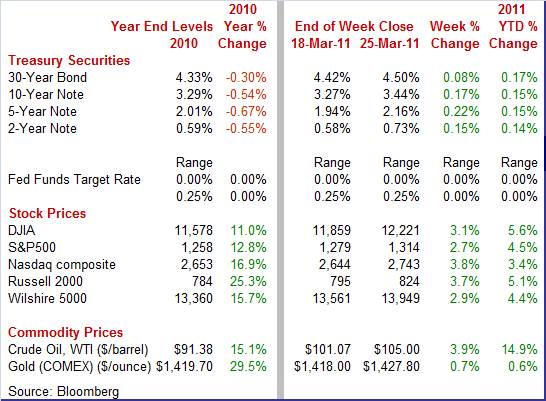
For this past week Treasury rates were up as follows: 3-month T-bill, up 2 basis points; the 2-year note, up 15 basis points; the 5-year note, up 22 basis points; the 7-year note, up 20 basis points; the 10-year note, up 17 basis points; and the 30-year bond, up 8 basis points.
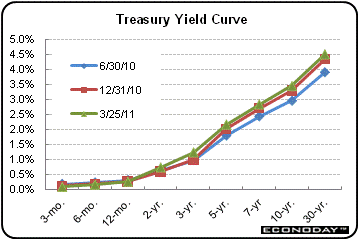
 Crude oil prices surged this past week on events in Libya, the Middle East, and Japan. The two biggest moves in crude were on Monday and Tuesday. The spot price of West Texas Intermediate rose $1.27 per barrel on Monday in response to news of further air strikes by allied forces against Libya, threatening to extend disruption of supply from this oil producer/exporter. Also, crude was bumped up on reports of worsening violence in Syria regarding pro-democracy demonstrations and Bahrain’s government declaring a three-month state of emergency in response to demonstrations. Crude oil prices surged this past week on events in Libya, the Middle East, and Japan. The two biggest moves in crude were on Monday and Tuesday. The spot price of West Texas Intermediate rose $1.27 per barrel on Monday in response to news of further air strikes by allied forces against Libya, threatening to extend disruption of supply from this oil producer/exporter. Also, crude was bumped up on reports of worsening violence in Syria regarding pro-democracy demonstrations and Bahrain’s government declaring a three-month state of emergency in response to demonstrations.
On Tuesday, the focus shifted to Japan as it is becoming apparent that rebuilding in that earthquake and tsunami ravaged country will lead to heavy demand for oil. Japan announced that it is considering establishing a reconstruction agency to oversee repairs from the March 11 earthquake and tsunami. Spot WTI surged just over $2 per barrel for the day.
Net for the week, spot prices for West Texas Intermediate jumped $3.93 per barrel to settle at $105.00.
The latest news on housing is quite negative and manufacturing hit a bump in the road with the latest durables report. Meanwhile, inflation is rattling the consumer. But forward momentum in the fourth quarter was better than previously believed.
 With the final estimate for the fourth quarter, real GDP growth was revised up and was about as strong as most had expected all along. Fourth quarter GDP growth was bumped up to 3.1 percent annualized growth from the second estimate of 2.8 percent. As with the prior estimate, the fourth quarter was still stronger than the third quarter pace of 2.6 percent. With the final estimate for the fourth quarter, real GDP growth was revised up and was about as strong as most had expected all along. Fourth quarter GDP growth was bumped up to 3.1 percent annualized growth from the second estimate of 2.8 percent. As with the prior estimate, the fourth quarter was still stronger than the third quarter pace of 2.6 percent.
The upward revision to fourth quarter growth primarily reflected stronger inventory investment, nonresidential structures, equipment & software, and residential investment. Downward revisions were seen in net exports and government purchases.
Demand numbers were little changed. Final sales of domestic product were unrevised net from the second estimate of 6.7 percent. Final sales to domestic purchasers (takes out net exports) were revised up marginally to 3.2 percent from the second estimate of 3.1 percent for the fourth quarter.
On the inflation front, the GDP price index was unrevised compared to the second estimate of 0.4 percent. The price index for gross domestic purchases, which measures prices paid by U.S. residents and is the Commerce Department’s headline price index, increased 2.1 percent in the fourth quarter, matching the prior estimate and topping the 0.7 percent rise in the third quarter. Inflation is notably stronger than indicated by the media’s preferred price index.
Looking ahead, how are components sizing up for the first quarter, based on limited amounts of monthly source data' For PCEs, monthly real PCEs dipped 0.1 percent in January and we will see the February data on Monday. But in February, retail sales excluding autos and gasoline were up a strong 0.6 percent (nominal) while unit new motor vehicles jumped a monthly 6.4 percent.
Looking at nonresidential structures source data, private nonresidential construction outlays in January fell a nominal 6.9 percent. For equipment investment, monthly shipments of nondefense capital goods rebounded 3.5 percent (nominal) in February, following a 3.1 percent decline the month before. For residential investment, monthly private residential outlays actually rose a monthly 5.3 percent but there likely will be a decline in February, given the sharp drop in starts. Monthly business inventories jumped 0.9 percent (nominal) in January. For net exports, the monthly trade gap for goods in real dollars worsened in January to $49.5 billion from $46.0 billion in December.
The latest estimates for GDP and components indicate that the economy had moderately strong forward momentum at the end of 2010. More recent monthly numbers show overall momentum continuing but very mixed by sector with consumer, equipment investment, and inventory investment leading growth in the current quarter and with housing, nonresidential construction, and net exports weighing on growth. Net, moderate growth continues.
 It is beginning to look like the housing sector is going into recession again. Existing home sales in February fell 9.6 percent to an annual rate of 4.88 million. Year-on-year, sales are down 2.8 percent. Declines were evenly split between single-family homes and condos and were also evenly split across regions. It is beginning to look like the housing sector is going into recession again. Existing home sales in February fell 9.6 percent to an annual rate of 4.88 million. Year-on-year, sales are down 2.8 percent. Declines were evenly split between single-family homes and condos and were also evenly split across regions.
 Heavy supply just does not appear ready to make steady progress as with the latest report where supply is up and prices are down. Supply rose 3.5 percent to 3.488 million homes in what is 8.6 months of supply at the current sales rate, up from 7.5 months in January and even above year-ago February supply of 8.4 months. The median sales price fell 1.1 percent February to $156,100, resulting in a year-on-year drop of 5.2 percent. Heavy supply just does not appear ready to make steady progress as with the latest report where supply is up and prices are down. Supply rose 3.5 percent to 3.488 million homes in what is 8.6 months of supply at the current sales rate, up from 7.5 months in January and even above year-ago February supply of 8.4 months. The median sales price fell 1.1 percent February to $156,100, resulting in a year-on-year drop of 5.2 percent.
Distressed sales made up a very heavy 39 percent of all transactions with cash transactions at 33 percent, a very heavy proportion pointing to bottom fishing by investors but also reflecting still tough credit conditions for ordinary home buyers.
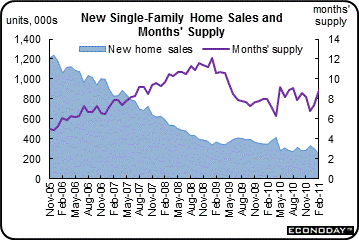
As bad as it is for existing home sales, it is even worse for new home sales. New home sales plunged 16.9 percent in February to an annual rate of 250,000. February’s pace is a record low for a series going back to 1963. All regions showed declines.
Supply on the market rose to 8.9 months from January's 7.4 months and compared against 8.0 months in February last year.
The median price fell 13.9 percent in the month to $202,100, putting the year-ago rate at down 8.9 percent. It should be pointed out that prices for both existing and new home sales are affected by the mix of sales between low and high end. Shifts in composition affect the median price since these price measures are not based on repeat transactions (comparing price changes for same houses).
The new home market is being particularly hit by competition from distressed sales of existing homes. But existing home sales have also been depressed with prices there also coming down. Winter weather does cloud home sales as the seasonal factors are rather large.
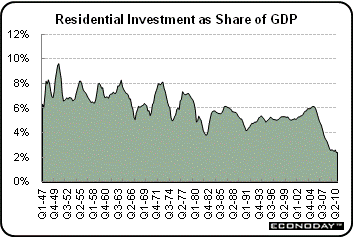 While it is not much consolation for real estate brokers, homebuilders, or banks holding foreclosures, the economy has to a large degree adjusted to creating growth without a large contribution from housing. The housing investment component share of GDP has fallen sharply over the past seven years. For the fourth quarter, residential investment’s share of GDP was at a record low of 2.4 percent, compared to a recent high of 6.2 percent in the second quarter of 2005. The good news is that while an improved housing sector would help economic growth, it is not necessary either. While it is not much consolation for real estate brokers, homebuilders, or banks holding foreclosures, the economy has to a large degree adjusted to creating growth without a large contribution from housing. The housing investment component share of GDP has fallen sharply over the past seven years. For the fourth quarter, residential investment’s share of GDP was at a record low of 2.4 percent, compared to a recent high of 6.2 percent in the second quarter of 2005. The good news is that while an improved housing sector would help economic growth, it is not necessary either.
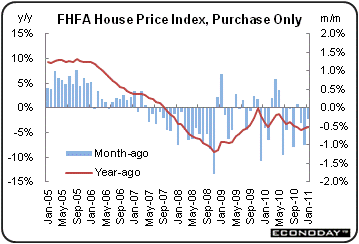 The slump in home sales has led to heavy inventories. And the invisible hand of supply and demand clearly has come into play. This has been seen in home prices in the existing and new home sales reports. But a more reliable measure is the purchase only home price index from the FHFA (Federal Home Finance Agency). The FHFA purchase only house price index slipped 0.3 percent in January, following a revised decline of 1.0 percent in December (originally down 0.3 percent). The slump in home sales has led to heavy inventories. And the invisible hand of supply and demand clearly has come into play. This has been seen in home prices in the existing and new home sales reports. But a more reliable measure is the purchase only home price index from the FHFA (Federal Home Finance Agency). The FHFA purchase only house price index slipped 0.3 percent in January, following a revised decline of 1.0 percent in December (originally down 0.3 percent).
On a year-on-year basis, the FHFA HPI is down 3.9 percent, compared to down 4.1 percent in December.
The bottom line is that home prices remain under downward pressure from distressed sales and demand constrained by tight credit. The home price picture is just another indication that housing has reentered recession.
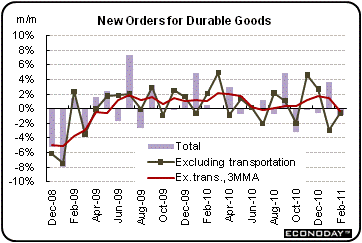 The latest durables report is a quandary relative to all of the good news in recently released manufacturing surveys. Overall durables orders in February dipped 0.9 percent, following a 3.6 percent rebound in January. Excluding transportation, new orders for durable goods decreased 0.6 percent after a 3.0 percent drop in January. The latest durables report is a quandary relative to all of the good news in recently released manufacturing surveys. Overall durables orders in February dipped 0.9 percent, following a 3.6 percent rebound in January. Excluding transportation, new orders for durable goods decreased 0.6 percent after a 3.0 percent drop in January.
Transportation led February’s drop, slipping 1.9 percent after a huge 29.6 percent jump in January. The decrease was primarily due to an 18.4 percent fall in defense aircraft orders. On the positive side within transportation, motor vehicles rose 1.9 percent while nondefense aircraft & parts increased 26.7 percent.
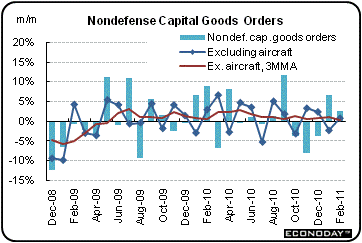
Outside of transportation, the numbers were mixed. Declines were seen in primary metals, machinery, and in “other.” Gains were seen in fabricated metals, computers & electronic parts, and in electrical equipment.
Business investment in equipment has softened after strength late last year. Nondefense capital goods orders excluding aircraft in February decreased 1.3 percent, following a 6.0 percent drop the month before. Shipments for this series edged back up 0.8 percent, following a 2.3 percent fall in January.
The durables orders series is one of the most volatile that there is on a monthly basis and that is a key reason to partially discount recent weakness. Also, demand for manufactured goods is still healthy outside of housing related durables.
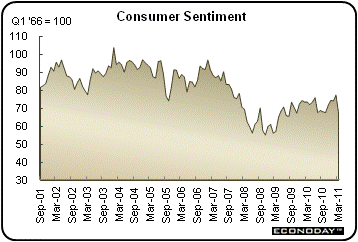 The consumer is being rattled by high gasoline and high food prices along with global events. Consumer sentiment for the final March reading came in at 67.5, compared to 68.2 at mid-month, which implies a 66.8 reading in the latter part of the month. The consumer is being rattled by high gasoline and high food prices along with global events. Consumer sentiment for the final March reading came in at 67.5, compared to 68.2 at mid-month, which implies a 66.8 reading in the latter part of the month.
For end of month, March is down a sharp 10 points from February’s reading of 77.5.
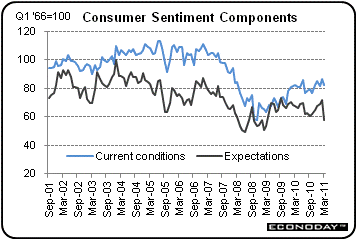
Expectations, the leading component of the index, sagged in the final reading of March to 57.9 from a mid-month 58.3. Current conditions fell a little more than one point to 82.5. These readings are among the weakest of the recovery.
Inflation expectations did not worsen in the latter part of the month which is good news, but they remain significantly heightened from February. One-year expectations are 4.6 percent, up from 3.4 percent last month, with five-year expectations at 3.2 percent, up from 2.9 percent.
 Overall, the less optimistic mood reflects the greater turmoil in Libya as well as the Middle East and, of course, reflects the crisis in Japan. Also, consumers are concerned that high gas and food prices will cut into the purchasing power of income. But so far, consumers have not let increased worries reduce spending by much. Overall, the less optimistic mood reflects the greater turmoil in Libya as well as the Middle East and, of course, reflects the crisis in Japan. Also, consumers are concerned that high gas and food prices will cut into the purchasing power of income. But so far, consumers have not let increased worries reduce spending by much.
Economic news cannot be positive every week and that certainly was the case this past week. Improvement in housing is nowhere in sight, given heavy supply on the market and modest improvement in the labor market. Manufacturing likely is still on an uptrend despite disappointing durables numbers. While the consumer is more nervous about high gasoline and food prices—and possibly about global events—spending traditionally is more stable than confidence numbers and hopefully that holds true now. And corporate profits slowly are growing stronger.
The focus is on the consumer sector, starting with personal income and spending on Monday. Consumer confidence prints Tuesday, followed by jobless claims Thursday. The highlight, of course, is the employment situation for March, posting on Friday. Throughout the day on Friday, automakers release unit sales numbers for March. Also garnering attention the last day of the week is ISM manufacturing.
Personal income in January increased 1.0 percent, following a 0.4 percent gain the month before. The latest figure was boosted largely by technical effects from last year’s payroll tax cuts. Wages & salaries, however, still grew a moderate 0.3 percent after gaining at the same pace in December. However, personal consumption expenditures increased only a modest 0.2 percent, following a 0.5 percent advance in December. On the inflation front, the PCE price index posted a 0.3 percent rise, matching the gain in December. The core rate was not as strong but still warmed up a bit with a 0.1 percent rise, compared to no change in December. Looking ahead, the private wages and salaries component of personal income is likely to be on the soft side in February as aggregate weekly earnings were up only 0.2 percent for the month. But we should see improvement in spending as retail sales excluding autos rose 0.7 percent and unit new motor vehicles surged 6.4 percent. PCE inflation will likely be mixed as the headline CPI jumped 0.5 percent in February while the core CPI rose 0.2 percent.
Personal income Consensus Forecast for February 11: +0.4 percent
Range: +0.2 to +1.0 percent
Personal consumption expenditures Consensus Forecast for February 11: +0.6 percent
Range: +0.2 to +0.8 percent
Core PCE price index Consensus Forecast for February 11: +0.2 percent
Range: +0.1 to +0.2 percent
The Conference Board's consumer confidence index rose to 70.4 in February for the best reading in three years. January was revised more than four points higher to 64.8. Most of the improvement was related to a better assessment of the jobs market. Fewer consumers in February said jobs are hard to get, at 45.7 percent, compared to January's 47.0 percent. Also, improvement was especially striking in the assessment of future income which before this report had been in unprecedented inversion, that is more saw their income decreasing than increasing. In the latest report 17.3 percent saw their income improving versus 13.8 percent seeing a decrease. But higher gasoline and food prices likely will weigh on confidence in March.
Consumer confidence Consensus Forecast for March 11: 64.0
Range: 55.0 to 70.0
Initial jobless claims for the March 19 week fell 5,000 to 382,000. The four-week average edged lower to 385,250 to show a more than 15,000 month-ago improvement. These are the best readings of the recovery. Continuing claims also posted the best readings of the recovery, down 2,000 to 3.721 million in data for the March 12 week. The four-week average of 3.755 million shows a nearly 150,000 month-ago improvement.
Jobless Claims Consensus Forecast for 3/26/11: 380,000
Range: 370,000 to 385,000
The Chicago PMI headline index for February rose more than a 1/2 point to a 61.4 level that matches the best strength of the last expansion. The employment index, at 64.5 for a nearly three point monthly gain, showed its best levels since the early 70s. Looking ahead, we are likely to see a robust headline number for March as the new orders index improved from 75.7 in January to 75.9 in February—the highest reading since December 1983.
Chicago PMI Consensus Forecast for March 11: 70.0
Range: 66.0 to 73.0
Factory orders jumped 3.1 percent in January with the gain centered in aircraft. The durables component gained a revised 0.3 percent while nondurables orders surged 3.1 percent. Gains for non-durables, specifically petroleum and coal, along with gains for metals largely reflected price effects. More recently, durables orders for February declined 0.9 percent.
Factory orders Consensus Forecast for February 11: +0.5 percent
Range: -0.4 to +1.0 percent
Nonfarm payroll employment in February grew by 192,000, following a revised 63,000 rise in January and a 152,000 gain in December. Private nonfarm payrolls were somewhat stronger, increasing 222,000 in February, following a 68,000 boost in January. A disappointment in the employment report was in earnings as average hourly earnings were flat in February, following a 0.4 percent jump the previous month. Turning to the household survey, the unemployment rate edged down to 8.9 percent from 9.0 percent in January. Most of the decrease in unemployment was for those unemployed 15 weeks or more, suggesting an increase in discouraged workers dropping out of the workforce.
Nonfarm payrolls Consensus Forecast for March 11: 200,000
Range: 150,000 to 310,000
Private payrolls Consensus Forecast for March 11: 190,000
Range: 165,000 to 2250,000
Unemployment rate Consensus Forecast for March 11: 8.9 percent
Range: 8.7 to 9.1 percent
Average workweek Consensus Forecast for March 11: 34.3 hours
Range: 34.2 to 34.3 hours
Average hourly earnings Consensus Forecast for March 11: +0.2 percent
Range: +0.1 to +0.2 percent
The composite index from the ISM manufacturing survey in February advanced 0.6 point to 61.4 in. The latest is the highest level since the same reading for May 2004 and the peak ISM for the last expansion. February’s improvement was led by the employment and production components. The employment index jumped 2.8 points to 64.5 while the production index also gained 2.8 points, reaching 66.3. Looking ahead, the new orders index only edged up 0.2 points but remained at a high level of 68.0.
ISM manufacturing composite index Consensus Forecast for March 11: 61.2
Range: 59.0 to 62.5
Construction spending in January declined 0.7 percent after falling a revised 1.6 percent in December. Given that housing starts fell a sharp 22.5 percent in February, there is a good chance construction outlays will be down for the month—at least for the residential component.
Construction spending Consensus Forecast for February 11: -0.3 percent
Range: -1.5 to +1.5 percent
Sales of domestic light motor vehicles in February advanced an impressive 6.2 percent to an annualized 10.2 million unit pace. Domestics and imports combined jumped 6.4 percent to an annualized 13.4 million. It is going to be a tough act to follow for March sales but worries about pending supply shortages of Japanese autos and parts (and rising prices) could boost sales for the month.
Motor vehicle domestic sales Consensus Forecast for March 11: 10.0 million-unit rate
Range: 9.8 to 10.1 million-unit rate
R. Mark Rogers is the author of The Complete Idiot’s Guide to Economic Indicators, Penguin Books, 2009.
Econoday Senior Writer Mark Pender contributed to this article.
|
