|
This past week saw financial markets pummeled by global crises-from civil war in Libya to struggles by Japanese authorities to prevent nuclear meltdown and to begin post-earthquake/tsunami recovery. Despite improvement on several fronts on Thursday and Friday, trader nerves remained on edge heading into the weekend. Meanwhile, the U.S. economy is looking relatively good outside of housing. But inflation is rearing its ugly head despite the Fed looking the other way.
 Equities were sent plunging the first three days of the week on global concerns with a partial recovery the final two days of trading. Stocks fell on Monday on concern about the impact of the earthquake and tsunami in Japan on that country's economic growth and spillover into the world economy. Focus also turned to how extensive the damage to nuclear power plants is. In the U.S., General Electric shares led equities down on news that GE had designed the reactors at the Fukushima Daiichi nuclear plant. Equities were sent plunging the first three days of the week on global concerns with a partial recovery the final two days of trading. Stocks fell on Monday on concern about the impact of the earthquake and tsunami in Japan on that country's economic growth and spillover into the world economy. Focus also turned to how extensive the damage to nuclear power plants is. In the U.S., General Electric shares led equities down on news that GE had designed the reactors at the Fukushima Daiichi nuclear plant.
Equities continued downward on Tuesday despite a better-than-expected Empire State manufacturing index and a Fed FOMC statement that upgraded the U.S. economy. Worries over the situation in Japan and worsening hostilities between pro- and anti-Qaddafi forces in Libya knocked stocks down. In key company news, Intel fell on a downgrade while Aflac fell sharply on concern about losses in Japan. Most of the insurer's obligations and earnings are from Japan.
Stocks fell the sharpest at midweek as the possibility of a meltdown at Fukushima Daiichi nuclear plant appeared to be very distinct. Also, housing starts in the U.S. fell significantly. And pro-Qaddafi forces were preparing for a final assault on rebels in eastern portions of Libya.
On Thursday, FedEx delivered good news as its profits forecast topped estimates. Efforts by Japanese workers to contain the damage at the Fukushima Daiichi nuclear plant appeared to be working. Also strong economic data from the Philly Fed and for leading indicators offset a weak headline number for national industrial production.
Several events lifted stocks on Friday. First, the pro-Qaddafi government in Libyan agreed to a United Nations demand for a cease fire. The G-7 announced coordinated intervention to keep the yen from appreciating too much as the crisis in Japan was resulting in repatriation of yen. The nuclear difficulties in Japan remained grave but appeared to be stabilizing. Finally, the big news from the Fed actually came on the last day of the week instead of Tuesday's meeting statement. The Fed announced that after conducting stress tests on the nation's largest 19 bank holding companies that some of the banks have built up enough capital to be allowed to raise quarterly dividends or to conduct stock buybacks. Financials led equities up for the day.
Friday's gains likely would have been higher other than risk aversion. Many traders did not want to go into the weekend long and squared off positions, leading to some retracement late in trading on Friday.
Equities were down significantly this past week. The Dow was down 1.5 percent; the S&P 500, down 1.9 percent; the Nasdaq, down 2.6 percent; and the Russell 2000, down 1.0 percent.
For the year-to-date, major indexes are mostly up as follows: the Dow, up 2.4 percent; the S&P 500, up 1.7 percent; and the Russell 2000, up 1.4 percent. The Nasdaq is down 0.3 percent.
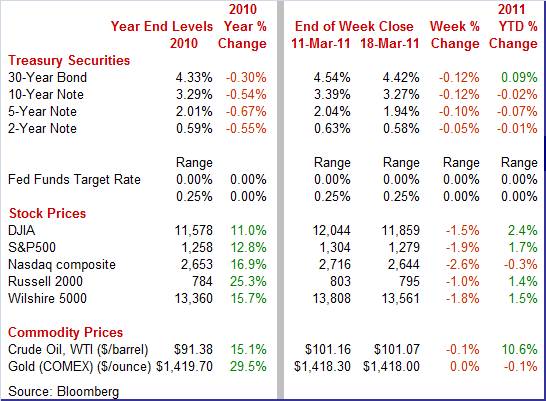
Weekly percent change column reflects percent changes for all components except interest rates. Interest rate changes are reflected in simple differences.
 Treasury yields moved in tandem with stock prices this past week on movement into and out of safety. Although events in the Middle East and North Africa remained a concern, focus shifted to Japan's difficulties from the earthquakes and tsunamis and from possible fallout from nuclear reactors. The Fed's confirmation on Tuesday that it would continue with plans to buy $600 billion in Treasuries also weighed on yields. Rates hit their lowest for the week on Wednesday as the situation at Japan's damaged nuclear power plants worsened and flight to safety increased. Also at midweek, the Fed had to extend its scheduled purchase of Treasuries due to sharply increased volatility as prices jumped just as the scheduled close of purchases approached. Treasury yields moved in tandem with stock prices this past week on movement into and out of safety. Although events in the Middle East and North Africa remained a concern, focus shifted to Japan's difficulties from the earthquakes and tsunamis and from possible fallout from nuclear reactors. The Fed's confirmation on Tuesday that it would continue with plans to buy $600 billion in Treasuries also weighed on yields. Rates hit their lowest for the week on Wednesday as the situation at Japan's damaged nuclear power plants worsened and flight to safety increased. Also at midweek, the Fed had to extend its scheduled purchase of Treasuries due to sharply increased volatility as prices jumped just as the scheduled close of purchases approached.
Yields rebound moderately the last two days of trading as the situation at Japan's damaged nuclear power plants appeared to be stabilizing and on news that the Qaddafi government would honor the United Nation's demand for a cease fire with anti-government forces.
For this past week Treasury rates were down as follows: 3-month T-bill, down 1 basis point; the 2-year note, down 5 basis points; the 5-year note, down 10 basis points; the 7-year note, down 12 basis points; the 10-year note, down 12 basis points; and the 30-year bond, down 12 basis points.
 Despite sharp daily volatility, crude oil prices ended the week essentially unchanged but quite elevated. Despite sharp daily volatility, crude oil prices ended the week essentially unchanged but quite elevated.
The biggest moves of the week were on Tuesday and Thursday. The spot price for West Texas Intermediate dropped $4 per barrel to just over $97 on Tuesday. The worsening situation in Japan led traders to see a likely drop in demand for oil from lower economic growth for Japan more than offsetting possible supply disruptions in the Middle East and North Africa. At the request of the Bahrain government, military forces from neighboring Gulf countries entered the country to help quell protests. Also, in Libya, Qaddafi forces were forcing the retreat of rebels.
On Thursday, the spot price of crude jumped about $3.50 per barrel as the situation in Japan appeared to stabilize but events in the Bahrain and Libya worsened. Bahrain declared a three-month state of emergency while Qaddafi forces pounded rebels, including around oil facilities. Crude edged down on Friday on news that Qaddafi would agree to a cease fire with anti-government forces.
Net for the week, spot prices for West Texas Intermediate were little changed, slipping 9 cents per barrel to settle at $101.07. Prices remain at levels not seen since autumn of 2008.
The latest economic news points to gains in manufacturing, slippage in housing, and stronger inflation.
 Manufacturing continues to be a source of strength for the recovery. But you had to look beyond the headline number in the latest industrial production report to see it. Overall industrial production in February slipped 0.1 percent, following a revised 0.3 percent gain the prior month. The dip in February was led by a 4.2 percent drop in utilities output, following a 4.5 percent decrease the month before. Utilities were down on atypically warm weather for the month. Manufacturing continues to be a source of strength for the recovery. But you had to look beyond the headline number in the latest industrial production report to see it. Overall industrial production in February slipped 0.1 percent, following a revised 0.3 percent gain the prior month. The dip in February was led by a 4.2 percent drop in utilities output, following a 4.5 percent decrease the month before. Utilities were down on atypically warm weather for the month.
In contrast, manufacturing output posted 0.4 percent gain after a 0.9 percent surge in January. Mining output rebounded 0.8 percent, following a 0.7 percent decline in January.
 Within manufacturing, output of motor vehicles and parts was up a sharp 4.2 percent, following a 4.5 percent boost in January. Excluding autos, manufacturing rose 0.2 percent in January after a 0.7 percent jump the prior month. Yes, autos led the latest manufacturing number and nonautos manufacturing only posted a modest rise. But taking into account strong gains in the three prior months, the level of activity is healthy. Within manufacturing, output of motor vehicles and parts was up a sharp 4.2 percent, following a 4.5 percent boost in January. Excluding autos, manufacturing rose 0.2 percent in January after a 0.7 percent jump the prior month. Yes, autos led the latest manufacturing number and nonautos manufacturing only posted a modest rise. But taking into account strong gains in the three prior months, the level of activity is healthy.
Motor vehicle assemblies are making a significant contribution to the manufacturing sector. Assemblies of light motor vehicles in February rose to 8.30 million units annualized from 7.66 million the month before. The February pace was the second strongest of the recovery, trailing only the 8.54 million units produced in July of 2010. Production has made quite a comeback from the recession monthly low of 3.62 million in January 2009. Demand for motor vehicles is relatively strong but there could be some bumps in the road in coming months for auto production on the supply side. A significant number of motor vehicles assembled in the U.S. rely in part on parts from Japan. A number of auto manufacturers in that country have shut down production due to disruptions in power and due to transportation difficulties related to the recent earthquake, tsunami, and nuclear plant problems.
Total capacity utilization in February edged down to 76.3 percent from 76.4 percent the prior month. The February rate fell short of the median forecast for 76.5 percent.
Supply issues notwithstanding, recent manufacturing surveys point toward strong numbers ahead.
The latest New York Fed manufacturing survey shows moderately positive growth. But the more important (in terms of output) the mid-Atlantic region is gaining momentum, surging ahead.
 Manufacturers in New York State perceive the manufacturing sector to be improving. The headline index-which is not a composite of components but the answer to a single question on general business conditions-rose 2.07 points in the March report to 17.50 for a reading well above breakeven zero and suggesting a mild month-to-month acceleration in growth. Manufacturers in New York State perceive the manufacturing sector to be improving. The headline index-which is not a composite of components but the answer to a single question on general business conditions-rose 2.07 points in the March report to 17.50 for a reading well above breakeven zero and suggesting a mild month-to-month acceleration in growth.
 But the details in the report show more of a deceleration than an acceleration. Indexes for new orders, shipments, and inventories all eased compared to February but remained in positive territory, indicating slowing but still growing activity. The index for new orders slowed to 5.81 from 11.80 in February. Unfilled orders actually swung from a negative 4.82 in February to a positive 2.60 in March. Indexes for the number of employees and for the average workweek did rise which is a plus. These improvements in labor reflect management optimism for a pending build in production. Finally, price data show acceleration for both inputs and outputs. But the details in the report show more of a deceleration than an acceleration. Indexes for new orders, shipments, and inventories all eased compared to February but remained in positive territory, indicating slowing but still growing activity. The index for new orders slowed to 5.81 from 11.80 in February. Unfilled orders actually swung from a negative 4.82 in February to a positive 2.60 in March. Indexes for the number of employees and for the average workweek did rise which is a plus. These improvements in labor reflect management optimism for a pending build in production. Finally, price data show acceleration for both inputs and outputs.
For the Philly Fed manufacturing survey, general activity and new orders are rising sharply, pointing to a broad-based gain in momentum. First, the general business activity index jumped 7.5 points to 43.4 in March. This is the strongest reading not only for this recovery but since a 47.0 mark set January 1984.
The new orders index jumped more than 16.6 points in the March reading to 40.3, well above zero to indicate month-to-month growth and far above February to indicate a sharp month-to-month acceleration in growth.
Other readings are also notably positive but mostly do not show acceleration relative to February. However, a significant acceleration was seen in inventories-an indication that the region's manufacturers are scrambling to secure enough inputs for future output. Employment shows a slight month-to-month slowing in hiring but there was a modest pickup in the average workweek. Price data show steady rates of pressure for both inputs and outputs.
 Housing starts fell back in February after an unexpectedly strong showing in January. Mostly, it was a partial reversal of the earlier spike in the multifamily component but single-family starts weakened significantly. Housing starts in February dropped a monthly 22.5 percent after jumping 18.4 percent the prior month. The February annualized pace of 0.479 million units is down 20.8 percent on a year-ago basis. The February reversal is led by a monthly 46.1 percent drop in multifamily starts, following an 87.4 percent surge in January. Also, the single-family component fell 11.8 percent in February after edging up 1.4 percent the prior month. Housing starts fell back in February after an unexpectedly strong showing in January. Mostly, it was a partial reversal of the earlier spike in the multifamily component but single-family starts weakened significantly. Housing starts in February dropped a monthly 22.5 percent after jumping 18.4 percent the prior month. The February annualized pace of 0.479 million units is down 20.8 percent on a year-ago basis. The February reversal is led by a monthly 46.1 percent drop in multifamily starts, following an 87.4 percent surge in January. Also, the single-family component fell 11.8 percent in February after edging up 1.4 percent the prior month.
Several factors likely affected the latest starts number which is extremely low. First, January's jump was way above trend and some reversal should be expected. Second, winter months are notoriously volatile and starts may have been hampered by severe weather. Finally, housing demand is still soft and inventories of single-family houses are still high. Housing construction is still anemic but maybe not as bad as suggested by February's starts.
Nonetheless, homebuilders are still concerned about supply, according to the latest data on permits. Housing permits declined 8.2 percent in February, following a 10.2 percent decrease in February. Overall permits printed at an annualized rate of 0.517 million units and are down 20.5 percent on a year-ago basis. The latest decline is led by the single-family component which was down 9.3 percent while multifamily permits fell 4.9 percent. Essentially, homebuilders simply are not willing to make a bet on stronger sales any time soon.
 Food and energy costs are jacking up consumer price inflation. The CPI in February jumped 0.5 percent, following a 0.4 percent boost in January. Excluding food and energy, CPI inflation increased 0.2 percent, matching the rise in the prior month. Food and energy costs are jacking up consumer price inflation. The CPI in February jumped 0.5 percent, following a 0.4 percent boost in January. Excluding food and energy, CPI inflation increased 0.2 percent, matching the rise in the prior month.
 Although the overall CPI was led upward by energy, food also played a major role. Energy surged 3.4 percent in February after increasing 2.1 percent in January. Gasoline jumped 4.7 percent, after increasing 3.5 percent the previous month. Also, heating oil spiked 4.1 percent, following a 5.4 percent hike in January. Although the overall CPI was led upward by energy, food also played a major role. Energy surged 3.4 percent in February after increasing 2.1 percent in January. Gasoline jumped 4.7 percent, after increasing 3.5 percent the previous month. Also, heating oil spiked 4.1 percent, following a 5.4 percent hike in January.
Food price inflation remained strong with a 0.6 percent increase, following a 0.5 percent gain in January. Five of the six major grocery store food groups posted increases. Notably, the index for fruits and vegetables increased the most, rising 2.2 percent as the fresh vegetables index increased 6.7 percent.
The core was led up by new vehicles, medical care, and airline fares. On the soft side was shelter which edged up marginally. The apparel index was one of the few to decline. The bottom line is that core components are now headed up. The Fed may finally be getting the stronger inflation intended from its balance sheet expansion.
But for now, the increased inflation is mainly at the headline level due to food and energy inflation. Year-on-year, overall CPI inflation increased to 2.2 (seasonally adjusted) from 1.7 percent in January. But the core rate worsened to 1.1 percent from 0.9 percent on a year-ago basis.
As has been the case for quite a few months, shelter costs have held back core gains although that is starting to change. Year-ago shelter cost inflation is now mildly positive at up 0.8 percent, compared to a recent low of minus 0.3 percent in August 2010. Weak housing markets have owners' equivalent rent still soft at 0.6 percent and tenant rent at 1.1 percent. As a sign of an improving economy, lodging is now up 2.0 percent year-on-year.
 Producer price inflation remains red hot at the headline level while the core eased from January's spike. Energy and food, of course, jacked up the February headline number to a strong 1.6 percent increase, following a January jump of 0.8 percent. At the core level, the PPI slowed to a 0.2 percent rise after jumping 0.5 percent in January. The median market forecast was for a 0.2 percent rise. Producer price inflation remains red hot at the headline level while the core eased from January's spike. Energy and food, of course, jacked up the February headline number to a strong 1.6 percent increase, following a January jump of 0.8 percent. At the core level, the PPI slowed to a 0.2 percent rise after jumping 0.5 percent in January. The median market forecast was for a 0.2 percent rise.
 By components, food prices surged 3.9 percent, after a 0.3 percent rise in January. The energy component remained under strong upward pressure, gaining 3.3 percent after jumping 1.8 percent in January. The core rate slowed on pharmaceuticals turning flat after a 1.4 percent spike in January and with computers dropping 1.1 percent. By components, food prices surged 3.9 percent, after a 0.3 percent rise in January. The energy component remained under strong upward pressure, gaining 3.3 percent after jumping 1.8 percent in January. The core rate slowed on pharmaceuticals turning flat after a 1.4 percent spike in January and with computers dropping 1.1 percent.
For the overall PPI, the year-on-year rate jumped to 5.8 percent from 3.7 percent in January (seasonally adjusted). The core rate rose to 1.9 percent from 1.6 the month before.
 The economy's forward momentum picked back up in February. The Conference Board's index of leading indicators jumped 0.8 percent after edging up only 0.1 percent the month before. The economy's forward momentum picked back up in February. The Conference Board's index of leading indicators jumped 0.8 percent after edging up only 0.1 percent the month before.
Strength was in the interest rate spread (10-year T-note less fed funds), which added 0.36 percentage points, and in a drop in unemployment claims, which added 0.33 percentage points to the leading index. Eight of the 10 components were positive.
The only notable negative was in building permits which subtracted 0.22 percentage points.
Looking ahead to March, the decline in jobless claims will likely end up a positive as will the rate spread. But with Treasury yields down on flight to safety, the positive contribution will likely be lower than in February. Also, stock prices, a big plus in February, have been coming down as did the mid-month reading on consumer sentiment.
 At this past week's Fed policy meeting, the Fed again left its fed funds target rate at a range of zero to 0.25 percent and retained the "extended period" language on retaining a low target rate. The Fed is keeping QE2 on schedule for completion by the end of June. The Fed gave a marginal upgrade to the recovery, noting that it "is on firmer footing" with the labor market "improving gradually." The FOMC sees the recent impact of higher oil prices on inflation as likely transitory. There were no dissenting votes. Also, there was no specific mention of recent events in Japan. At this past week's Fed policy meeting, the Fed again left its fed funds target rate at a range of zero to 0.25 percent and retained the "extended period" language on retaining a low target rate. The Fed is keeping QE2 on schedule for completion by the end of June. The Fed gave a marginal upgrade to the recovery, noting that it "is on firmer footing" with the labor market "improving gradually." The FOMC sees the recent impact of higher oil prices on inflation as likely transitory. There were no dissenting votes. Also, there was no specific mention of recent events in Japan.
There was considerable commentary about inflation. First, the Fed acknowledged that commodity prices-including oil-have risen significantly since last summer. But long-term inflation expectations are noted to have remained stable and measures of underlying inflation remain low. Of course, underlying inflation means the core CPI or core PCE price index. For now, the Fed is not yet worried about the impact of higher oil prices on inflation.
The FOMC decided to continue with its plans for QE2.
"To promote a stronger pace of economic recovery and to help ensure that inflation, over time, is at levels consistent with its mandate, the Committee decided today to continue expanding its holdings of securities as announced in November. In particular, the Committee is maintaining its existing policy of reinvesting principal payments from its securities holdings and intends to purchase $600 billion of longer-term Treasury securities by the end of the second quarter of 2011. The Committee will regularly review the pace of its securities purchases and the overall size of the asset-purchase program in light of incoming information and will adjust the program as needed to best foster maximum employment and price stability."
As of the March 16 week, the Fed's total assets stood at $2.587 trillion, compared to about $1 trillion before the first round of quantitative easing. When QE2 is finished at the end of June, total assets are likely to be a little under $3 trillion.
Sector strength is mixed for the recovery but manufacturing's gains are outweighing housing's slippage. Global uncertainties remain from the Middle East, North Africa, and Japan. But, net, the crises did not worsen and are believed to have improved somewhat. And the Fed's latest stress test of banks indicated that the negative effects of the recent financial crisis are fading. Financial markets are regaining health-at least outside of the sovereign debt problems in Europe.
Following last week's starts report, the focus on housing continues with existing home sales on Monday and new home sales at mid-week. On Thursday, we take a look into the crystal ball for manufacturing with the notoriously volatile durables orders report. Finally, we close the books on fourth quarter GDP at the end of the week.
Existing home sales rose 2.7 percent in January to a higher-than-expected annual rate of 5.36 million units. But the median price fell sharply in the month to a nine-year low, down 5.9 percent to $158,000 for deepening year-on-year contraction of 3.7 percent. Distressed sales accounted for a heavy 37 percent share of total sales, pointing to why prices were so weak. A positive in the existing homes report was a decline in supply to 7.6 months at the current sales rate from 8.2 months in December.
Existing home sales Consensus Forecast for February 11: 5.15 million-unit rate
Range: 5.00 to 5.23 million-unit rate
New home sales in January fell a sharp 12.6 percent to a lower-than-expected annual rate of 284,000 units. The latest pace is just barely above the historical low of 280,000 units sold in October 2010. The median price for a new home fell 1.9 percent in the month to $230,600. Despite recently softer prices, new homes are not as competitive as prices for existing homes.
The drop in new home sales made supply look heavier again, at 7.9 months at the current sales rate, compared to 7.0 months in December.
New home sales Consensus Forecast for February 11: 290 thousand-unit annual rate
Range: 240 thousand to 305 thousand-unit annual rate
Durable goods orders made a nice comeback in January-largely due to a surge in orders for civilian aircraft. Durables orders in January rebounded a revised 3.2 percent, following a 0.6 percent dip in December. Excluding transportation, new orders for durable goods fell back, declining a revised 3.0 percent after a 2.7 percent rise in December and 4.6 percent boost in November. Transportation led January's overall gain, surging a monthly 27.3 percent after a 12.0 percent decrease in December. Outside of transportation, components were mixed. Looking ahead, major manufacturing surveys show strong levels for the new orders index for February, including ISM, Philly, and New York Fed.
New orders for durable goods Consensus Forecast for February 11: +1.5 percent
Range: -0.5 percent to +4.5 percent
Initial jobless claims in the March 12 week reversed half of the prior week's rise with a 16,000 decline in the March 12 week to 385,000. The four-week average was down 7,000 to 386,250 for its best reading of the recovery. Continuing claims in data for the March 5 week fell 80,000 to 3.706 million in another recovery best.
Jobless Claims Consensus Forecast for 3/19/11: 385,000
Range: 378,000 to 390,000
GDP for fourth quarter turned out to be not as strong as initially estimated. Fourth quarter GDP growth was revised down to 2.8 percent annualized growth from the advance estimate of 3.2 percent. However, the fourth quarter was still marginally healthier than the third quarter pace of 2.6 percent. Notably, demand numbers were revised down somewhat. Final sales of domestic product were bumped down to 6.7 percent from the initial estimate of 7.1 percent. Final sales to domestic purchasers (takes out net exports) were nudged down to 3.1 percent from the original estimate of 3.4 percent for the fourth quarter. Nonetheless, the revised final sales numbers indicate that there still is moderately strong demand. On the inflation front, the GDP price index was little revised, coming in at 0.4 percent, compared to the initial estimate of 0.3 percent.
Real GDP Consensus Forecast for third estimate Q4 10: +3.1 percent annual rate
Range: +2.8 to +3.4 percent annual rate
GDP price index Consensus Forecast for third estimate Q4 10: +0.4 percent annual rate
Range: +0.4 to +0.6 percent annual rate
The Reuter's/University of Michigan's Consumer sentiment index or mid-March showed a dramatic drop to 68.2 from the February final reading of 77.5. The drop was even more notable given that the second half of February was very strong (based on implied numbers) due to moderate improvement in the job market. Mid-March weakness was centered in the leading component, the expectations index which plunged 13.3 points to 58.3. This indicates that consumers are less optimistic about where the economy is headed. The current conditions subcomponent of consumer sentiment held up better than expectations, slipping only 3.3 points to 83.6 from the February final reading of 86.9.
Consumer sentiment Consensus Forecast for final March 11: 68.0
Range: 63.0 to 70.5
R. Mark Rogers is the author of The Complete Idiot's Guide to Economic Indicators, Penguin Books, 2009.
Econoday Senior Writer Mark Pender contributed to this article.
|
