|
Uncertainty worsened this past week on worries about violence in the Middle East and North Africa, re-emerging sovereign debt problems in Europe, and over the possibility that Chinese economic growth is slowing. Meanwhile, news on the U.S. economy was mixed but likely positive on balance.
 Equities posted notable declines this past week, starting with a large drop Monday. Continued fighting in Libya between pro- and anti-government forces sent oil higher and lifted anxiety over the impact on economic growth. Sovereign debt worries resurfaced as Moody’s slashed Greece's credit rating to B1. Also, Wells Fargo downgraded the chipmaking industry, sending techs down. Equities posted notable declines this past week, starting with a large drop Monday. Continued fighting in Libya between pro- and anti-government forces sent oil higher and lifted anxiety over the impact on economic growth. Sovereign debt worries resurfaced as Moody’s slashed Greece's credit rating to B1. Also, Wells Fargo downgraded the chipmaking industry, sending techs down.
Tuesday saw a sizeable rebound as oil prices eased and Bank of America led financials up after announcing that its mortgage division is recovering. Stocks were mostly down at mid-week as traders continued to track events in the Middle East and North Africa.
The biggest drop during the week was on Thursday with declines in Asia carrying over to world markets, including the U.S. Early on Thursday, China announced a slowdown in exports for February, raising concern that China’s growth is easing. The fact that an extended holiday in China likely impacted exports did not allay worries over the strength of the Chinese economy. Adding to the downward plunge in U.S. stocks for the day were a sharp increase in initial jobless claims, a downgrade to Spain’s credit rating, and a sharp worsening in the U.S. trade deficit. Finally, traders were nervous ahead of Friday’s expected “Day of Rage” by protesters in Saudi Arabia—especially after reports that police in Saudi Arabia had fired on protestors (though not everyone realized it was with rubber bullets).
Equities made a partial comeback on Friday despite the 8.9 magnitude earthquake in Japan and the ensuing tsunami (with waves as high as 10 meters) causing massive damage in portions of the island nation. Strong retail sales numbers provided some lift for the day. Upward revisions to prior months were the main reason as February data came in as expected. Several companies also boosted profits forecasts. Little came of the “Day of Rage” in Saudi Arabia.
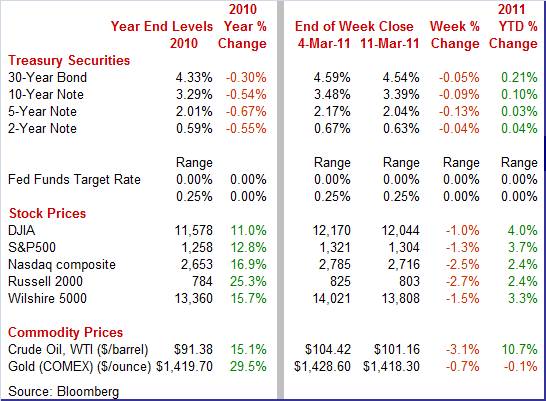
Equities were down this past week. The Dow was down 1.0 percent; the S&P 500, down 1.3 percent; the Nasdaq, down 2.5 percent; and the Russell 2000, down 2.7 percent.
For the year-to-date, major indexes are up as follows: the Dow, up 4.0 percent; the S&P 500, up 3.7 percent; the Nasdaq, up 2.4 percent; and the Russell 2000, up 2.4 percent.
Weekly percent change column reflects percent changes for all components except interest rates. Interest rate changes are reflected in simple differences.
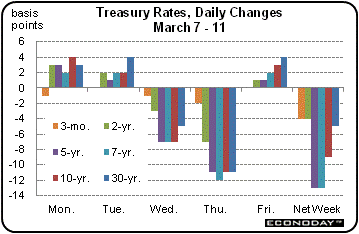 Treasury yields ended the week down significantly. However, rates started the week by firming Monday and Tuesday. Rates rose Monday on some unwinding of flight to safety on the prior Friday from a somewhat disappointing jobs report and surging oil prices. A drop in oil prices on Tuesday further eased flight to safety. Treasury yields ended the week down significantly. However, rates started the week by firming Monday and Tuesday. Rates rose Monday on some unwinding of flight to safety on the prior Friday from a somewhat disappointing jobs report and surging oil prices. A drop in oil prices on Tuesday further eased flight to safety.
But yields fell significantly at mid-week and sharply on Thursday. Demand for the Treasury’s 10-year note auction was strong, as oil remained close to the highest levels in two years, keeping fears high that economic growth will slow. Thursday saw several factors boost demand for Treasuries—a jump in jobless claims, a cut to Spain’s credit rating, a slowing in Chinese exports growth, and reports of violence in Saudi Arabia.
 Rates edged back up the last day of the week as markets were largely calm despite catastrophe in Japan. Helping to lift yields were concerns that Japanese insurers will have to sell U.S. bonds to pay for damages from the strongest earthquake on record. Rates edged back up the last day of the week as markets were largely calm despite catastrophe in Japan. Helping to lift yields were concerns that Japanese insurers will have to sell U.S. bonds to pay for damages from the strongest earthquake on record.
For this past week Treasury rates were down as follows: 3-month T-bill, down 4 basis points; the 2-year note, down 4 basis points; the 5-year note, down 13 basis points; the 7-year note, down 13 basis points; the 10-year note, down 9 basis points; and the 30-year bond, down 5 basis points.
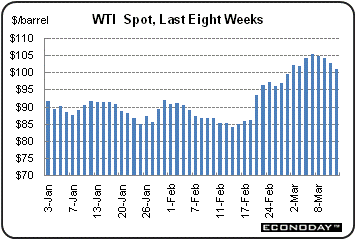 The price of crude remains in triple digits and not far from recent two-year highs despite a notable drop for the week. The price of crude remains in triple digits and not far from recent two-year highs despite a notable drop for the week.
But the week started in the other direction with the spot price of West Texas Intermediate rising more than a buck a barrel on continued fighting in Libya. Prices dipped Tuesday as OPEC officials publicly discussed whether to have an emergency meeting to discuss meeting the needs of the oil market. Also, rumors that Libyan leader Moammar Gadhafi was arranging to leave Libya safely bumped prices down.
Spot declined by a little more than $1.50 per barrel on Thursday on weak economic news—notably soft exports by China and a spike in jobless claims in the U.S. Crude fell by about the same amount again on Friday as the earthquake and tsunami damage were seen as cutting demand for crude. Little coming of the “Day of Rage” in Saudi Arabia and President Barack Obama saying the administration is ready to release oil from the Strategic Petroleum Reserve if needed also helped push prices down for the day.
Net for the week, spot prices for West Texas Intermediate dropped $3.26 per barrel to settle at $101.16.
Economic news was limited this week. However, the consumer has shown signs of strength in terms of spending, although it may be a little early to declare victory in this sector as higher gasoline prices are eroding consumer confidence and spending power. International trade activity has picked up for exports but even more for imports. But the details on imports are actually encouraging.
 The recovery has needed the consumer sector to return to normal and after a pause at the end of 2010, it appears that this sector has re-energized—at least for now. The recovery has needed the consumer sector to return to normal and after a pause at the end of 2010, it appears that this sector has re-energized—at least for now.
Overall retail sales in February surged 1.0 percent, following a revised 0.7 percent boost in January and a revised 0.6 percent increase in December. January and December had previously been estimated to be up 0.3 percent and 0.5 percent, respectively. Autos led the headline number up, jumping 2.3 percent, following a 1.2 percent gain in January.
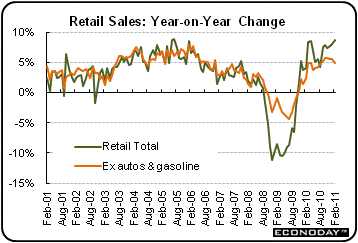 Excluding autos, sales advanced 0.7 percent, following a 0.6 percent gain in January. A notable part of this increase was price related on higher gasoline prices. Gasoline sales were up 1.4 percent after a 1.3 percent boost the month before. Excluding autos, sales advanced 0.7 percent, following a 0.6 percent gain in January. A notable part of this increase was price related on higher gasoline prices. Gasoline sales were up 1.4 percent after a 1.3 percent boost the month before.
Nonetheless, sales excluding autos and gasoline improved a strong 0.6 percent, following a 0.5 percent rise in January. Nearly all other major components (outside of autos and gasoline) were quite robust. Other notably strong components were sporting goods, hobby, book & music stores, up 1.3 percent, and food services & drinking places, up 1.2 percent. The latter is especially encouraging as it is a very discretionary category. Even the price depressed electronics component made a 0.9 percent comeback. The weakest major category was the housing-depressed furniture & home furnishings category, down a monthly 0.8 percent.
Despite price effects, the latest retail sales numbers reflect a strong showing by the consumer. The February numbers plus upward revisions will have economists revising their estimates for first quarter GDP but his time it will be upward. But looking forward, rising gasoline prices are dampening consumer spirits and cutting into spending power. Although crude oil prices dipped at the end of this past week, higher gasoline prices are still a risk for the consumer sector.
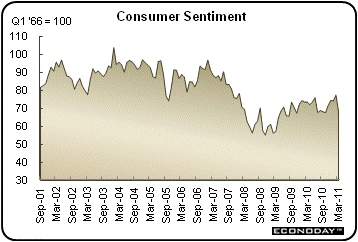 Apparently, consumers have finally gotten their monthly gasoline card bills in the mail—and they do not like the hit on the wallet. The consumer sentiment composite index for mid-March showed a dramatic drop to 68.2 from the February final reading of 77.5. The drop was even more notable given that the second half of February was very strong (based on implied numbers) due to moderate improvement in the job market. Apparently, consumers have finally gotten their monthly gasoline card bills in the mail—and they do not like the hit on the wallet. The consumer sentiment composite index for mid-March showed a dramatic drop to 68.2 from the February final reading of 77.5. The drop was even more notable given that the second half of February was very strong (based on implied numbers) due to moderate improvement in the job market.
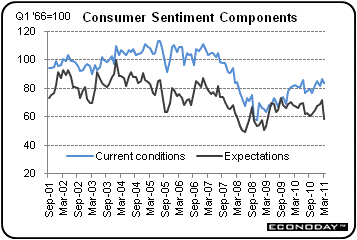 Mid-March weakness was centered in the leading component, the expectations index which plunged 13.3 points to 58.3. This indicates that consumers are less optimistic about where the economy is headed. The expectation drop will weigh on the Conference Board’s index of leading indicators as it is one component of the index of leading indicators. Mid-March weakness was centered in the leading component, the expectations index which plunged 13.3 points to 58.3. This indicates that consumers are less optimistic about where the economy is headed. The expectation drop will weigh on the Conference Board’s index of leading indicators as it is one component of the index of leading indicators.
A big reason for the drop in expectations was a boost in inflation expectations which spiked, up 1.2 percentage points to 4.6 percent one-year out. Five-year expectations, which usually show little volatility, rose a sharp three tenths to 3.2 percent.
The current conditions subcomponent of consumer sentiment held up better than expectations, slipping only 3.3 points to 83.6 from the February final reading of 86.9.
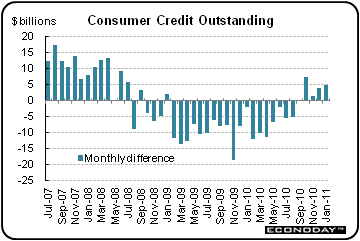 Consumers are still being cautious about pulling out the plastic although they are taking out more auto loans. Overall consumer credit outstanding rose $5.0 billion in January, following a $4.1 billion gain the prior month. The latest increase was entirely from the nonrevolving component which surged $9.3 billion in January following December's $2.1 billion gain. This component largely reflects financing for motor vehicles. Consumers are still being cautious about pulling out the plastic although they are taking out more auto loans. Overall consumer credit outstanding rose $5.0 billion in January, following a $4.1 billion gain the prior month. The latest increase was entirely from the nonrevolving component which surged $9.3 billion in January following December's $2.1 billion gain. This component largely reflects financing for motor vehicles.
Revolving credit failed to post a second month of improvement, contracting $4.2 billion in January following December's $2.0 billion gain. This category is largely credit card debt. December remains the only month that both revolving and nonrevolving credit have expanded this recovery. The weakness in revolving credit is likely still due in part to charge offs by banks. But consumer credit is slowly improving, helping the recovery gradually gain momentum.
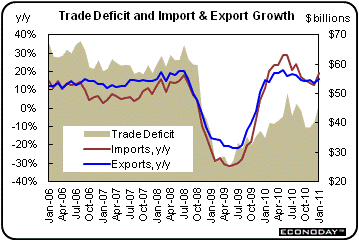 Bad sometimes is good in economic news and that likely is the case for the latest trade report. The U.S. trade deficit worsened sharply and oil had only a small role in it. But the detail in imports indicates it may be a response to healthy demand. The overall U.S. trade deficit in January widened to $46.3 billion from a revised $40.3 billion shortfall in December. Bad sometimes is good in economic news and that likely is the case for the latest trade report. The U.S. trade deficit worsened sharply and oil had only a small role in it. But the detail in imports indicates it may be a response to healthy demand. The overall U.S. trade deficit in January widened to $46.3 billion from a revised $40.3 billion shortfall in December.
The expansion of the trade deficit was led by the nonpetroleum goods gap which grew to $32.0 billion from $27.0 billion in December. The petroleum shortfall widened moderately to $26.7 billion from $25.5 billion the prior month.
Exports of goods and services gained 2.7 percent, following a 2.0 percent boost the prior month. Imports posted a huge 5.2 percent increase after rising 2.6 percent in December.
While a notable portion of the boost in oil imports was price related, much of other gains appear to be demand related. By end use categories for goods, the jump in imports was led by a $4.4 billion spike in industrial supplies but only $1.7 billion came from oil imports. Notably, capital goods imports excluding autos jumped $2.1 billion while automotive imports increased $2.7 billion. The surge in these imports may be related to meeting expected demand and this actually would be a positive sign for forward momentum although for the near term, it means a downward revision to the net export component of first quarter GDP growth estimates.
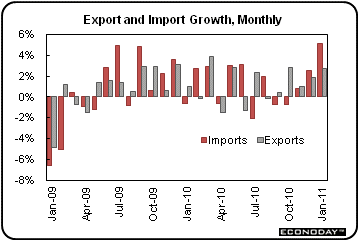 By end-use categories, the boost in goods exports was led by a $3.7 billion jump in industrial supplies with automotive exports advancing $1.3 billion. Capital goods exports slipped 0.4 billion—largely on lower aircraft shipments. Consumer goods exports edged down $0.6 billion while food, feeds & beverages were essentially unchanged. By end-use categories, the boost in goods exports was led by a $3.7 billion jump in industrial supplies with automotive exports advancing $1.3 billion. Capital goods exports slipped 0.4 billion—largely on lower aircraft shipments. Consumer goods exports edged down $0.6 billion while food, feeds & beverages were essentially unchanged.
The bottom line is that manufacturers are continuing to benefit from export growth while imports are mainly being led by sales expectations—healthy demand. And some of the imports are showing up in sizeable gains in inventories.
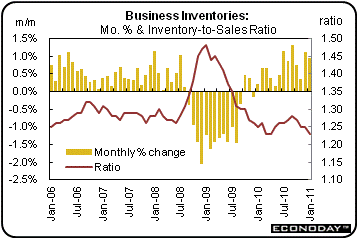 Inventory rebuilding is continuing to support the recovery. Business inventories built up fast in January, jumping 0.9 percent to make a strong start for the first quarter. What is astonishing is that despite mostly strong inventory gains in recent months, they have lagged sales. Overall business sales surged 2.0 percent in January to pull down the stock-to-sales ratio by two tenths to 1.23. This signals that inventories are too low. The inventory-to-sales ratio is not only at its lowest since well prior to the recent recession but is at the series low going back to 1980 although March and April 2010 reached the same low. Inventory rebuilding is continuing to support the recovery. Business inventories built up fast in January, jumping 0.9 percent to make a strong start for the first quarter. What is astonishing is that despite mostly strong inventory gains in recent months, they have lagged sales. Overall business sales surged 2.0 percent in January to pull down the stock-to-sales ratio by two tenths to 1.23. This signals that inventories are too low. The inventory-to-sales ratio is not only at its lowest since well prior to the recent recession but is at the series low going back to 1980 although March and April 2010 reached the same low.
Clearly, the need to add inventories will help manufacturers although some stocks will be imported. Restocking should also be a plus for hiring yet the dampening effect of high oil prices may make businesses less eager to add to their payrolls.
The consumer sector has been gaining momentum, although it is still at risk from higher energy costs. Manufacturing should continue to gain strength on exports and business needs for inventory rebuilding.
This week is loaded with major economic news. The important FOMC statement kicks off the week on Tuesday afternoon. Housing starts and producer prices take center stage at mid-week. Inflation conscious traders will be paying special attention to the CPI on Thursday. Immediately following, we get an update on manufacturing with the industrial production report. Friday is quadruple witching and could impact trading.
The Empire State manufacturing index in February rose more than 3-1/2 points to 15.43 to indicate monthly growth in overall activity at an accelerating rate. Shipments slowed but are still healthy at a reading of 11.31. Looking ahead, the March headline number should be healthy as the February new orders index decelerated slightly but still posted strong growth at 11.80.
Empire State Manufacturing Survey Consensus Forecast for March 11: 16.0
Range: 14.0 to 20.0
The FOMC announcement for the March 15 FOMC policy meeting is expected to leave the fed funds target rate unchanged at a range of zero to 0.25 percent. Fed watchers will focus on whether the statement has any language suggesting an early end to the second round of quantitative easing or whether a third round is being considered. Also, could rising concerns over inflation lead to the first dissenting vote for 2011'
FOMC Consensus Forecast for 3/15/10 policy vote on fed funds target range: unchanged at a range of zero to 0.25 percent
Housing starts in January jumped 14.6 percent after slipping 5.1 percent the month before. The January annualized pace of 0.596 million units was down 2.6 percent on a year-ago basis. The latest gain was led by a monthly 77.7 percent surge in multifamily starts, following a 10.8 percent rise the month before. The single-family component slipped 1.0 percent after declining 8.4 percent in December. Housing permits, in contrast, fell 10.4 in January after improving 15.3 percent in December. The latest decrease was led by the multifamily component which was down a monthly 23.8 percent, following a 45.7 percent surge in December. Single-family permits declined 4.8 percent after a 6.0 percent gain the prior month.
Housing starts Consensus Forecast for February 11: 0.560 million-unit rate
Range: 0.540 million to 0.590 million-unit rate
The producer price index in January posted a still strong 0.8 percent increase, following December’s revised 0.9 percent boost and 0.7 percent boost in November. At the core level, the PPI jumped 0.5 percent, following a 0.2 percent increase the month before. By components, food prices increased 0.3 percent, after a 0.8 percent boost in December. The energy component remained red hot, jumping 1.8 percent after surging 2.8 percent in December. The usual suspects were not behind the surge in the core rate. Nearly 40 percent of the January advance can be traced to the index for pharmaceutical preparations, which moved up 1.4 percent.
PPI Consensus Forecast for February 11: +0.7 percent
Range: +0.3 to +1.1 percent
PPI ex food & energy Consensus Forecast for February 11: +0.2 percent
Range: +0.1 to +0.4 percent
The consumer price index in January increased 0.4 percent, following a 0.4 percent jump in December. Excluding food and energy, CPI inflation in January posted at a 0.2 percent rise, compared December’s increase of 0.1 percent. By major components, energy increased 2.1 percent after jumping 4.0 percent in December. Gasoline rose 3.5 percent, after spiking 6.7 percent the previous month. Food price inflation picked up the pace to 0.5 percent from 0.1 percent in December. The firming in the core rate was led by a 1.0 percent jump in apparel and 2.2 percent boost in airline fares.
CPI Consensus Forecast for February 11: +0.4 percent
Range: +0.3 to +0.5 percent
CPI ex food & energy Consensus Forecast for February 11: +0.1 percent
Range: +0.1 to +0.2 percent
Initial jobless claims for the March 5 week unexpectedly jumped 26,000 to a higher-than-expected level of 397,000. The gain followed two prior weeks of sharp decreases reflected in the four-week average which rose only slightly to 392,250. A month-ago comparison still shows significant improvement of nearly 25,000. The Labor Department noted that a school break in New England, when bus drivers and other personnel are laid off, also increased claims.
Jobless Claims Consensus Forecast for 3/12/11: 385,000
Range: 380,000 to 395,000
Industrial production in January dipped 0.1 percent, following a 1.2 percent jump in December. January’s decrease was led by a 1.6 percent fall in utilities output, following a 4.1 percent spike in December. Basically, atypical winter weather has led utilities output to cause sharp swings in headline industrial production. Also for January, mining tugged down on industrial production, declining 0.7 percent in the latest month. In contrast, manufacturing output advanced 0.3 percent after a 0.9 percent jump in December. So, the key manufacturing component is doing well. Overall capacity utilization slipped in January on the decline in utilities and mining, easing to 76.1 percent in January from 76.2 percent the month before. Looking ahead, the manufacturing component of industrial production should be robust in February as production worker hours in manufacturing jumped 0.7 percent. Also, headline indexes from manufacturing surveys for ISM, Philly Fed, and New York Fed were at healthy levels.
Industrial production Consensus Forecast for February 11: +0.6 percent
Range: +0.5 to +0.9 percent
Capacity utilization Consensus Forecast for February 11: 76.5 percent
Range: 76.3 to 76.8 percent
The Conference Board's index of leading indicators slowed to 0.1 percent in January, versus 0.8 percent in December. January's biggest contributor was the yield spread reflecting low front rates and what have been rising long rates. A slowing in deliveries was the second biggest indication of future economic strength followed by the stock market and by consumer expectations, the latter having shown tangible improvement so far this year. Weighing on the index was a dip in building permits. The coincident index posted a sluggish 0.1 percent gain in January but an important question is whether severe winter weather weighed on activity, meaning that the first quarter could be stronger than suggested by initial data.
Leading indicators Consensus Forecast for February 11: +1.0 percent
Range: +0.3 to +1.2 percent
The general business conditions index of the Philadelphia Fed's Business Outlook Survey surged to 35.9 in the February reading versus January's 19.3. The latest reading was the strongest since the 37.1 level seen in January 2004. Shipments were notably strong, jumping to 35.2 from 13.4 in January and 5.2 in December. The overall outlook is good as the new orders index remained strong at 23.7 compared to 23.6 in January.
Philadelphia Fed survey Consensus Forecast for March 11: 32.0
Range: 24.0 to 38.0
Quadruple Witching
R. Mark Rogers is the author of The Complete Idiot’s Guide to Economic Indicators, Penguin Books, 2009.
Econoday Senior Writer Mark Pender contributed to this article.
|
