|
Turmoil in the Middle East and North Africa in particular were the main focus of markets. In turn, oil prices spiked, equities dipped, and Treasuries were safe haven again. But the economy muddled forward, net.
 While company announcements played a role this past week, it was news from the Middle East and North Africa that primarily moved markets, including equities. After a day off for Presidents Day, stocks fell sharply Tuesday. The big driver was a spike in oil prices as Libyan strongman Muammar Qaddafi cracked down on protesters, leading to increased violence. For the day, economic news was mixed as consumer confidence rose more than expected but Case-Shiller home prices fell. Also bumping down equities were Wal-Mart reporting sales below forecasts and Bank of America announcing a sharp increase in credit card write offs. While company announcements played a role this past week, it was news from the Middle East and North Africa that primarily moved markets, including equities. After a day off for Presidents Day, stocks fell sharply Tuesday. The big driver was a spike in oil prices as Libyan strongman Muammar Qaddafi cracked down on protesters, leading to increased violence. For the day, economic news was mixed as consumer confidence rose more than expected but Case-Shiller home prices fell. Also bumping down equities were Wal-Mart reporting sales below forecasts and Bank of America announcing a sharp increase in credit card write offs.
At midweek, economic news was positive as existing home sales posted a moderate gain. But this was outweighed by the price of WTI crude oil topping $100 per barrel, growing violence in Libya, and Hewlett-Packard’s forecasts coming in below analysts’ projections.
Stocks were mixed Thursday as oil eased from intraday trading well above the $100 mark on news that Saudi Arabia would compensate for loss of oil shipments from Libya. Also providing some support for equities were a jump in durable goods orders and a sharp drop in initial jobless claims.
Equities had a nice bounce back at the close of the week despite a below expectations revision to fourth quarter GDP. A boost in consumer sentiment played a key role plus crude oil eased a bit more though remained not far from the $100 level. And it was a really good week for Boeing as the Air Force announced that the aircraft manufacturer won a major contract to produce refueling tankers.
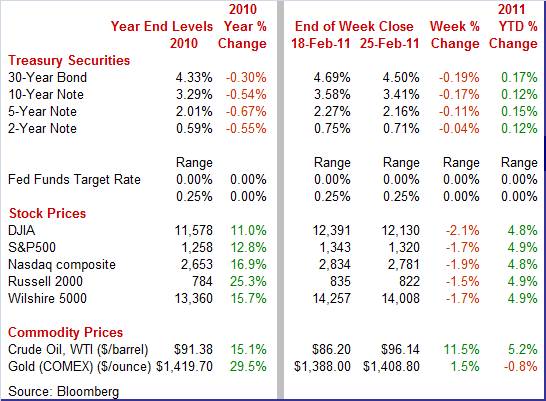
Equities were down this past week. The Dow was down 2.1 percent; the S&P 500, down 1.7 percent; the Nasdaq, down 1.9 percent; and the Russell 2000, down 1.5 percent.
For the year-to-date, major indexes are up as follows: the Dow, up 4.8 percent; the S&P 500, up 4.9 percent; the Nasdaq, up 4.8 percent; and the Russell 2000, up 4.9 percent.
Weekly percent change column reflects percent changes for all components except interest rates. Interest rate changes are reflected in simple differences.
 This past week, it was mainly flight to safety as economic news was mixed but on balance positive. Treasury yields fell sharply Tuesday as the turmoil in the Middle East and North Africa led funds into Treasuries. Also, the spike in oil prices was seen as cutting into economic growth. This past week, it was mainly flight to safety as economic news was mixed but on balance positive. Treasury yields fell sharply Tuesday as the turmoil in the Middle East and North Africa led funds into Treasuries. Also, the spike in oil prices was seen as cutting into economic growth.
Rates meandered Wednesday and Thursday but got a small bump down Friday as bond traders reacted more to the below expectations GDP number than to the favorable sentiment figure.
For this past week Treasury rates were down as follows: the 2-year note, down 4 basis points; the 5-year note, down 11 basis points; the 7-year note, down 14 basis points; the 10-year note, down 17 basis points; and the 30-year bond, down 19 basis points. However, the 3-month T-bill firmed 3 basis points;
 At the start of the trading week, the spot price for West Texas Intermediate surged more than $7 per barrel to over $93 on concern that protests and violence in Libya would disrupt oil supplies from that country. Libya declared force majeure on all oil exports, allowing producers to miss contractual obligations. At the start of the trading week, the spot price for West Texas Intermediate surged more than $7 per barrel to over $93 on concern that protests and violence in Libya would disrupt oil supplies from that country. Libya declared force majeure on all oil exports, allowing producers to miss contractual obligations.
At midweek, WTI topped $100 per barrel in intraday trading for the first time in two years on growing concern about supply from Libya but then eased on assurances from Saudi Arabia that it would boost production to fill any supply gaps.
Helping to ease oil prices were increases in margin requirements for trading Brent contracts on the ICE. Margins were raised two times—by seven percent each, bringing the total increase to 14 percent.
Net for the week, spot prices for West Texas Intermediate jumped $9.94 per barrel to settle at $96.14.
Despite a disappointing GDP revision, this past week’s highlights included some surprises on the upside for the consumer and manufacturing sectors. Housing, however, is still struggling—even reversing.
 The fourth quarter turned out to be not as strong as initially estimated. Fourth quarter GDP growth was revised down to 2.8 percent annualized growth from the advance estimate of 3.2 percent. However, the fourth quarter was still marginally healthier than the third quarter pace of 2.6 percent. The fourth quarter turned out to be not as strong as initially estimated. Fourth quarter GDP growth was revised down to 2.8 percent annualized growth from the advance estimate of 3.2 percent. However, the fourth quarter was still marginally healthier than the third quarter pace of 2.6 percent.
The downward revision to the percent change in real GDP primarily reflected an upward revision to imports (less negative) and downward revisions to state and local government spending and to personal consumption expenditures that were partly offset by an upward revision to exports. For better or for worse in the long run, cost cutting by state and local governments is currently having a negative effect on GDP growth.
Notably, demand numbers were revised down somewhat. Final sales of domestic product were bumped down to 6.7 percent from the initial estimate of 7.1 percent. Final sales to domestic purchasers (takes out net exports) were nudged down to 3.1 percent from the original estimate of 3.4 percent for the fourth quarter. Nonetheless, the revised final sales numbers indicate that there still is moderately strong demand.
Separate from the direction of revisions, some components in absolute strength are relatively healthy. PCEs came in at an annualized 4.1 percent, compared to 2.4 percent in the third quarter. Nonresidential fixed investment gained 5.3 percent in the latest period, residential investment rose modestly, and net exports improved sharply. In contrast, inventory investment slowed significantly, slicing off 3.7 percentage points from GDP growth. And government purchases declined slightly.
Looking ahead, real GDP growth may get a boost from the auto industry. This would be in contrast to the fourth quarter when motor vehicle output subtracted 0.31 percentage point from real GDP growth after adding 0.49 percentage point to third quarter growth. Automakers boosted assembly rates in January and plan higher production for Q1 than Q4.
On the inflation front, the GDP price index was little revised, coming in at 0.4 percent, compared to the initial estimate of 0.3 percent. The Commerce Departments believes a better price measure is for gross domestic purchases. This price index, which measures prices paid by U.S. residents, increased an annualized 2.1 percent in the fourth quarter, the same increase as in the advance estimate, but sharply higher than 0.7 percent in the third quarter. Excluding food and energy prices, the price index for gross domestic purchases increased 1.2 percent in the fourth quarter, compared with an increase of 0.4 percent in the third. However, the recent spike in oil prices makes the fourth quarter numbers old news.
The still moderate growth in the economy certainly explains currently sluggish growth in employment. But more recent monthly data show the recovery continuing, albeit at a moderate pace.
 Both key measures of the mood of the consumer jumped in February but it is questionable whether the better spirits hold. Both key measures of the mood of the consumer jumped in February but it is questionable whether the better spirits hold.
First, the Conference Board's index rose to 70.4 in February for the best reading in three years. January was revised more than four points higher to 64.8.
Most of the improvement was related to a better assessment of the jobs market. Fewer consumers in February said jobs are hard to get, at 45.7 percent, compared to January's 47.0 percent. Also, upward revisions were especially striking in the assessment of future income which before this report had been in unprecedented inversion, that is more saw their income decreasing than increasing. Not anymore as 17.3 percent see their income improving versus 13.8 percent seeing a decrease.
The Reuters/University of Michigan consumer sentiment index jumped sharply in February. The consumer sentiment index rose to a much higher-than-expected 77.5, up 2.4 points from the mid-month reading and implying a very strong reading of nearly 80 for the last two weeks of the month. The latest reading is a three-year high. And strength the last two weeks is centered in the leading component which is expectations. The assessment of current conditions shows little change from the mid-month reading.
Apparently consumers in the survey had their gas tanks filled up earlier than the survey as consumer inflation expectations showed no change whether looking back two weeks or four weeks. One-year inflation expectations are unchanged at 3.4 percent with five-year expectations unchanged at 2.9 percent. But recently higher crude oil prices are translating into hikes at the gas pump and the higher cost for a tank of gas could dampen consumer spirits ahead.
 In January, there was a huge divergence in direction between existing and new home sales. And price likely is the reason along with banks wanting to unload foreclosures. In January, there was a huge divergence in direction between existing and new home sales. And price likely is the reason along with banks wanting to unload foreclosures.
Existing home sales rose 2.7 percent in January to a higher-than-expected annual rate of 5.36 million units. But the median price fell sharply in the month to a nine-year low, down 5.9 percent to $158,000 for deepening year-on-year contraction of 3.7 percent. A record 32 percent of transactions in the month were in cash, possibly reflecting investors snapping up bargain properties. Distressed sales accounted for a heavy 37 percent share of total sales, pointing to why prices were so weak.
A positive in the existing homes report was a decline in supply to 7.6 months at the current sales rate from 8.2 months. Supply in unit terms fell 5.1 percent to 3.38 million.
 New home sales did not fare as well despite a decline in home prices. New home sales in January fell a sharp 12.6 percent to a lower-than-expected annual rate of 284,000 units. The latest pace is just barely above the historical low of 280,000 units sold in October 2010. New home sales did not fare as well despite a decline in home prices. New home sales in January fell a sharp 12.6 percent to a lower-than-expected annual rate of 284,000 units. The latest pace is just barely above the historical low of 280,000 units sold in October 2010.
The median price for a new home fell 1.9 percent in the month to $230,600. Despite recently weaker prices, new homes are not as competitive as prices for existing homes.
The drop in new home sales is making supply look heavier again, at 7.9 months at the current sales rate, compared to 7.0 months in December.
The bottom line is that housing is still very weak and until the pace of job creation (and job transfers) picks up, this sector is going to remain at a low level of activity.
 While the new and the existing home sales reports provide some insight into the direction of home prices, their numbers are clouded by the fact that the composition of sales (high versus low end) affects their home prices data. In contrast, the Case-Shiller and the FHFA prices indexes are based on repeat transactions. These indexes are better measures of changes in price (but there are no dollar values, just indexes). While the new and the existing home sales reports provide some insight into the direction of home prices, their numbers are clouded by the fact that the composition of sales (high versus low end) affects their home prices data. In contrast, the Case-Shiller and the FHFA prices indexes are based on repeat transactions. These indexes are better measures of changes in price (but there are no dollar values, just indexes).
And the latest S&P/Case-Shiller home price index showed further weakening, with the seasonally adjusted 10-city composite falling 0.4 percent, equaling November’s decline. The rate of year-on-year decline deepened significantly to 1.2 percent from November's year-on-year decline of 0.5 percent. On a seasonally adjusted basis, the index dropped to just above the cyclical low it hit in May of 2009.
 For homes financed by government agencies or mortgages bundled by government agencies, prices also are weak. The Federal Housing Finance Agency (FHFA) purchase only house price index declined 0.3 percent in December, following a dip of 0.3 percent the prior month. On a year-on-year basis, the FHFA HPI is down 3.3 percent, compared to down 4.6 percent in November. For homes financed by government agencies or mortgages bundled by government agencies, prices also are weak. The Federal Housing Finance Agency (FHFA) purchase only house price index declined 0.3 percent in December, following a dip of 0.3 percent the prior month. On a year-on-year basis, the FHFA HPI is down 3.3 percent, compared to down 4.6 percent in November.
The FHFA index covers just for conventional loans and with a price ceiling. The Case-Shiller index includes for homes financed with conventional and unconventional loans and with no price ceiling or floor.
Heavy supply—with attendant price competition from foreclosures--continues to depress home prices and new construction. But the economy as a whole, unlike the prior recovery, is moving forward without the housing sector.
 New factory orders for durable goods made a nice comeback in January—largely due to a surge in orders for civilian aircraft. Durables orders in January rebounded 2.7 percent, following a 0.4 percent dip in December (previously estimated at down 2.3 percent). Excluding transportation, new orders for durable goods fell back, declining 3.6 percent after a 3.0 percent rise in December and 4.6 percent boost in November. New factory orders for durable goods made a nice comeback in January—largely due to a surge in orders for civilian aircraft. Durables orders in January rebounded 2.7 percent, following a 0.4 percent dip in December (previously estimated at down 2.3 percent). Excluding transportation, new orders for durable goods fell back, declining 3.6 percent after a 3.0 percent rise in December and 4.6 percent boost in November.
Transportation led January's overall gain, spiking a monthly 27.6 percent after an 11.9 percent decrease in December. The latest increase was primarily due to a massive 4,900.0 percent (not a typo) monthly surge in nondefense aircraft orders. Essentially, the base (December’s level) for the percentage gain was miniscule.
Outside of transportation, components were mixed. Ex-transportation was led down by a 13.0 percent drop in machinery orders. Also retreating were computers & electronic parts, and electrical equipment, down 4.9 percent. Gains were seen in primary metals, fabricated metals, and "other." up 1.7 percent.
By special category, nondefense capital goods orders excluding aircraft in January fell 6.9 percent, following a 4.3 percent increase in December and a 3.3 percent rise in November. Shipments for this series slipped 2.0 percent, following a 2.5 percent increase in December.
Overall, the headline number for durables orders likely overstates current strength while the ex-transportation number for January probably overstates current month weakness. Forward momentum continues for durables manufacturing.
Despite the downward revision to fourth quarter growth, the recovery appears to be gaining modest strength though there clearly are differences by sector. Manufacturing is regaining some earlier strength and the consumer sector may be improving. However, the latter is at some risk from higher energy costs. On the downside, housing has had a mild relapse instead of continuing to heal.
We get a detailed checkup on the health of the consumer. Personal income posts Monday, motor vehicle sales are released Tuesday and jobless claims print Thursday. January's employment situation report will be closely parsed on Friday. Also garnering attention are ISM manufacturing on Tuesday and the Fed’s Beige Book on Wednesday afternoon.
Personal income in December rose 0.4 percent for the second month. Wages & salaries advanced 0.3 percent after edging up 0.1 percent in November.
Even though consumer spending was led by auto sales and higher gasoline prices, there still is broad-based strength. Personal consumption expenditures in December posted a sizeable 0.7 percent gain, following a 0.3 percent increase in November. Despite the focus by the Fed on core inflation, pressures at the headline level are rising. On the inflation front, the PCE price index jumped 0.3 percent, following a 0.1 percent uptick in November. The core rate came in unchanged after edging up 0.1 percent in November. Looking ahead, the wages & salaries component in January likely will be moderate as aggregate earning rose only 0.2 percent in January’s employment report. Personal spending should post a healthy gain based on unit new motor vehicle sales gaining 2.3 percent for the month and retail sales ex-autos rising 0.3 percent. Inflation numbers should be mixed as the January headline CPI jumped 0.4 percent while the core CPI rose 0.2 percent.
Personal income Consensus Forecast for January 11: +0.4 percent
Range: +0.2 to +1.2 percent
Personal consumption expenditures Consensus Forecast for January 11: +0.4 percent
Range: +0.3 to +0.5 percent
Core PCE price index Consensus Forecast for January 11: +0.2 percent
Range: +0.1 to +0.2 percent
The Chicago PMI gained to 68.8 in January from 66.8 the prior month. Output is surging in the area with production at 73.7. These readings are all far above breakeven 50 indicating month-to-month growth. Looking ahead, a healthy number for February is likely as new orders surged to 75.7.
Chicago PMI Consensus Forecast for February 11: 68.0
Range: 66.8 to 70.3
Sales of domestic light motor vehicles in January sold at a healthy 9.6 million rate, up 2 percent from prior month. Combined domestics and imports rose fractionally in January to a 12.6 million. For the month, sales were strongest for the cars component of domestic units, up 2.9 percent, while the weakest was for import cars, down 6.2 percent.
Motor vehicle domestic sales Consensus Forecast for February 11: 9.5 million-unit rate
Range: 9.4 to 9.6 million-unit rate
The composite index from the ISM manufacturing survey jumped 2.3 points to a rare plus 60 reading at 60.8 for the highest reading since May 2004 when the index registered 61.4 percent. The new orders index led the gain, jumping 5.8 points to 67.8—a reading that points to likely strength ahead for the composite index. The other four components of the composite also showed month-to-month acceleration including employment which is also in rare territory at 61.7 for a nearly two-point gain and the first plus-60 reading in seven years.
ISM manufacturing composite index Consensus Forecast for February 11: 60.5
Range: 58.7 to 62.0
Construction spending in November posted a gain of 0.4 percent, following a 0.7 percent boost the prior month. Strength was in private residential and public outlays.
Construction spending Consensus Forecast for December 10: -0.8 percent
Range: -1.0 to -0.3 percent
The Beige Book being prepared for the March 15 FOMC meeting will be released. The list of economic issues getting the focus of traders appears to be getting longer but key attention will be paid to hiring, consumer spending, and price pressures.
Initial jobless claims for the February 19 week fell 22,000 to 391,000. The four-week average confirmed the improvement, falling a sizable 16,500 to 402,000 for a nearly 30,000 decline from the month-ago level. The Labor Department did not cite any special factors in the data though California was partially estimated for the week.
Jobless Claims Consensus Forecast for 2/26/11: 395,000
Range: 388,000 to 405,000
Nonfarm business productivity rose an annualized 2.6 percent in the fourth quarter after gaining 2.4 percent in the prior quarter. This gain in productivity reflected increases of 4.5 percent annualized in output in the nonfarm business sector and 1.8 percent in hours worked. Unit labor costs edged down an annualized 0.6 percent in the fourth quarter, following a dip of 0.1 percent in the third quarter. Looking ahead, revisions to the fourth quarter are likely to not be favorable as fourth quarter GDP growth was just revised down to 2.8 percent from the initial estimate of 3.2 percent. Both GDP and productivity use much of the same source data for output numbers.
Nonfarm Business Productivity Consensus Forecast for revised Q4 10: 2.6 percent annual rate
Range: +2.0 to +3.0 percent annual rate
Unit Labor Costs Consensus Forecast for revised Q4 10: -0.3 percent annual rate
Range: -1.0 to -0.2 percent annual rate
Nonfarm payroll employment in January posted a minimal 36,000 increase, following a revised 121,000 gain in December and a 93,000 advance in November. The private sector barely did any better as private nonfarm payrolls increased 50,000 in January, down from a 121,000 boost the prior month. Wage gains improved in the latest month. Average hourly earnings in January rose 0.4 percent, following a 0.1 percent uptick the prior month. The average workweek for all workers posted at 34.2 hours, compared to analysts’ forecast for 34.3 hours. The unemployment rate fell to 9.0 percent from December’s unexpectedly low 9.4 percent.
Nonfarm payrolls Consensus Forecast for February 11: 180,000
Range: 120,000 to 255,000
Private payrolls Consensus Forecast for February 11: 190,000
Range: 130,000 to 275,000
Unemployment rate Consensus Forecast for February 11: 9.1 percent
Range: 8.9 to 9.3 percent
Average workweek Consensus Forecast for February 11: 34.3 hours
Range: 34.3 to 34.4 hours
Average hourly earnings Consensus Forecast for February 11: +0.2 percent
Range: 0.0 to +0.2 percent
Factory orders rose 0.2 percent in December as price-related gains in non-durable goods offset a monthly aircraft-related downswing for durable goods. More recently, durables orders in January rebounded 2.7 percent, following a revised 0.4 percent dip in December
Factory orders Consensus Forecast for January 11: +2.0 percent
Range: +1.0 to +3.2 percent
R. Mark Rogers is the author of The Complete Idiot’s Guide to Economic Indicators, Penguin Books, 2009.
Econoday Senior Writer Mark Pender contributed to this article.
|
