|
The economy is in constant flux as various sectors wax and wane in strength. Currently, manufacturing is regaining strength while the consumer sector is taking a breather. Meanwhile, housing remains very sluggish, although there is relative strength recently in the multifamily component. Overall, equities continue an uptrend based on favorable earnings and progress in the recovery.
 Earnings and mostly favorable economic news boosted equities for the week. At the start of the week the release of President Barack Obama's budget was seen as a nonevent since there still is much committee work and other alterations to come. But stocks were lifted on optimism regarding political transition in Egypt and on a jump in Chinese exports. However, equities retreated on Tuesday as softer than expected retail sales offset a positive Empire State Manufacturing survey. The soft gain in retail sales was seen as a disappointment despite concern that adverse weather played a role in dampening sales. Earnings and mostly favorable economic news boosted equities for the week. At the start of the week the release of President Barack Obama's budget was seen as a nonevent since there still is much committee work and other alterations to come. But stocks were lifted on optimism regarding political transition in Egypt and on a jump in Chinese exports. However, equities retreated on Tuesday as softer than expected retail sales offset a positive Empire State Manufacturing survey. The soft gain in retail sales was seen as a disappointment despite concern that adverse weather played a role in dampening sales.
Earnings and the Fed took center stage at midweek. Computer maker Dell surged after profits beat analysts’ estimates and put investors in a positive mood. Also, Deere boosted its profit forecast. Later in the day the Fed's minutes showed an upgrade in its forecast for economic growth this year.
Initially Thursday, equities appeared ready to retreat for the day on a hotter than expected CPI report and a rebound in jobless claims. But a very strong Philadelphia Fed manufacturing report put traders in a positive mood, boosting equities for the day. On the final day of trading, earnings topped news from overseas. Before US open, China announced another boost in commercial banks' reserve requirement ratio to control domestic inflation. Offsetting however, was Caterpillar announcing a surge in machinery sales, lifting company shares and markets.
Overall, traders preferred to be long ahead of the three-day weekend in the U.S. Major indexes ended the week at new two-year highs.
Equities were up this past week. The Dow was up 1.0 percent; the S&P 500, up 1.0 percent; the Nasdaq, up 0.9 percent; and the Russell 2000, up 1.5 percent.
For the year-to-date, major indexes are up as follows: the Dow, up 7.0 percent; the S&P 500, up 6.8 percent; the Nasdaq, up 6.8 percent; and the Russell 2000, up 6.5 percent.
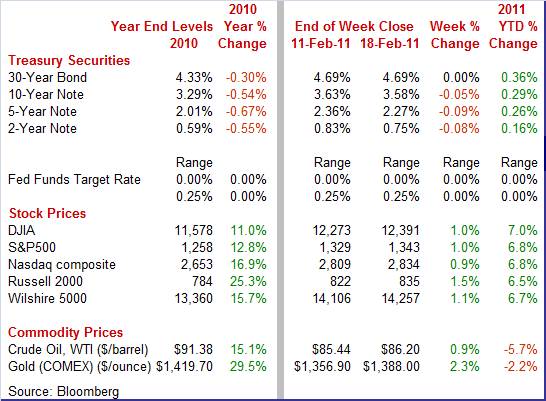
Weekly percent change column reflects percent changes for all components except interest rates. Interest rate changes are reflected in simple differences.
 Trading in bonds was relatively quiet in four of the five trading days this past week. On Thursday, however, yields fell notably. This was despite a strong CPI report and a robust Philly Fed survey. It was all about flight to safety. Investors were spooked both by news that Iran would be sending warships through the Suez Canal and by clashes between Bahrain’s police and pro-democracy protesters. Trading in bonds was relatively quiet in four of the five trading days this past week. On Thursday, however, yields fell notably. This was despite a strong CPI report and a robust Philly Fed survey. It was all about flight to safety. Investors were spooked both by news that Iran would be sending warships through the Suez Canal and by clashes between Bahrain’s police and pro-democracy protesters.
 Essentially, we are seeing two very different crosscurrents. Creating upward pressure on rates are stronger inflation numbers and continued improvement in the recovery. More than offsetting those issues this past week were geopolitical issues as political unrest in the Middle East has intensified and boosted the attractiveness of U.S. treasuries. Essentially, we are seeing two very different crosscurrents. Creating upward pressure on rates are stronger inflation numbers and continued improvement in the recovery. More than offsetting those issues this past week were geopolitical issues as political unrest in the Middle East has intensified and boosted the attractiveness of U.S. treasuries.
For this past week Treasury rates were mostly down as follows: 3-month T-bill, down 2 basis points; the 2-year note, down 8 basis points; the 5-year note, down 9 basis points; the 7-year note, down 7 basis points; and the 10-year note, down 5 basis points. The 30-year bond was unchanged.
 The spot price for crude oil rose only marginally for the past week. Initially, however, WTI declined the first two days of the week on favorable news out of Egypt and on ample supply in the U.S. Prices firmed later in the week on news of Iranian warships entering the Suez Canal and on political unrest in Bahrain. The spot price for crude oil rose only marginally for the past week. Initially, however, WTI declined the first two days of the week on favorable news out of Egypt and on ample supply in the U.S. Prices firmed later in the week on news of Iranian warships entering the Suez Canal and on political unrest in Bahrain.
Net for the week, spot prices for West Texas Intermediate were little changed at up 76 cents per barrel to settle at $86.20.
This past week the key economic updates were on consumer spending, manufacturing, housing starts, and inflation.
 The adage that one month does not make a trend very much appears to apply to retail sales. We got a soft number for January, but it's probably best understood in the context of the last several months. The adage that one month does not make a trend very much appears to apply to retail sales. We got a soft number for January, but it's probably best understood in the context of the last several months.
The consumer appears to be pausing after a robust early holiday season. Headline sales in January posted a moderate gain but it was largely due to higher gasoline prices. Overall retail sales gained 0.3 percent, following a 0.5 percent boost in December and 0.8 percent jump in November. Excluding autos, sales printed at a 0.3 percent improvement, matching the increase the month before. A large gain in gasoline station sales boosted the ex autos figure. Sales excluding autos and gasoline rose only 0.2 percent after a 0.1 percent boost in December and a 0.4 percent advance in November.
The latest sales gain was led by a 1.4 percent increase in gasoline sales with food & beverage stores up 1.3 percent and nonstore retailers up 1.2 percent. Other notable increases include a 0.8 percent advance for merchandise (which includes department stores) and a 0.5 percent boost for motor vehicles and parts. The weakest components were building materials & garden equipment, down 2.9 percent, and sporting goods, hobby, book & music stores, down 1.3 percent. Food services & drinking places fell 0.7 percent.
It's important to note that recent softening comes after very strong months during the mid-2010. For any data series, it is not unusual for strong months to be followed by sluggish months, and vice versa. The slowing in sales gains might be interpreted to mean that consumers are being careful to not overspend. This likely means that the uptrend is more sustainable. Also, sales in January likely were softened by severe winter weather in parts of the U.S. If so, then we may see strengthening in sales in February – although that month also had weather problems.
 While there are signs that the consumer sector is slowing to a more sustainable pace, there are indications that manufacturing is starting to pick up momentum. First, however, the latest report on industrial production was slightly negative at the headline level, but positive for manufacturing. While there are signs that the consumer sector is slowing to a more sustainable pace, there are indications that manufacturing is starting to pick up momentum. First, however, the latest report on industrial production was slightly negative at the headline level, but positive for manufacturing.
From January to December, key underlying detail on major components reversed position. This time a decline in utilities output masked a moderately healthy showing in the manufacturing component. Industrial production dipped 0.1 percent, following a 1.2 percent jump in December. January’s decrease was led by a 1.6 percent fall in utilities output, following a 4.1 percent spike in December. Also, mining tugged down on industrial production, declining 0.7 percent in the latest month. In contrast, manufacturing output advanced 0.3 percent after a 0.9 percent jump in December.
 Within manufacturing, output of motor vehicles and parts was up a sizeable 3.2 percent, following a 0.2 percent gain in December. Excluding autos, manufacturing edged up 0.1 percent in January after a 0.9 percent jump in December. Essentially, manufacturing is continuing a healthy uptrend with some months stronger than others.
Overall capacity utilization slipped in January on the decline in utilities and mining, easing to 76.1 percent in January from 76.2 percent the month before.
More recent manufacturing surveys point to stronger gains in manufacturing ahead.
 Manufacturing surveys from the New York Fed and especially the Philadelphia Fed show this sector improving overall. Manufacturing surveys from the New York Fed and especially the Philadelphia Fed show this sector improving overall.
For February, the Empire State general business conditions index rose more than 3-1/2 points to 15.43 to indicate monthly growth in overall activity at an accelerating rate. Details are mixed in direction.
The new orders index decelerated slightly but still posted strong growth at 11.80. Shipments slowed but are still healthy at a reading of 11.31. One reading that is disappointing is a slowing in hiring to only 3.61. However, the average workweek index rose nearly 4 points to 6.0—roughly the level it held at the end of last summer.
Rising prices are becoming more of an issue. More manufacturers are seeing both higher input prices and selling prices. However, upward pressure for prices received is much more subdued. The prices paid measure surged 10 points—its third consecutive monthly gain—to reach 45.8, its highest level since August 2008. The index for prices received, in contrast, moved up only slightly, to 16.9.
 Manufacturing in the mid-Atlantic region is showing even greater improvement. The Philly Fed's headline index for general business activity, which is not a composite of components but simply the sample's subjective assessment of general business conditions, surged to 35.9 in the February reading versus January's 19.3. The latest reading is the strongest since the 37.1 level seen in January 2004. Shipments were notably strong, jumping to 35.2 from 13.4 in January and 5.2 in December.
In contrast to the New York Fed report, the Philly Fed showed notably improving labor market conditions. The current employment index increased 6 points to 23.6. Also, the average workweek index rose to 12.8 from 10.6 month before. The overall outlook is good as the new orders index remained strong at 23.7 compared to 23.6 in January.
Price pressures are also showing up in the mid-Atlantic region. The prices paid index jumped to 67.2 from 54.3 in January. More manufacturers are finding they are able to pass along costs as the prices received index rose to 21.0 from 17.1. The prices received index has steadily increased over the past four months.
 A huge caveat to remember when interpreting recent housing numbers is that the base is low. Because activity is so anemic, it's not hard to get big monthly percentage changes. This is the case for housing starts in January. A huge caveat to remember when interpreting recent housing numbers is that the base is low. Because activity is so anemic, it's not hard to get big monthly percentage changes. This is the case for housing starts in January.
The latest report is mixed as starts advanced while permits fell back. Housing starts in January jumped 14.6 percent after slipping 5.1 percent the month before. The January annualized pace of 0.596 million units is down 2.6 percent on a year-ago basis. January’s pace is the highest since 0.601 million seen in September 2010. The latest gain was led by a monthly 77.7 percent surge in multifamily starts, following a 10.8 percent rise the month before. The single-family component slipped 1.0 percent after declining 8.4 percent in December.
Housing permits, in contrast, fell 10.4 in January after improving 15.3 percent in December. Overall permits came in at an annualized rate of 0.562 million units and are down 10.7 percent on a year-ago basis. The latest decrease is led by the multifamily component which was down a monthly 23.8 percent, following a 45.7 percent surge in December. Single-family permits declined 4.8 percent after a 6.0 percent gain the prior month.
Strength (albeit soft strength) appears to be in the multifamily component. On a year ago basis, multifamily permits are up 17.5 percent, while single-family permits are down 17.3 percent. Homebuilders are still very cautious about the single-family sector with inventory overhang still high. The bottom line is that housing is still anemic although some apparently are a little optimistic about the multifamily sector.
 Headline CPI inflation continues its trend of outpacing core inflation—largely on strong gains in energy costs but with food price hikes also contributing. The CPI in January increased 0.4 percent, following a 0.4 percent jump in December. Excluding food and energy, CPI inflation in January posted at a 0.2 percent rise, compared December’s increase of 0.1 percent. Headline CPI inflation continues its trend of outpacing core inflation—largely on strong gains in energy costs but with food price hikes also contributing. The CPI in January increased 0.4 percent, following a 0.4 percent jump in December. Excluding food and energy, CPI inflation in January posted at a 0.2 percent rise, compared December’s increase of 0.1 percent.
 By major components, energy increased 2.1 percent after jumping 4.0 percent in December. Gasoline rose 3.5 percent, after spiking 6.7 percent the previous month. Food price inflation picked up the pace to 0.5 percent from 0.1 percent in December. Hikes in energy commodities and food accounted for over two thirds of the all items increase.
The firming in the core rate was led by a 1.0 percent jump in apparel and 2.2 percent boost in airline fares. Medical care commodities gained 0.5 percent. On the more moderate side, the shelter index rose 0.1 percent in January, with the rent index increasing 0.2 percent and the index for owners’ equivalent rent rising 0.1 percent.
The bottom line is that both overall and core inflation at the consumer level are turning up from previously low rates. Year-on-year, overall CPI inflation increased to 1.7 (seasonally adjusted) from 1.4 percent in December. The core rate rose to 0.9 percent from 0.6 percent on a year-ago basis. These are still below the upper range of the Fed's inflation target, but the pressure should start to create concern within the Fed.
Not only is inflation picking up at the consumer level but also upstream at the producer level for both  headline and core numbers. The overall PPI inflation rate posted a still strong 0.8 percent increase, following December’s revised 0.9 percent boost and 0.7 percent jump in November. At the core level, the PPI jumped 0.5 percent, following a 0.2 percent increase the month before. headline and core numbers. The overall PPI inflation rate posted a still strong 0.8 percent increase, following December’s revised 0.9 percent boost and 0.7 percent jump in November. At the core level, the PPI jumped 0.5 percent, following a 0.2 percent increase the month before.
 By components, food prices increased 0.3 percent, after a 0.8 percent boost in December. The energy component remained red hot, jumping 1.8 percent after surging 2.8 percent in December. The usual suspects were not behind the surge in the core rate. Nearly 40 percent of the January advance can be traced to the index for pharmaceutical preparations, which moved up 1.4 percent. Higher prices for plastic products also contributed to the rise in the finished core index. The usual suspects were relatively tame. Passenger car prices dipped 0.1 percent while light trucks rose a moderate 0.2 percent. And tobacco edged up only 0.1 percent. By components, food prices increased 0.3 percent, after a 0.8 percent boost in December. The energy component remained red hot, jumping 1.8 percent after surging 2.8 percent in December. The usual suspects were not behind the surge in the core rate. Nearly 40 percent of the January advance can be traced to the index for pharmaceutical preparations, which moved up 1.4 percent. Higher prices for plastic products also contributed to the rise in the finished core index. The usual suspects were relatively tame. Passenger car prices dipped 0.1 percent while light trucks rose a moderate 0.2 percent. And tobacco edged up only 0.1 percent.
For the overall PPI, the year-on-year rate slipped to 3.7 percent from 4.1 percent in December (seasonally adjusted). The core rate edged up to 1.6 percent from 1.4 the previous month.
It is not uncommon for a recovery to wax or wane in strength. After a moderately strong gain in the fourth quarter, there are signs that the first quarter is slowing a bit, according to composite indicators.  Growth in the Conference Board's index of leading indicators slowed to 0.1 percent in January, versus 0.8 percent in December. Growth in the Conference Board's index of leading indicators slowed to 0.1 percent in January, versus 0.8 percent in December.
January's biggest contributor was the yield spread reflecting low front rates and what have been rising long rates. A slowing in deliveries was the second biggest indication of future economic strength followed by the stock market and by consumer expectations, the latter having shown tangible improvement so far this year.
Weighing on the index was a dip in building permits. Building permits were the leading contributor to December's index but subtracted the most in January. Earlier, permit volume was boosted by changes in laws in some localities that led to a jump in applications to beat more stringent regulations taking effect. The second most negative component was initial jobless claims.
Specifically pointing to softer current quarter was a marginal 0.1 percent gain for the coincident index. However, an important question is whether severe winter weather weighed on activity, meaning that the first quarter could be stronger than suggested by initial data.
Overall, we are seeing some shifting in relative strength in economic growth. Manufacturing appears to be regaining some strength. The consumer sector is pausing to maintain balanced growth. Housing is still struggling with excess inventories for single-family housing, but the multifamily component may be on a very modest uptrend. The first quarter is getting off to a net sluggish start, but it could end up stronger if January weakness was largely weather related.
Monday is Presidents' Day and markets are closed in U.S. However, there is a plethora of updates on the consumer, housing, and manufacturing sectors. The mood of the consumer measured by consumer confidence and by sentiment is posted on Tuesday and Friday, respectively. Existing home sales are released Wednesday while new home sales hit the wires Thursday. Durables orders also are parsed by the markets on Thursday. Finally, we get an update on GDP on Friday with Commerce’s second estimate.
U.S Holiday: Presidents’ Day
The Conference Board's consumer confidence index jumped more than seven points in January to 60.6 with those saying jobs are currently hard to get falling more than 2-1/2 percentage points to 43.4 percent for the best reading in two years.
Consumer confidence Consensus Forecast for February 11: 65.0
Range: 60.0 to 70.0
Existing home sales in December surged 12.3 percent to an annual rate of 5.280 million. Details show even strength across regions and a big draw down in supply to 8.1 months from November's 9.5 months. Home prices slipped in the month, down nearly one percent to a median $168,800. Rising mortgage rates appear to be encouraging potential buyers to actually close the deal but atypically adverse weather in January may have slowed sales for that month.
Existing home sales Consensus Forecast for January 11: 5.25 million-unit rate
Range: 5.00 to 5.39 million-unit rate
Durable goods orders unexpectedly dropped a revised 2.3 percent, following a 0.1 percent dip the month before. Weakness was primarily in nondefense aircraft orders. Excluding transportation, new orders for durable goods were more favorable, advancing 0.5 percent after a 4.5 percent surge in November. The headline number was tugged down by the transportation component which fell a monthly 12.8 percent in December after declining 13.1 percent the month before. The latest decrease was mainly in nondefense aircraft.
New orders for durable goods Consensus Forecast for January 11: +3.0 percent
Range: +2.0 percent to +6.0 percent
Initial jobless claims for the February 12 week rose a steep 25,000 to 410,000. However, claims have been volatile in recent weeks. The latest jump followed a 34,000 drop the prior week and a 38,000 fall the week before that. Off and on severe winter weather has played a role in the volatility. The four-week average rose 1,750 in the latest week to 417,750 to show no significant change from mid-January.
Jobless Claims Consensus Forecast for 2/19/11: 405,000
Range: 375,000 to 415,000
New home sales for December jumped 18 percent to an annual unit rate of 329,000. In turn, months’ supply came down to 6.9 from 8.4 months in November. The buyer rush likely was tied to December's jump in mortgage rates which encouraged potential homebuyers to quit sitting on the fence and commit to a purchase. The spurt in sales resulted in the median sales price to jump 12 percent to $241,500. However, sales in the low end price range may have been damped by recent court rulings on robo-signings of foreclosure documents.
New home sales Consensus Forecast for January 10: 310 thousand-unit annual rate
Range: 280 thousand to 340 thousand-unit annual rate
GDP for the fourth quarter GDP accelerated to a moderately healthy 3.2 percent annualized gain, following a 2.6 percent increase the prior quarter. But the detail was stronger than the headline number. The last quarter of 2010 was led by sharp improvement in net exports to a gap of $392.2 billion from $505.0 billion in the third quarter. Notably, personal consumption expenditures were up an annualized 4.4 percent, coming in much stronger than the third quarter rise of 2.4 percent. Weakness was led by a sharp slowing in inventory investment to $7.2 billion from $121.4 billion in the third quarter. Economy-wide inflation as measured by the GDP price index softened to 0.3 percent in the fourth quarter, following a 2.1 percent increase the prior quarter. But the price weakness is due to technical peculiarities in how exports and imports interact in the GDP price index with imports being a subtraction. The preferred headline measure according to the Commerce Department is the price index for gross domestic purchases—which excludes exports and imports. The price index for gross domestic purchases firmed significantly to 2.1 percent from 0.7 percent in the third quarter.
Real GDP Consensus Forecast for second estimate Q4 10: +3.4 percent annual rate
Range: +3.2 to +3.6 percent annual rate
GDP price index Consensus Forecast for second estimate Q4 10: +0.3 percent annual rate
Range: +0.3 to +0.3 percent annual rate
The Reuter's/University of Michigan's Consumer sentiment index for the mid-February reading rose 0.9 points from January to 75.1. This was only about one point shy of its mid-year 2010 recovery high in June but significantly above its recession low of 55.3 in November 2008. The two components, however, were mixed. The assessment of current conditions advanced to a reading of 86.8 from 81.8 in January. The expectations component was less positive, showing a decline to 67.6 at mid-month from January final at 69.3.
Consumer sentiment Consensus Forecast for final February 11: 75.1
Range: 74.8 to 76.5
R. Mark Rogers is the author of The Complete Idiot’s Guide to Economic Indicators, Penguin Books, 2009.
Econoday Senior Writer Mark Pender contributed to this article.
|
