|
Despite the continued spotlight on Egypt, equities largely focused on the fundamentals of healthy earnings and further signs of growing economic momentum. Nonetheless, stocks were cheered at week’s close by the resignation of Egyptian President Hosni Mubarak.
 Equities trended higher this past week, ending with moderate gains. Merger mania got the week off to a good start with Danaher Corp. agreeing to acquire laboratory equipment maker Beckman Coulter and with Berkshire Hathaway adding to its share of ownership in Wesco Financial Corp. Separately, consumer credit growth was unexpectedly strong for December, indicating greater willingness by consumers to spend. Stocks on Tuesday were lifted by favorable chain store reports and an unexpectedly strong report on business optimism from the National Federation of Independent Business. Equities trended higher this past week, ending with moderate gains. Merger mania got the week off to a good start with Danaher Corp. agreeing to acquire laboratory equipment maker Beckman Coulter and with Berkshire Hathaway adding to its share of ownership in Wesco Financial Corp. Separately, consumer credit growth was unexpectedly strong for December, indicating greater willingness by consumers to spend. Stocks on Tuesday were lifted by favorable chain store reports and an unexpectedly strong report on business optimism from the National Federation of Independent Business.
At mid-week, stocks mostly slipped back on profit taking. Fed Chairman Ben Bernanke spoke before Congress but his remarks were seen as nothing new and did not move stocks.
Equities were mixed on Thursday despite a sharp drop in initial unemployment claims. Investors tried to understand the meaning and impact of developments in Egypt as Egyptian President Hosni Mubarak delegated powers to his vice president. This fell short of expectations for Egyptian protesters and others who thought Mubarak would be resigning immediately on Thursday.
Stocks were boosted on Friday when Mubarak, under pressure from rising numbers of protestors for reform, did resign, giving day-to-day control of the government to a military council.
Equities were up this past week. The Dow was up 1.5 percent; the S&P 500, up 1.4 percent; the Nasdaq, up 1.4 percent; and the Russell 2000, up 2.7 percent.
For the year-to-date, major indexes are up as follows: the Dow, up 6.0 percent; the S&P 500, up 5.7 percent; the Nasdaq, up 5.9 percent; and the Russell 2000, up 4.9 percent.
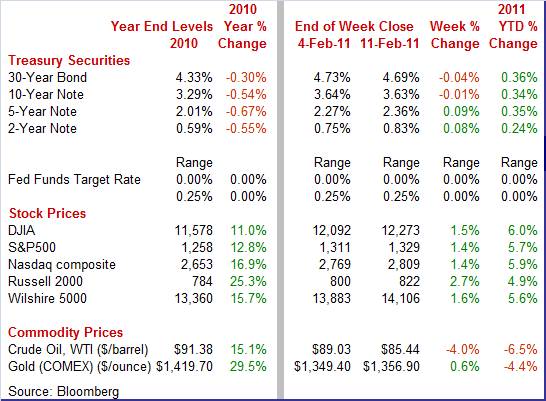
Weekly percent change column reflects percent changes for all components except interest rates. Interest rate changes are reflected in simple differences.
 Treasury yields ended the week mixed although after notable daily movements during the week. There was a significant swing up on Tuesday after the Treasury’s auction of $32 billion in 3-year notes couldn't pull in demand from foreign buyers, leaving primary dealers a huge percentage of the auction. Also, a stronger measure of business optimism (NFIB) helped bump rates up. Treasury yields ended the week mixed although after notable daily movements during the week. There was a significant swing up on Tuesday after the Treasury’s auction of $32 billion in 3-year notes couldn't pull in demand from foreign buyers, leaving primary dealers a huge percentage of the auction. Also, a stronger measure of business optimism (NFIB) helped bump rates up.
Yields eased at mid-week as bond traders apparently read more into Fed Chairman Bernanke’s remarks than stock traders. His comments that unemployment is going to remain high for some time were seen as keeping rates low. Also, the Treasury’s auction of 10-year notes went much better than Tuesday’s auction.
Rates firmed on Thursday in reaction to an unexpectedly strong dip in jobless claims. On Friday, yields mostly dipped after Egyptian President Mubarak stepped down from power. This was seen as an easing of risk.
For this past week Treasury rates were mixed as follows: 3-month T-bill, down 4 basis points; the 2-year note, up 8 basis points; the 5-year note, up 9 basis points; the 7-year note, up 3 basis points; the 10-year note, down 1 basis point; and the 30-year bond, down 4 basis points.
 The spot price of crude declined notably this past week. The biggest daily drop was Monday after talks in Egypt between the government and opposition leaders reduced tensions and also eased fears of the Suez Canal being blocked. The spot price of crude declined notably this past week. The biggest daily drop was Monday after talks in Egypt between the government and opposition leaders reduced tensions and also eased fears of the Suez Canal being blocked.
The next day, a rate hike by the People’s Bank of China nudged crude down. On the last day of the week, the handing over of power by Egyptian President Mubarak to a military council led crude down again as fears of violence in the country faded.
Net for the week, spot prices for West Texas Intermediate dropped $3.59 per barrel to settle at $85.44.
There was limited economic news in the U.S. Highlights were on the consumer sector and on international trade.
 Consumers have done their share to support the recovery despite high unemployment. But a little more help from this sector would be welcome and the latest consumer sentiment report suggests that the consumer is a little more likely to take on a bigger role—if only slightly bigger. Consumers have done their share to support the recovery despite high unemployment. But a little more help from this sector would be welcome and the latest consumer sentiment report suggests that the consumer is a little more likely to take on a bigger role—if only slightly bigger.
The Reuters/University of Michigan consumer sentiment index rose nearly 0.9 points from January to 75.1 for the mid-month February reading. This is only about one point shy of its mid-year 2010 recovery high in June but significantly above its recession low of 55.3 in November 2008.
The two components, however, were mixed. The assessment of current conditions advanced to a reading of 86.8 from 81.8 in January. The expectations component was less positive, showing a decline to 67.6 at mid-month from January final at 69.3.
No change in inflation expectations was a clear positive and is a surprise given the recent rise in gasoline prices and talk of increases ahead for food prices.
In sum, the report is more positive than negative and shows a moderate re-strengthening of the consumer sector after the slippage seen in mid-2010.
 The recent recession saw a very unusual unwinding of consumer credit outstanding as consumers paid down credit card debt and banks had severe hemorrhaging from charge offs on bad credit. But now there is a sign that consumers as a whole have decided that credit has been repaired significantly—enough to actually pull out the plastic and spend. The recent recession saw a very unusual unwinding of consumer credit outstanding as consumers paid down credit card debt and banks had severe hemorrhaging from charge offs on bad credit. But now there is a sign that consumers as a whole have decided that credit has been repaired significantly—enough to actually pull out the plastic and spend.
In December, consumer credit rose $6.1 billion showing, for the  first time in the recovery, gains for both revolving and non-revolving credit. Revolving credit, up $2.3 billion, rose for the first time in 27 months. Non-revolving credit, reflecting strength in vehicle sales, extended its run of strength with a gain of $3.8 billion. The rise in revolving credit is important, reflecting the strength of the holiday shopping season and the new confidence among consumers to finance their purchases once again with their cards. Stabilization—though not strength—in the labor market certainly has helped along with consumers feeling better about having reduced their outstanding balances. first time in the recovery, gains for both revolving and non-revolving credit. Revolving credit, up $2.3 billion, rose for the first time in 27 months. Non-revolving credit, reflecting strength in vehicle sales, extended its run of strength with a gain of $3.8 billion. The rise in revolving credit is important, reflecting the strength of the holiday shopping season and the new confidence among consumers to finance their purchases once again with their cards. Stabilization—though not strength—in the labor market certainly has helped along with consumers feeling better about having reduced their outstanding balances.
There are other signs of improvement in consumer financial health—though there still is plenty of room for consumers to be even more fit. According to Standard & Poor’s, credit card delinquency rates have come down from recent highs. The one-month delinquency rate was down to 4.50 percent in October from a recent high of 6.2 percent in March 2009. The three-month rate for October stood at 2.40 percent compared to 3.20 percent in February 2010.
Bank charge-off rates hit a cycle high of 6.7 percent in the second quarter of 2010 but eased to 5.3 percent the following quarter.
The bottom line is that consumer financial health still has a ways to go to return to normalcy but recent improvement will help bolster the recovery.
 The recent improvement in the trade deficit did not last long. Higher oil prices led to a reversal and worsening in the trade gap in December. However, exports posted a solid gain for the month and excluding oil, the deficit actually narrowed notably. The overall U.S. trade deficit in December grew to $40.6 billion from an unrevised $38.3 billion deficit the prior month. The recent improvement in the trade deficit did not last long. Higher oil prices led to a reversal and worsening in the trade gap in December. However, exports posted a solid gain for the month and excluding oil, the deficit actually narrowed notably. The overall U.S. trade deficit in December grew to $40.6 billion from an unrevised $38.3 billion deficit the prior month.
 By components, exports rose 1.8 percent, following a 1.0 percent gain in November. Imports jumped 2.6 percent after increasing 0.8 percent the month before. For exports, the increase was led by capital goods excluding autos and by industrial supplies. The gain in imports was largely the result of a jump in industrial supplies which include oil. By components, exports rose 1.8 percent, following a 1.0 percent gain in November. Imports jumped 2.6 percent after increasing 0.8 percent the month before. For exports, the increase was led by capital goods excluding autos and by industrial supplies. The gain in imports was largely the result of a jump in industrial supplies which include oil.
The widening of the trade deficit came from the petroleum gap which expanded to $25.3 billion from $20.1 billion in November. In contrast, the nonpetroleum goods differential shrank to $27.2 billion from $30.4 billion the month before.
On a technical note, December’s wider trade gap will nudge down the estimate for fourth quarter GDP as the real deficit widened to $46.0 billion in December from $45.2 billion the prior month.
While the larger overall trade gap is not good for overall economic growth, at least the boost in exports is a positive for U.S. manufacturers. There was little initial reaction in the markets to the report.
We are seeing some improvement in the health of the consumer sector and this adds to momentum—albeit modest—for the recovery. Hard won gains in the trade sector from a relatively weak dollar, however, are being eroded by high oil imports.
Markets have much to digest, first focusing on the consumer sector with retail sales on Tuesday. At mid-week, housing and manufacturing are highlighted with housing starts and industrial production. Bond traders will be sensitive to inflation numbers for the PPI on Wednesday and CPI on Thursday. Also, the Fed’s FOMC meeting minutes—which include an update on the Fed’s economic forecasts— will be heavily scrutinized Wednesday afternoon.
Retail sales in December rose 0.6 percent after jumping 0.8 percent the month before. A key source of strength in recent months has been autos which advanced 1.1 percent in December, following gains of 0.2 percent in November and 5.4 percent in October. For the latest month, excluding autos, sales were not quite as strong, rising 0.5 percent, following a 1.0 percent surge in November. Sales excluding autos and gasoline rose a moderate 0.4 percent after a 0.6 percent increase in November.
Retail sales Consensus Forecast for January 11: +0.5 percent
Range: -0.5 to +1.0 percent
Retail sales excluding motor vehicles Consensus Forecast for January 11: +0.5 percent
Range: -1.5 to +1.0 percent
The Empire State manufacturing index in January rose 2.03 points to 11.92, a reading well over the breakeven zero level. A jump in the new orders index to 12.39 from 2.03 in December suggests further improvement in the report for February.
Empire State Manufacturing Survey Consensus Forecast for February 11: 15.0
Range: 11.0 to 20.0
Business inventories in November rose 0.2 percent. Retail inventories were little changed. Meanwhile, factory inventories showed a solid 0.8 percent build as wholesale inventories declined 0.2 percent. More recently, factory inventories jumped 1.1 percent in December while wholesale inventories grew 1.0 percent, pointing to a healthy gain in overall inventories unless there is a sharp draw at the retail level.
Business inventories Consensus Forecast for December 10: +0.7 percent
Range: +0.4 to +1.0 percent
Housing starts declined in December while permits gained. Housing starts in December slipped back 4.3 percent, following a 3.8 percent rebound in November. The reversal in December was led by a 9.0 percent drop in single-family starts, following a 5.8 percent gain the month before. The multifamily component rebounded 17.9 percent after declining 5.0 percent in November. But severe weather in the Midwest and Northeast likely limited the ability of construction companies to get the bulldozers moving and start breaking ground. Housing permits, in contrast, made a 16.7 percent comeback in December after declining 1.4 percent in November.
Housing starts Consensus Forecast for January 11: 0.540 million-unit rate
Range: 0.510 million to 0.550 million-unit rate
The producer price index for December came in with a 1.1 percent boost after jumping 0.8 percent in November. At the core level, the PPI rate slowed to 0.2 percent from a 0.3 percent rebound the prior month. By components, food prices gained 0.8 percent, after a 1.0 percent jump in November. The energy component continued a strong upward trend, surging 3.7 percent in December after rising 2.1 percent the prior month. Within energy, gasoline spiked 6.4 percent after jumping 4.7 percent in November. The core was kept somewhat soft in part by a 0.4 percent decline in prices for passenger cars.
PPI Consensus Forecast for January 11: +0.7 percent
Range: +0.3 to +1.2 percent
PPI ex food & energy Consensus Forecast for January 11: +0.2 percent
Range: +0.1 to +1.3 percent
Industrial production in December posted a healthy 0.8 percent gain, following a 0.3 percent rebound in November. However, the boost was led by a monthly 4.3 percent surge in utilities output, following a 1.5 percent increase in November. Utilities were up on atypically cold weather in the East. Nonetheless, manufacturing increased a healthy 0.4 percent after a 0.3 percent rise in November. Overall capacity utilization continued to improve, rising to 76.0 percent in December from 75.0 percent in November. Looking ahead, the headline number for industrial production in January likely will not get as much lift (if not a partial reversal) from the utilities component. There are mixed results for earlier released data with some forecasting content for the manufacturing component of industrial production. Production worker hours for this sector were flat in January. In contrast, manufacturing surveys were strong with ISM, Philly Fed, and Empire State all well into positive territory.
Industrial production Consensus Forecast for January 11: +0.5 percent
Range: -0.8 to +0.7 percent
Capacity utilization Consensus Forecast for January 11: 76.3 percent
Range: 75.2 to 76.5 percent
The Minutes of the January 25-26 FOMC meeting are scheduled for release at 2:00 p.m. ET. The meeting's statement was similar to that from December, giving Fed watchers little new news to digest. But the minutes are likely to go into more detail into plans for completing QE2. And the Fed releases its latest update on its economic forecasts.
The consumer price index in December jumped 0.5 percent, following a modest 0.1 percent rise the month before. The December boost was the largest since a 0.7 percent surge in June 2009. Excluding food and energy, CPI inflation came in at 0.1 percent, equaling the rise for November. By major components, energy jumped 4.6 percent, following a 0.2 percent rise in November. Gasoline spiked a monthly 8.5 percent, following a 0.7 percent increase the prior month. Food price inflation actually slowed to 0.1 percent from 0.2 percent in November. As in recent months, shelter helped keep the core rate soft with weakness in motor vehicles also contributing in the latest month.
CPI Consensus Forecast for January 11: +0.3 percent
Range: +0.1 to +0.4 percent
CPI ex food & energy Consensus Forecast for January 11: +0.1 percent
Range: 0.0 to +0.2 percent
Initial jobless claims for the February 5 week showed a steep 36,000 decline to 383,000 for the lowest total in 2-1/2 years. The Labor Department said weather effects, which delay the filing and processing of claims, are unwinding. But it is not clear that the latest week was not affected by severe storms in the Midwest and Northeast. There could be a bump up in applications for the week of the 12th if those with pink slips could not file a claim the prior week due to bad weather.
Jobless Claims Consensus Forecast for 2/12/11: 410,000
Range: 385,000 to 450,000
The Conference Board's index of leading indicators in December posted a second consecutive robust gain with an increase of 1.0 percent, following a 1.1 percent boost the month before. Component strength was widespread in both months. The coincident index has been advancing more slowly, coming in at plus 0.2 percent in December, following gains of 0.1 percent and 0.2 percent in the prior months.
Leading indicators Consensus Forecast for January 11: +0.2 percent
Range: 0.0 to +0.7 percent
The general business conditions index of the Philadelphia Fed's Business Outlook Survey posted at 19.3 in January indicating significant month-to-month growth though at a slightly slower pace than December's 20.8 level. Still, this index has been notably healthy for three months in a row. Looking ahead, we may see improvement in February. New orders were even more robust in January, doubling in growth to 23.6 from 10.6 in November.
Philadelphia Fed survey Consensus Forecast for February 11: 22.0
Range: 20.0 to 23.7
R. Mark Rogers is the author of The Complete Idiot’s Guide to Economic Indicators, Penguin Books, 2009.
Econoday Senior Writer Mark Pender contributed to this article.
|
