|
The just released employment situation report for January was quite a surprise with anemic job gains falling sharply below expectations. But the consumer sector is humming along nevertheless. And much of the economy is gaining strength.
 Despite political turmoil in the Middle East and a lackluster employment report, equities posted solid gains for the week. Lifting stocks were other economic news that generally beat expectations along with corporate earnings that mostly surprised on the upside. Despite political turmoil in the Middle East and a lackluster employment report, equities posted solid gains for the week. Lifting stocks were other economic news that generally beat expectations along with corporate earnings that mostly surprised on the upside.
Most of the action in stocks was during the first two days of trading. Strong numbers for personal income and spending and a robust Chicago PMI got the week off to a good start. Also getting the bulls running for the day were favorable earnings from Exxon Mobil and rising commodities prices. The energy patch was notably strong on Monday.
Stock advances were strongest on Tuesday as the ISM manufacturing report was unexpectedly robust, following similar manufacturing reports out earlier on Tuesday in China. Also boosting stocks were strong earnings from United Parcel Service. UPS is seen by many as a proxy for strength in the economy.
At close Tuesday, the Dow had breached the 12,000 mark while the S&P500 topped 1,300—both seen as key psychological trading barriers. The last time the Dow closed over 12,000 was June 2008 and the S&P500 last closed above 1,300 in August 2008.
On Wednesday, traders ignored a healthy employment figure from ADP (ADP missed badly last month projecting the Labor Department’s payroll number by heavily overestimating). Most equity indexes were down moderately on concern that political tension was worsening in Egypt and on disappointing earnings. Stocks rebounded Thursday on favorable economic news, including a sizeable drop in initial jobless claims and a jump in the ISM non-manufacturing index.
On Friday, the January payroll number came in with an anemic 36,000 rise, compared to expectations of a 140,000 boost. But many wrote off the miss to severe weather cutting into hiring. And many also took the view that other economic indicators are just too healthy to give that much credence to one month’s payroll number. Net for the week, equity gains generally were robust.
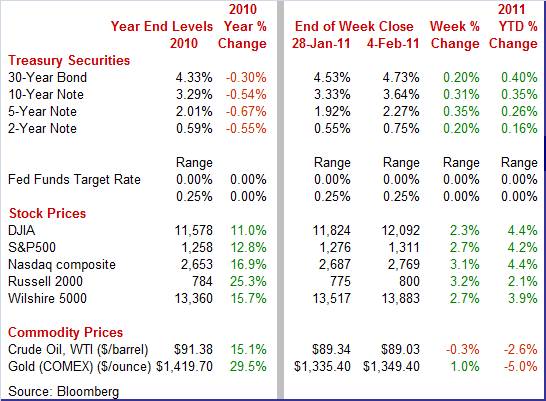
 Equities were up significantly this past week. The Dow was up 2.3 percent; the S&P 500, up 2.7 percent; the Nasdaq, up 3.1 percent; and the Russell 2000, up 3.2 percent. Equities were up significantly this past week. The Dow was up 2.3 percent; the S&P 500, up 2.7 percent; the Nasdaq, up 3.1 percent; and the Russell 2000, up 3.2 percent.
Equities were mostly up for the month of January. The Dow was up 2.7 percent; the S&P 500, up 2.3 percent; and the Nasdaq, up 1.8 percent. However, the Russell 2000 slipped 0.3 percent.
For the year-to-date, major indexes are up as follows: the Dow, up 4.4 percent; the S&P 500, up 4.2 percent; the Nasdaq, up 4.4 percent; and the Russell 2000, up 2.1 percent.
Weekly percent change column reflects percent changes for all components except interest rates. Interest rate changes are reflected in simple differences.
 Treasury yields on notes and bonds rose steadily and strongly all week. Several factors came into play. With the exception of Friday’s jobs report, economic indicators each day showed a strengthening economy. Company earnings generally topped forecasts, boosting stocks and leading bond holders to seek higher returns in equities. Finally, worries about commodity-driven inflation have been rising. Essentially, bond traders are focusing on the big picture rather than just any one economic report such as the latest and confusing report on January employment. The rise in interest rates is a vote of confidence that the recovery is gaining further traction. Treasury yields on notes and bonds rose steadily and strongly all week. Several factors came into play. With the exception of Friday’s jobs report, economic indicators each day showed a strengthening economy. Company earnings generally topped forecasts, boosting stocks and leading bond holders to seek higher returns in equities. Finally, worries about commodity-driven inflation have been rising. Essentially, bond traders are focusing on the big picture rather than just any one economic report such as the latest and confusing report on January employment. The rise in interest rates is a vote of confidence that the recovery is gaining further traction.
Rates for notes and bonds are at levels not seen in eight to 10 months. The 10-year T-bond yield, for example, closed at 3.64—the highest rate since early May 2010.
For this past week most Treasury rates were up sharply as follows: 3-month T-bill, up 1 basis point; the 2-year note, up 20 basis points; the 5-year note, up 35 basis points; the 7-year note, up 34 basis points; the 10-year bond, up 31 basis points; and the 30-year bond, up 20 basis points.
 Crude oil prices were essentially flat for the week as a whole. The spot price for West Texas Intermediate, however, did get almost a $3 per barrel boost on Monday as concern about protests in Egypt boosted crude to the week’s high of $92.19. Prices eased mostly on Tuesday and Friday. On Tuesday, unrest in Egypt was discounted on news from OPEC that it would boost production if supplies going through the Suez Canal were disrupted. Also, the American Petroleum Institute reported a rise in stockpiles of crude. Spot WTI fell again Friday in response to the anemic jobs report. Crude oil prices were essentially flat for the week as a whole. The spot price for West Texas Intermediate, however, did get almost a $3 per barrel boost on Monday as concern about protests in Egypt boosted crude to the week’s high of $92.19. Prices eased mostly on Tuesday and Friday. On Tuesday, unrest in Egypt was discounted on news from OPEC that it would boost production if supplies going through the Suez Canal were disrupted. Also, the American Petroleum Institute reported a rise in stockpiles of crude. Spot WTI fell again Friday in response to the anemic jobs report.
Net for the week, spot prices for West Texas Intermediate nudged down 31 cents per barrel to settle at $89.0.
The January employment situation report was a head scratcher as it deeply disappointed. But the numbers may be an aberration if healthy consumer spending is seen as a sign that the consumer is more optimistic about the economy than suggested by official employment numbers.
 The latest employment report came in quite mixed. Payroll jobs were disappointingly anemic while the unemployment rate unexpectedly fell sharply. Given likely special factors, the truth probably is somewhere in between. Overall payroll employment in January posted a minimal 36,000 increase, following a revised 121,000 gain in December and a 93,000 advance in November. The November and December revisions were down net 4,000. The private sector barely did little better than overall as private nonfarm payrolls increased 50,000 in January, down from a 121,000 boost the prior month. The consensus expected a 150,000 gain. The latest employment report came in quite mixed. Payroll jobs were disappointingly anemic while the unemployment rate unexpectedly fell sharply. Given likely special factors, the truth probably is somewhere in between. Overall payroll employment in January posted a minimal 36,000 increase, following a revised 121,000 gain in December and a 93,000 advance in November. The November and December revisions were down net 4,000. The private sector barely did little better than overall as private nonfarm payrolls increased 50,000 in January, down from a 121,000 boost the prior month. The consensus expected a 150,000 gain.
 For the latest month, private service-providing jobs rose 32,000 after a 146,000 increase in December. A standout subcomponent is retail trade which posted a 28,000 increase despite bad weather. Goods-producing jobs rebounded 18,000, following a 7,000 decrease in December. Manufacturing is showing a boost in momentum as jobs jumped 49,000 after a 14,000 gain the month before. Construction likely was damped by adverse weather, falling 32,000 in January, following a 17,000 decline the prior month. Mining edged up 1,000 in January. Government jobs fell 14,000, following an 18,000 drop in December. For the latest month, private service-providing jobs rose 32,000 after a 146,000 increase in December. A standout subcomponent is retail trade which posted a 28,000 increase despite bad weather. Goods-producing jobs rebounded 18,000, following a 7,000 decrease in December. Manufacturing is showing a boost in momentum as jobs jumped 49,000 after a 14,000 gain the month before. Construction likely was damped by adverse weather, falling 32,000 in January, following a 17,000 decline the prior month. Mining edged up 1,000 in January. Government jobs fell 14,000, following an 18,000 drop in December.
On a year-ago basis, overall payroll job growth rose to up 0.8 percent in January from up 0.7 percent in December.
The latest payroll survey includes annual benchmark revisions with March 2010 as the key month which is adjusted to conform to more comprehensive unemployment insurance records for that month. The level of payroll employment was revised down for March 2010 by 378,000 on an unadjusted basis and by 411,000 on a seasonally adjusted basis. Recent estimates for monthly changes (based on the monthly surveys) have been added back to take into account the new estimates for the levels, meaning the monthly patterns are similar but with lower averages.
Wage gains improved in the latest month. Average hourly earnings in January rose 0.4 percent, following a 0.1 percent uptick the prior month. The January figure topped the market median estimate for a 0.2 percent increase. Most likely, the rise in earnings was due to the jump in manufacturing employment—in a high wage sector. On a year-ago basis, average hourly earnings were up 2.3 percent, compared to 2.1 percent in December. The average workweek for all workers posted at 34.2 hours, compared to analysts’ forecast for 34.3 hours.
Turning to the household survey, the unemployment rate fell to 9.0 percent from December’s unexpectedly low 9.4 percent. The market median estimate was for 9.5 percent. The decrease was largely due to a 504,000 drop in the labor force but household employment rose moderately, up 117,000.
Looking ahead to pending releases of indicators later this month, what do the latest establishment (payroll) survey numbers suggest' We are likely to see a robust figure for the manufacturing component in industrial production as production worker hours for this sector jumped 0.6 percent. However, the wages & salaries component in personal income is likely to be sluggish as private aggregate weekly payrolls (earnings) edged up only 0.1 percent in January.
Where does the January employment report leave us in terms of overall economic momentum' First, the January numbers simply may not be that reliable due to atypically severe winter weather in parts of the U.S. Certainly construction was affected but the normal amount of hiring for the month overall likely did not take place due to the fact that it simply was difficult for applicants to make it to interviews and there likely were few human resources personnel in the office on average. And many businesses probably expected a drop in customers from the weather and delayed hiring plans.
In the other direction, the headline unemployment rate clearly is deceptive and is not really that positive given most of the decline came from a drop in the labor force. When hiring picks up, we likely will see many discouraged workers go back to actively looking for a job, meaning they are counted again in the labor force and will boost the official count of unemployed.
But there are at least two clear positives. The boost in manufacturing employment is encouraging and likely portends a general strengthening in demand for labor. Also, the boost in retail trade is suggestive of rising optimism in the business community. And the good news is that such a soft employment report came out when so many other indicators suggest that the economy is gaining strength.
 The consumer is growing more confident about spending with support coming from notable gains in income. But we are getting mixed results on inflation. The consumer is growing more confident about spending with support coming from notable gains in income. But we are getting mixed results on inflation.
Personal income in December rose 0.4 percent for the second month. Wages & salaries advanced 0.3 percent after edging up 0.1 percent in November. It has been gradual, but income growth in the aggregate has been building moderate momentum. Year on year, personal income for December came in at up 3.9 percent, compared to 3.8 percent in November.
 Even though consumer spending was led by auto sales and higher gasoline prices, there still is broad-based strength. Personal consumption expenditures in December posted a sizeable 0.7 percent gain, following a 0.3 percent increase in November. For the latest month, strength was led by nondurables, up 1.5 percent (including gasoline), with durables gaining 0.7 percent. Services advanced 0.4 percent for the month. Even though consumer spending was led by auto sales and higher gasoline prices, there still is broad-based strength. Personal consumption expenditures in December posted a sizeable 0.7 percent gain, following a 0.3 percent increase in November. For the latest month, strength was led by nondurables, up 1.5 percent (including gasoline), with durables gaining 0.7 percent. Services advanced 0.4 percent for the month.
But spending was strong even after discounting price effects. Real spending jumped 0.4 percent in December after a 0.2 percent rise the month before. This gives a healthy starting point for Q1 growth.
 Despite the focus by the Fed on core inflation, pressures at the headline level are rising. On the inflation front, the PCE price index jumped 0.3 percent, following a 0.1 percent uptick in November.
The core rate came in unchanged after edging up 0.1 percent in November. On a year-ago basis, headline PCE prices are up 1.2 percent, compared to 1.1 percent in November. Core inflation eased to 0.7 percent year-on-year versus 0.8 percent in November.
On average, consumers are seeing moderately healthy income gains which are supporting strong gains in spending. The latest report shows the consumer very much supporting recovery.
 Slow progress on the jobs front has not deterred purchases of autos from posting notable gains for more than a year. Motor vehicles sales have been on a steady uptrend since the 2009 drop off after the end of “cash for clunkers.” Sales of domestic light motor vehicles in January sold at a healthy 9.6 million rate, up 2 percent from prior month. Combined domestics and imports rose fractionally in January to a 12.6 million. For the month, sales were strongest for the cars component of domestic units, up 2.9 percent, while the weakest was for import cars, down 6.2 percent. Slow progress on the jobs front has not deterred purchases of autos from posting notable gains for more than a year. Motor vehicles sales have been on a steady uptrend since the 2009 drop off after the end of “cash for clunkers.” Sales of domestic light motor vehicles in January sold at a healthy 9.6 million rate, up 2 percent from prior month. Combined domestics and imports rose fractionally in January to a 12.6 million. For the month, sales were strongest for the cars component of domestic units, up 2.9 percent, while the weakest was for import cars, down 6.2 percent.
January’s total sales are well above the 9.4 million unit pace seen in September 2009, the month after the “cash for clunkers” peak of 14.2 million units for August 2009.
To highlight the gaining strength by automakers, for January 2011 over January 2010, the leading boost in sales by majors are General Motors, up 22.7 percent; Chrysler, up 22.7 percent; Ford, up 13.2 percent; Toyota U.S.A., up 17.3; and Nissan NA, up 14.8 percent.
 Momentum appears to be building in manufacturing according to the latest ISM report. The ISM composite index jumped 2.3 points to a rare plus 60 reading at 60.8 for the highest reading since May 2004 when the index registered 61.4 percent. The new orders index led the gain, jumping 5.8 points to 67.8—a reading that points to likely strength ahead for the composite index. The other four components of the composite also show month-to-month acceleration including employment which is also in rare territory at 61.7 for a nearly two-point gain and the first plus-60 reading in seven years. Momentum appears to be building in manufacturing according to the latest ISM report. The ISM composite index jumped 2.3 points to a rare plus 60 reading at 60.8 for the highest reading since May 2004 when the index registered 61.4 percent. The new orders index led the gain, jumping 5.8 points to 67.8—a reading that points to likely strength ahead for the composite index. The other four components of the composite also show month-to-month acceleration including employment which is also in rare territory at 61.7 for a nearly two-point gain and the first plus-60 reading in seven years.
The ISM report indicated that manufacturing is getting a boost by global demand. The strength of activity in part reflects rising prices with input prices which jumped nine points to a hot plus-80 reading at 81.5. The gain reflects rising prices for energy, metals and chemicals. Other readings include a big surge in backlog orders and in new export orders.
 Not only is the manufacturing sector accelerating, but so is non-manufacturing. January's ISM non-manufacturing results were very similar to its report on the manufacturing. Gains were widespread and convincing. The composite index jumped 2.3 points 59.4, a recovery best. Not only is the manufacturing sector accelerating, but so is non-manufacturing. January's ISM non-manufacturing results were very similar to its report on the manufacturing. Gains were widespread and convincing. The composite index jumped 2.3 points 59.4, a recovery best.
Details show especially strong monthly acceleration for the new orders index to 64.9 from 61.4 in December. These readings point to greater acceleration for the broad economy in the months ahead.
 The employment indexes in both the manufacturing and non-manufacturing ISMs have garnered increased attention. And their readings are what help make the latest employment situation report somewhat baffling. Both ISMs show significant improvement in employment in recent months. The employment indexes in both the manufacturing and non-manufacturing ISMs have garnered increased attention. And their readings are what help make the latest employment situation report somewhat baffling. Both ISMs show significant improvement in employment in recent months.
The manufacturing series is particularly strong, rising to 61.7 from 58.9 in December. January’s reading reflected the 16th consecutive month of growth in manufacturing employment. For the latest month, while strength was broad based, the largest gains were seen in apparel; leather & allied products; wood products; petroleum & coal products; and primary metals.
For non-manufacturing, the employment index improved to 54.5, reflecting a 1.9 point gain in January. The industries reporting an increase in employment in January — listed in order — are: management of companies & support services; mining; other services; information; transportation & warehousing; and retail trade.
Despite the weak jobs report for January, most indicators are showing a strengthening in the economy. And there even are signs outside of the BLS monthly report that hiring is picking up.
The consumer is the focus this week. On Monday, consumer credit data will give insight on willingness to spend. Jobless claims will get closer scrutiny Thursday after last week’s disappointing employment situation and consumer sentiment is updated Friday. Also at the end of the week, investors will be watching the international trade report to see if export growth continues. They also will check on likely higher oil prices and the impact on imports.
Consumer credit outstanding in November rose $1.4 billion, following a $7.0 billion increase in October. Like October, gains in non-revolving credit offset declines on the revolving side. Strong vehicle sales point to continued strength for non-revolving credit in December.
Consumer credit Consensus Forecast for December 10: +$2.0 billion
Range: -$1.0 billion to +$2.5 billion
Initial jobless claims in the January 29 week fell a very steep 42,000 to 415,000 as a weather-related pile up of claims in the South unwound. Nonetheless, the four-week average was up 1,000 to 430,500 to show a roughly 15,000 rise from a month ago. Extreme winter weather will likely weigh on claims for the February 5 week.
Jobless Claims Consensus Forecast for 2/5/11: 412,000
Range: 385,000 to 450,000
The U.S. Treasury monthly budget report showed a December deficit of $80.0 billion versus $91.4 billion a year ago. Looking at the fiscal-year-to-date comparison, outlays were up a year-on-year 3.1 percent but were outmatched by receipts which are up a solid 9.0 percent. Individual tax receipts were up 23 percent in what is evidence of economic strength. Looking ahead, the month of January typically shows a moderate surplus for the month as it is a month for quarterly payments. Over the past 10 years, the average surplus for the month of January has been $21.3 billion and $4.3 billion over the past 5 years. However, for January 2010, it was a deficit coming in at $42.6 billion.
Treasury Statement Consensus Forecast for January 11: -$60.0 billion
Range: -$82.0 billion to -$40.0 billion.
The U.S. international trade gap in November unexpectedly shrank slightly to $38.3 billion from a revised $38.4 billion gap the month before. The narrower gap reflected growth in exports slightly outpacing that for imports. Exports rose 0.8 percent, following a 3.0 percent jump in October. Imports rebounded a modest 0.6 percent after declining 0.8 percent in October. The narrowing of the trade deficit was primarily in the nonpetroleum goods gap which eased to $30.3 billion from $30.8 billion in October.
International trade balance Consensus Forecast for December 10: -$40.5 billion
Range: -$43.5 billion to -$37.4 billion
The Reuter's/University of Michigan's Consumer sentiment index for the final reading for January rose 1.5 points to 74.2 from the mid-month reading of 72.7. While the final for January was marginally below the December final of 74.5, the implied reading for second half January is a healthier 75.7. This is based on half of the full month survey taking place for the initial reading and final reading including a remaining half of the full survey sample. For final January, details show special strength in expectations, the index's leading component which is also at its best level since June.
Consumer sentiment Consensus Forecast for preliminary February 11: 75.0
Range: 73.5 to 78.5
R. Mark Rogers is the author of The Complete Idiot’s Guide to Economic Indicators, Penguin Books, October 2009.
Econoday Senior Writer Mark Pender contributed to this article.
|
