|
Boring would be nice—but the global economy could not pull that off this past week. Although political turmoil in the Middle East rattled financial markets at week's end, the U.S. economic recovery has been upgraded by a moderately healthy number for fourth quarter GDP. More recent monthly numbers have been mixed but support the view that momentum is gradually building.
 It was a good week for stocks—through Thursday. What had been moderate gains for blue chips and sizeable advances for techs and smalls caps for the week reversed or fizzled on Friday as worries about civil unrest in the Middle East and Egypt in particular took center stage at week’s end. It was a good week for stocks—through Thursday. What had been moderate gains for blue chips and sizeable advances for techs and smalls caps for the week reversed or fizzled on Friday as worries about civil unrest in the Middle East and Egypt in particular took center stage at week’s end.
But earlier, earnings were mixed but more positive than not. And M&A activity was picking up. Techs got lift from Intel early in the week with the announcement of a buyback plan. Smurfit-Stone Container Corporation jumped as Rock-Tenn Co. agreed to buy the packaging company.
The first notable economic news was from overseas on Tuesday as government data showed the UK economy unexpectedly shrinking in the fourth quarter—partly due to adverse winter weather. But this was tempered in the U.S. by a notable improvement in consumer confidence—which trumped two soft reports on home prices also on Tuesday.
Stocks got a nice boost at mid-week from a jump in new home sales as the Fed’s FOMC announcement was seen as a non-event for a change. Homebuilders fared notably well for the day. Thursday saw a unexpected spike in jobless claims but the report was shrugged off based on the view that the previous week had been held down by snow and ice storms in the South. A gain in pending home sales helped boost equities for the day. The biggest gainer in both the S&P500 and Nasdaq was Netflix after the movie distributer announced subscribership topping 20 million.
But major indexes fell sharply on Friday despite a modest gain in consumer sentiment and a close-to-expectations GDP number for the fourth quarter. Civil unrest in Egypt pushed stocks down in Europe and carried over to the U.S. as traders were barraged with film clips on TV of rioting in Egypt over the lack of progress toward democracy with higher food prices and lack of jobs certainly being key issues also.
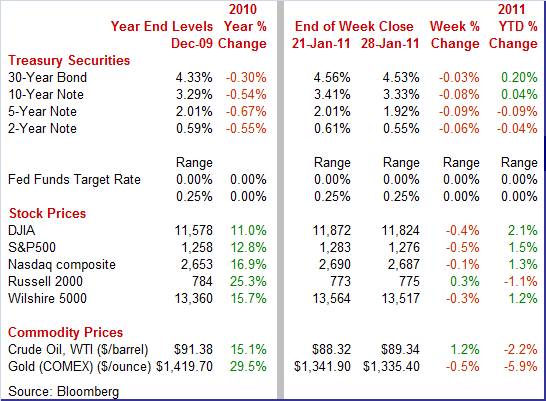
Equities were mostly down this past week. The Dow was down 0.4 percent; the S&P 500, down 0.5 percent; and the Nasdaq, down 0.1 percent. However, the Russell 2000 rose 0.3 percent.
For the year-to-date, major indexes are mostly up as follows: the Dow, up 2.1 percent; the S&P 500, up 1.5 percent; and the Nasdaq, up 1.3 percent. The Russell 2000 is down 1.1 percent.
Weekly percent change column reflects percent changes for all components except interest rates. Interest rate changes are reflected in simple differences.
 Rates see-sawed during the week until events in Egypt tipped the balance on Friday. Treasury yields ended the week down on flight to safety. Earlier in the week, rates dipped Tuesday on the negative growth report out of the UK. The jump in new home sales sent yields back up on Wednesday as did the Fed’s meeting statement. Bond traders were concerned that continued ease will rekindle inflation. Rates see-sawed during the week until events in Egypt tipped the balance on Friday. Treasury yields ended the week down on flight to safety. Earlier in the week, rates dipped Tuesday on the negative growth report out of the UK. The jump in new home sales sent yields back up on Wednesday as did the Fed’s meeting statement. Bond traders were concerned that continued ease will rekindle inflation.
Rates edged down Thursday on the jump in jobless claims but fell more rapidly Friday as funds moved into the dollar from overseas and Treasuries benefitted from funds moving out of equities.
For this past week Treasury rates were down as follows: 3-month T-bill, down 1 basis point; the 2-year note, down 6 basis points; the 5-year note, down 9 basis points; the 7-year note, down 8 basis points; the 10-year note, down 8 basis points; and the 30-year bond, down 3 basis points.
 Oil prices whipsawed somewhat this past week. The spot price for crude was soft the first two days of trading as Saudi Arabia indicated it might boost production and the negative news from the UK added to downward pressure. Oil prices whipsawed somewhat this past week. The spot price for crude was soft the first two days of trading as Saudi Arabia indicated it might boost production and the negative news from the UK added to downward pressure.
Prices for West Texas Intermediate tracked U.S. news the next two days as new home sales lifted crude on Wednesday but fell on Thursday after the spike in jobless claims.
But crude jumped $3.70 per barrel on Friday on fears that events in Egypt might close the Suez Canal. Closure would raise both the cost and time of shipping.
Net for the week, spot prices for West Texas Intermediate rebounded $1.02 per barrel to settle at $89.34.
The big economic news this past week was a strengthening in GDP in the fourth quarter. More timely news, however, has been mixed but mostly positive. As usual recently, manufacturing continues an uptrend outside of the volatile aircraft industry. Housing is still at a depressed level but the consumer shows signs of hope about the economy.
 As most economists had anticipated, the economy regained momentum in the final quarter of 2010—and in most of the right places. Fourth quarter GDP accelerated to a moderately healthy 3.2 percent annualized gain, following a 2.6 percent increase the prior quarter. But the detail is stronger than the headline number. As most economists had anticipated, the economy regained momentum in the final quarter of 2010—and in most of the right places. Fourth quarter GDP accelerated to a moderately healthy 3.2 percent annualized gain, following a 2.6 percent increase the prior quarter. But the detail is stronger than the headline number.
The last quarter of 2010 was led by sharp improvement in net exports to a gap of $392.2 billion from $505.0 billion in the third quarter. Exports rose an annualized 8.5 percent while imports dropped 13.6 percent. The decline in imports apparently was heavily related to a stall in inventory investment.
Notably, personal consumption expenditures were up an annualized 4.4 percent, coming in much stronger than the third quarter rise of 2.4 percent. The latest figure is the strongest in almost five years and is led by a surge in durables (autos) and a gain in nondurables (mostly clothing). Services posted only a modest increase.
 Also boosting GDP were business investment in equipment & software, up 5.8 percent; and residential investment, up 3.4 percent. However, the equipment & software component is much less robust than the third quarter’s 15.4 percent boost. The slowdown is due to a decline in the transportation equipment component which should rebound in coming quarters. Nonresidential structures posted a modest rise for the latest period. Also boosting GDP were business investment in equipment & software, up 5.8 percent; and residential investment, up 3.4 percent. However, the equipment & software component is much less robust than the third quarter’s 15.4 percent boost. The slowdown is due to a decline in the transportation equipment component which should rebound in coming quarters. Nonresidential structures posted a modest rise for the latest period.
Weakness was led by a sharp slowing in inventory investment to $7.2 billion from $121.4 billion in the third quarter. Apparently, business sales were heavily made from inventories and businesses ended up being cautious about overstocking from overseas suppliers as seen in the drop in imports. The soft inventories numbers and healthy final sales figure point toward continued healthy growth for the economy overall. However, the pace of imports is likely to pick back up as a partial offset.
Government purchases slipped 0.6 percent with notable declines in federal spending on defense expenditures and in overall state & local government spending.
The bottom line is that final sales have picked up significantly. Final sales of domestic product strengthened to a 7.1 percent increase from 0.9 percent annualized in the third quarter. Growth in real final sales to domestic purchasers (takes out net exports) picked up to 3.4 percent, following a 2.6 percent boost in the third quarter.
 Year-on-year, real GDP in the fourth quarter is up 2.8 percent, compared 3.2 percent in the third quarter. Year-on-year, real GDP in the fourth quarter is up 2.8 percent, compared 3.2 percent in the third quarter.
On an annual average basis for the year, GDP rebounded 2.9 percent in 2010 from a 2.6 percent drop in 2009. GDP was unchanged in 2008.
Economy-wide inflation as measured by the GDP price index softened to 0.3 percent in the fourth quarter, following a 2.1 percent increase the prior quarter. But the price weakness is due to technical peculiarities in how exports and imports interact in the GDP price index with imports being a subtraction. The export price index rose an annualized 8.1 percent in Q4 while import prices surged 18.9 percent.
The preferred headline measure according to the Commerce Department is the price index for gross domestic purchases—which excludes exports and imports. The price index for gross domestic purchases firmed significantly to 2.1 percent from 0.7 percent in the third quarter. Within this, the index for PCEs increased 1.8 percent after a 0.8 percent rise the prior period. For the fourth quarter, the price index for state & local government jumped 4.0 percent while that for nonresidential structures rose 3.2 percent.
The latest GDP report is clearly positive for forward momentum in the recovery despite a slightly disappointing headline number. Demand is picking up and inventories are not out of control—a very good combination. Still, growth is moderate and there are no signs of pending excessive growth.
 GDP got a nice lift from the consumer sector last quarter and it looks like the consumer mood is improving slightly this quarter. This past week both the Conference Board’s consumer confidence index and the Reuters/University of Michigan consumer sentiment index improved from their prior readings. Consumer confidence picked up sharply in January led by a big improvement in the assessment of the jobs market. The Conference Board's index jumped more than seven points in January to 60.6 with those saying jobs are currently hard to get falling more than 2-1/2 percentage points to 43.4 percent for the best reading in two years. GDP got a nice lift from the consumer sector last quarter and it looks like the consumer mood is improving slightly this quarter. This past week both the Conference Board’s consumer confidence index and the Reuters/University of Michigan consumer sentiment index improved from their prior readings. Consumer confidence picked up sharply in January led by a big improvement in the assessment of the jobs market. The Conference Board's index jumped more than seven points in January to 60.6 with those saying jobs are currently hard to get falling more than 2-1/2 percentage points to 43.4 percent for the best reading in two years.
The University of Michigan consumer sentiment index Consumer optimism is as strong as it's been since mid-year based on the implied second-half January reading of the consumer sentiment index. The index rose 1.5 points to 74.2 from the mid-month reading of 72.7. While the final for January is marginally below the December final of 74.5, the implied reading for second half January is a healthier 75.7. This is based on half of the full month survey taking place for the initial reading and final reading including a remaining half of the full survey sample. In practice, of course, the percentages vary slightly between first half and second half.
For final January, details show special strength in expectations, the index's leading component which is also at its best level since June.
 The monthly number for December new home sales looks really good—but that is primarily because the November figure was so anemic. Still, good news is good news. The monthly number for December new home sales looks really good—but that is primarily because the November figure was so anemic. Still, good news is good news.
New home sales were stronger than expected in December, jumping 18 percent to an annual unit rate of 329,000. In turn, months’ supply came down to 6.9 from 8.4 months in November. The buyer rush is likely tied to December's jump in mortgage rates which encouraged potential homebuyers to quit sitting on the fence and commit to a purchase. The spurt in sales resulted in the median sales price to jump 12 percent to $241,500. However, sales in the low end price range may have been damped by recent court rulings on robo-signings of foreclosure documents.
 Pending home sales in December—based on contract signings—continued recent gains. Sales advanced 2.0 percent in December, following a 3.1 percent gain in November, and 10.1 percent surge in October. December's gain is the fifth in six months and reflects what the National Association of Realtors calls good affordability and economic improvement. The latest gain is led by an 11.5 percent jump in the South with gains also seen in the Midwest, up 8.0 percent, and the Northeast, up 1.8 percent. Pending sales in the West dropped 13.2 percent. Pending home sales typically close one or two months after initial signing. Pending home sales in December—based on contract signings—continued recent gains. Sales advanced 2.0 percent in December, following a 3.1 percent gain in November, and 10.1 percent surge in October. December's gain is the fifth in six months and reflects what the National Association of Realtors calls good affordability and economic improvement. The latest gain is led by an 11.5 percent jump in the South with gains also seen in the Midwest, up 8.0 percent, and the Northeast, up 1.8 percent. Pending sales in the West dropped 13.2 percent. Pending home sales typically close one or two months after initial signing.
 Two home price reports use repeat transactions to compare changes in price homes. These are the Case-Shiller and the FHFA reports. Home prices are still very weak according to both. Two home price reports use repeat transactions to compare changes in price homes. These are the Case-Shiller and the FHFA reports. Home prices are still very weak according to both.
Home-price contraction eased in November according to Case-Shiller data that show a 0.4 percent seasonally adjusted dip for the 10-city composite index in November compared to a 1.0 percent drop in October. Note that Case-Shiller data are based on a three-month average which suggests that November may have actually showed a gain.
Unadjusted data, which reflect seasonal changes in demand, showed a steeper decline of 0.8 percent, following a 1.3 percent drop in October.
On a year-ago basis, the 10-city composite (SA) is down 0.4 percent in November, turning negative for the first time in 10 months.
 House prices for homes sold under government agency financing were unchanged in November for the FHFA purchase only house price index, following a bound of 0.2 percent in October. House prices for homes sold under government agency financing were unchanged in November for the FHFA purchase only house price index, following a bound of 0.2 percent in October.
On a year-on-year basis, the FHFA HPI is down 4.3 percent, compared to down 4.0 percent in October. This index is based on resale prices for homes financed or bundled by federal housing agencies.
Both reports show that the housing market remains quite soft—especially with supply of homes for sale continuing to weigh on prices and with demand weakened by high unemployment.
 Tracking the durables orders report is not for the faint hearted, given the series volatility and ability to confound analysts’ prognostications on a regular basis. The latest report stands out as a recent example. Durables orders in December unexpectedly dropped 2.5 percent, following a revised 0.1 percent fall the month before. Weakness is primarily in nondefense aircraft orders. Excluding transportation, new orders for durable goods are more favorable, advancing 0.5 percent after a 4.5 percent surge in November. By industry, strength is mostly in machinery with others industries generally down but after healthy gains the prior month. Tracking the durables orders report is not for the faint hearted, given the series volatility and ability to confound analysts’ prognostications on a regular basis. The latest report stands out as a recent example. Durables orders in December unexpectedly dropped 2.5 percent, following a revised 0.1 percent fall the month before. Weakness is primarily in nondefense aircraft orders. Excluding transportation, new orders for durable goods are more favorable, advancing 0.5 percent after a 4.5 percent surge in November. By industry, strength is mostly in machinery with others industries generally down but after healthy gains the prior month.
The headline number is tugged down by the transportation component which fell a monthly 12.8 percent in December after declining 13.1 percent the month before. The latest decrease is mainly in nondefense aircraft which plunged a monthly 99.5 percent—again, essentially Boeing orders likely falling due to delays in its Dreamliner delivery dates. Also, within transportation, motor vehicles actually increased 1.7 percent while defense aircraft & parts fell back 10.9 percent.
Overall, the report should be considered in light of ex-transportation showing the overall trend over two or three months. Essentially, manufacturing is still on an uptrend though one not as robust as believed last month.
 With the start of a new year, the District Bank presidents rotated out and in of FOMC voting positions according to schedule and one question by Fed watchers was whether there would be any dissent at this meeting since last year’s nay-sayer, Kansas City Fed President Thomas Hoenig, does not have a vote this year. With the start of a new year, the District Bank presidents rotated out and in of FOMC voting positions according to schedule and one question by Fed watchers was whether there would be any dissent at this meeting since last year’s nay-sayer, Kansas City Fed President Thomas Hoenig, does not have a vote this year.
But traders quickly fell asleep reading the latest meeting statement as there was little change in the statement wording and no dissenting votes.
As expected, the Fed left its fed funds target rate at a range of zero to 0.25 percent. The meeting statement kept most of the language from the prior meeting. The previously announced QE2 stays on track as planned. The Fed is maintaining its existing policy of reinvesting principal payments from its securities holdings and intends to purchase $600 billion of longer-term Treasury securities by the end of the second quarter of 2011.
The Fed continues to focus on weakness in labor markets and soft core inflation as justification for continued loose monetary policy.
Depending on who you ask, there are two or three District Bank presidents who are voting members this year and are “hawkish” on inflation issues. The list typically includes Dallas Fed President Richard Fisher and Philadelphia Fed President Charles Plosser. Some include Minneapolis Fed President Narayana Kocherlakota in this list or at least consider him as having hawkish leanings. Since there is little chance of stopping the planned QE2, the hawks may simply be keeping their powder dry for more opportune dissent in coming months as the economy likely improves and the Fed must pre-empt rising inflation pressures.
The U.S. economy is in relatively good shape, though it is hardly gangbusters. But for now the U.S. clearly is a safe haven for investors—especially with economic news mostly posting in the positive column.
The highlight of this week's data is Friday's employment situation report for January. But before that there are several key economic clues to be unveiled. On Monday, the week begins with the personal income and spending report followed by Tuesday's ISM manufacturing report and auto sales. On Thursday a whole raft of economic data will be released including the weekly jobless claims and ISM non-manufacturing reports. Employment follows on Friday.
Personal income in November rose 0.3 percent, following a 0.4 percent boost in October. However, the wages & salaries component was sluggish, edging up 0.1 percent after jumping 0.5 percent in October. Personal consumption expenditures advanced 0.4 percent, following a 0.7 percent gain in October. On the inflation front, the PCE price index increased 0.1 percent in November, following a 0.2 percent rise the month before. The core rate nudged up 0.1 percent after no change in October. Looking ahead, the wages & salaries component should be healthy in December as aggregate weekly earnings jumped 0.5 percent for the month. PCEs are likely to be relatively strong based on a 0.5 percent gain in retail sales excluding autos in December and a 2.3 percent monthly gain for unit new auto sales. PCEs inflation should be hot at the headline level but soft at the core as the overall CPI jumped 0.5 percent and the CPI core edged up 0.1 percent in December.
Personal income Consensus Forecast for December 10: +0.4 percent
Range: +0.1 to +0.6 percent
Personal consumption expenditures Consensus Forecast for December 10: +0.5 percent
Range: +0.3 to +0.6 percent
Core PCE price index Consensus Forecast for December 10: +0.1 percent
Range: +0.1 to +0.1 percent
The Chicago PMI for December jumped more than six points to 68.6. Details show major acceleration in new orders, to a 73.6 level from a reading of 67.2 in November. The strong posting for new orders suggests another healthy PMI figure for January.
Chicago PMI Consensus Forecast for January 11: 65.0
Range: 63.0 to 67.7
Sales of domestic light motor vehicles in December sold at a 9.4 million rate, up 4 percent from November. Combined domestics and imports rose 2 percent in December to a 12.5 million annual rate from 12.3 million in November.
Motor vehicle domestic sales Consensus Forecast for January 11: 9.5 million-unit rate
Range: 9.2 to 9.6 million-unit rate
The composite index from the ISM manufacturing survey rose four tenths in December to 57.0, well over 50 to indicate significant monthly growth for the month. This was the healthiest reading since May 2010. We should get another favorable reading for January as the new orders index jumped 4.3 points to 60.9 in December—the highest level also since May 2010.
ISM manufacturing composite index Consensus Forecast for January 11: 57.5
Range: 56.5 to 59.5
Construction spending in November posted a 0.4 percent gain, following a 0.7 percent boost the prior month. Construction spending has been up for three consecutive months. The gain in November is led by a 0.7 percent increase in private residential outlays. Looking ahead, the December number may weaken due to the impact of atypically severe winter weather in parts of the U.S. Also, housing starts fell for the month and likely will tug down on the residential component.
Construction spending Consensus Forecast for December 10: +0.2 percent
Range: -0.9 to +0.4 percent
Initial jobless claims for the January 22 week unexpectedly jumped 51,000 to 454,000. The Labor Department blamed snow storms in the South for the disappointing number. Continuing claims also rose, up 94,000 to 3.991 million in data for the January 15 week.
Jobless Claims Consensus Forecast for 1/29/11: 425,000
Range: 354,000 to 434,000
Nonfarm business productivity for the third quarter most recently was revised up to a 2.3 percent annualized gain from the initial estimate of 1.9 percent. Growth in unit labor costs for the third quarter was unrevised compared to the original estimate of an annualized 0.1 percent decline. Productivity is up from a minus 1.8 figure for the second quarter while unit labor costs improved from a 4.9 percent spike the prior period. Based on the improvement in GDP for the fourth quarter to 3.2 percent from 2.6 percent in the third, we could see a higher productivity number for the same period along with a softer labor cost figure. Productivity and unit labor costs use many of the same source data for their output components as does GDP. But increased worker hours could offset somewhat as suggested by the median forecast matching Q3 for both productivity and costs.
Nonfarm Business Productivity Consensus Forecast for initial Q4 10: +2.3 percent annual rate
Range: +0.7 to +3.0 percent annual rate
Unit Labor Costs Consensus Forecast for initial Q4 10: -0.1 percent annual rate
Range: -1.5 to +1.2 percent annual rate
Factory orders proved better than expected in November, rising a sizable 0.7 percent. Behind the gain is a 1.7 percent jump in nondurables orders, largely on price increases for petroleum and coal. The durables component was revised up to a modest decrease of 0.3 percent. More recently, durables orders in December unexpectedly dropped 2.5 percent, following a second revised 0.1 percent fall the month before. Weakness was primarily in nondefense aircraft orders.
Factory orders Consensus Forecast for December 10: -0.4 percent
Range: -0.7 to +0.7 percent
The composite index from the ISM non-manufacturing survey in December rose to 57.1, up 2.1 points from November’s reading of 55.0. The December figure set a new high for the recovery. And further improvement is likely as the new orders index jumped 5.3 points to 63.0, also a recovery best.
ISM non-manufacturing composite index Consensus Forecast for January 11: 57.0
Range: 53.4 to 63.5
Nonfarm payroll employment in December gained a modest 103,000, following a revised 71,000 rise in November and a 210,000 boost in October. Private sector payrolls increased 113,000 in December, following a 79,000 advance the month before. Average hourly earnings in December edged up 0.1 percent, following no change the previous month. Turning to the household survey, the unemployment rate unexpectedly fell to 9.4 percent from 9.8 percent in November. The rate declined in part due to a notable drop in the labor force, suggesting the unemployment rate will rebound when discouraged workers return.
Nonfarm payrolls Consensus Forecast for January 11: 150,000
Range: 55,000 to 200,000
Private nonfarm payrolls Consensus Forecast for January 11: 165,000
Range: 72,000 to 210,000
Unemployment rate Consensus Forecast for January 11: 9.5 percent
Range: 9.2 to 9.6 percent
Average workweek Consensus Forecast for January 11: 34.3 hours
Range: 34.3 to 34.4 hours
Average hourly earnings Consensus Forecast for January 11: +0.2 percent
Range: +0.1 to +0.2 percent
R. Mark Rogers is the author of The Complete Idiot’s Guide to Economic Indicators, Penguin Books, 2009.
Econoday Senior Writer Mark Pender contributed to this article.
|
