|
Stocks have posted healthy gains for the second straight week of the New Year. In fact, the party has gone on for some time as the S&P500 posted its seventh consecutive weekly advance. Economic data have contributed but company earnings and earnings forecasts have also provided lift.
 Equities continued to advance this past week with company news being the key factor. Economic news was mixed but mostly supportive. However, for about a year, European debt concerns have never been far from market focus. And this week was not an exception—at least at the start of the week. On Monday, U.S. stocks ended lower following a sell-off in European markets, as traders worried about whether Portugal would take a bailout as encouraged by Germany, France and other eurozone countries. Equities continued to advance this past week with company news being the key factor. Economic news was mixed but mostly supportive. However, for about a year, European debt concerns have never been far from market focus. And this week was not an exception—at least at the start of the week. On Monday, U.S. stocks ended lower following a sell-off in European markets, as traders worried about whether Portugal would take a bailout as encouraged by Germany, France and other eurozone countries.
On Tuesday, rising oil prices boosted the energy patch. Meanwhile, company news boosted stocks after Sears raised its profits projections and homebuilder Lennar’s earnings topped estimates. Also, a pledge by Japan to buy bonds to support bailouts in Europe eased market jitters and lifted European stocks with carryover to the U.S.
Company news for financials dominated at midweek as Wells Fargo gave upgrades to large banks. Leaders for the day included JPMorgan Chase, Bank of America, and American Express. The Fed released its Beige Book but it was largely as expected.
The economic news playing the biggest role in equity movement during the week was Thursday’s initial jobless claims which unexpectedly jumped and bumped down stocks.
At week's end, company news again dominated. After the close Thursday, Intel announced its best earnings in company history for the fourth quarter. Then, JPMorgan Chase reported strong earnings just before Friday’s opening bell. With favorable company news, traders ignored below expectations numbers for retail sales and consumer sentiment, and shifted focus to upcoming earnings news out this coming week. In turn, stocks posted notable gains for the day and week.
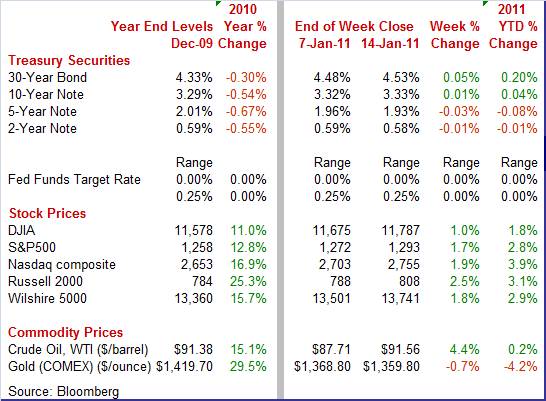
Equities were up this past week. The Dow was up 1.0 percent; the S&P 500, up 1.7 percent; the Nasdaq, up 1.9 percent; and the Russell 2000, up 2.5 percent.
For the year-to-date, major indexes are up as follows: the Dow, up 1.8 percent; the S&P 500, up 2.8 percent; the Nasdaq, up 3.9 percent; and the Russell 2000, up 3.1 percent.
Weekly percent change column reflects percent changes for all components except interest rates. Interest rate changes are reflected in simple differences.
 Treasury rates ended the week mixed. The story was relatively simple. Yields largely moved in tandem with equities as funds moved out of fixed income on good days for equities and back into Treasuries when stocks were weak. The biggest intra-week movement was on Thursday as the jump in jobless claims weighed on stocks. Treasury rates ended the week mixed. The story was relatively simple. Yields largely moved in tandem with equities as funds moved out of fixed income on good days for equities and back into Treasuries when stocks were weak. The biggest intra-week movement was on Thursday as the jump in jobless claims weighed on stocks.
For this past week Treasury rates were mixed as follows: 3-month T-bill, up 2 basis points; the 2-year note, down 1 basis point; the 5-year note, down 3 basis points; the 7-year note, down 3 basis points; the 10-year bond, up 1 basis point; and the 30-year bond, up 5 basis points.
 The price of oil continues an uptrend on signs of supply being short and on demand strengthening. The spot price of West Texas Intermediate rose sharply in each of the first three days of the week. The price of oil continues an uptrend on signs of supply being short and on demand strengthening. The spot price of West Texas Intermediate rose sharply in each of the first three days of the week.
At the start of the week, BP caused concern about supply when the company stated it could not say when production would return after the closing of the Trans-Alaska Pipeline System for repairs. Longer-term supply issues came to fore on Tuesday as a government panel recommended greater oversight of deep water drilling.
Boosting prices at mid-week was the EIA report indicating that crude inventories declined more than analysts forecast. Also, supporting prices was news of some resolution to European debt problems that would lift growth prospects.
Net for the week, spot prices for West Texas Intermediate jumped $3.95 per barrel to settle at $91.56. This is the highest level since early October 2008.
The economic news was mixed but mostly positive in the real sector. Manufacturing looked good while consumers were still opening their wallets even while worrying about the economy. Inflation news was not good at the headline level, though core measures are not yet worrisome.
 Holiday sales over the last two months have been quite good. But there are several stories in the details. Overall retail sales in December rose 0.6 percent after jumping 0.8 percent the month before. Although healthy, the December figure fell short of the consensus forecast for a 0.8 percent boost. Holiday sales over the last two months have been quite good. But there are several stories in the details. Overall retail sales in December rose 0.6 percent after jumping 0.8 percent the month before. Although healthy, the December figure fell short of the consensus forecast for a 0.8 percent boost.
A key source of strength in recent months has been autos which advanced 1.1 percent in December, following gains of 0.2 percent in November and 5.4 percent in October. For the latest month, excluding autos, sales were not quite as strong, rising 0.5 percent, following a 1.0 percent surge in November. Analysts had called for a 0.7 percent gain. With moderate pent up demand, this category likely will keep retail sales on an uptrend in coming months.
Another recent trend has been the boost in sales from rising gasoline prices that have been showing up in gasoline station sales. Gasoline station sales increased 1.6 percent in December after jumping 3.8 percent the month before. Sales excluding autos and gasoline rose a moderate 0.4 percent after a 0.6 percent increase in November.
Consumers appear to have front loaded holiday purchases as general merchandise sales (mainly department stores) declined 0.7 percent in December after a 1.1 percent jump in November. Electronics & appliance stores have suffered recently, falling 0.6 percent in December, following a 1.2 percent drop in November. These stores have fallen victim to not just price competition but to consumers making more of these big ticket purchases at discount department stores such as Wal-Mart.
Severe snow storms in the Northeast likely damped December sales somewhat. While holiday purchases may not have been as affected (you still fill your gift list even if delayed), others likely were. For example, food services & drinking places slowed significantly in December. No, you do not double up on restaurant visits because you were snowed in and missed some usual visits.
The bottom line is that consumers front loaded holiday purchases (broadly defined core sales) in November and some softening in December is not surprising. But the softness was modest as sales were still healthy in December even after discounting some price effects. Consumers with jobs are now pulling their weight keeping the recovery going.
 The consumer view of the economy is lagging what has been generally good economic news. But the likely big reason is that the consumer is focusing on the job market—which has also been lagging. And higher gasoline prices have not helped consumer spirits. The overall consumer sentiment index slipped 1.8 points from December to a reading of 72.7 for January preliminary. The reversal came from the current conditions component which dropped to 79.8 from 85.3. The reading is the lowest since October. In contrast, the expectations index actually nudged up to 68.2 from 67.5 in December. The consumer view of the economy is lagging what has been generally good economic news. But the likely big reason is that the consumer is focusing on the job market—which has also been lagging. And higher gasoline prices have not helped consumer spirits. The overall consumer sentiment index slipped 1.8 points from December to a reading of 72.7 for January preliminary. The reversal came from the current conditions component which dropped to 79.8 from 85.3. The reading is the lowest since October. In contrast, the expectations index actually nudged up to 68.2 from 67.5 in December.
Recent retail sales and confidence numbers continue to point to two very different consumer sectors—the one with steady job holders and one with unemployed and those still worried about potential layoffs. Fortunately, for now, those with jobs are willing to spend despite the glum mood for those still unemployed.
 The manufacturing sector continues to lead the recovery based on December data—but not quite as strongly as suggested by the headline for industrial production. Industrial production posted a healthy 0.8 percent gain, following a 0.3 percent rebound in November. The December figure came in higher than analysts’ estimate for 0.5 percent. However, the boost was led by a monthly 4.3 percent surge in utilities output, following a 1.5 percent increase in November. Utilities were up on atypically cold weather in the East. The manufacturing sector continues to lead the recovery based on December data—but not quite as strongly as suggested by the headline for industrial production. Industrial production posted a healthy 0.8 percent gain, following a 0.3 percent rebound in November. The December figure came in higher than analysts’ estimate for 0.5 percent. However, the boost was led by a monthly 4.3 percent surge in utilities output, following a 1.5 percent increase in November. Utilities were up on atypically cold weather in the East.
 Nonetheless, manufacturing increased a healthy 0.4 percent after a 0.3 percent rise in November. The latest was softened by a 0.2 percent dip in motor vehicle output. Excluding autos, manufacturing advanced 0.5 percent after a 0.6 percent boost in November. So, manufacturing is still on a significant uptrend. With motor vehicle sales somewhat strong, auto assemblies are likely to pick back up soon.
By market groups, strength was widespread. Production of consumer goods increased 1.0 percent in December; business equipment, 0.6 percent; nonindustrial supplies, 0.1 percent; and materials, 1.0 percent.
Overall capacity utilization continued to improve, rising to 76.0 percent in December from 75.0 percent in November. December’s figure beat expectations for 75.6 percent. Capacity utilization is at its highest since a reading of 77.9 percent for August 2008.
After discounting volatility from utilities, manufacturing is still on a moderately healthy uptrend and may be supporting hiring soon. Also, the uptrend in capacity utilization is gradually adding to eventual plans for equipment investment.
 There is more evidence that fourth quarter GDP is going to be relatively strong. The overall U.S. trade deficit in November unexpectedly shrank slightly to $38.3 billion from a revised $38.4 billion gap the month before The November deficit was much less negative than market expectations for a $41.0 billion shortfall. There is more evidence that fourth quarter GDP is going to be relatively strong. The overall U.S. trade deficit in November unexpectedly shrank slightly to $38.3 billion from a revised $38.4 billion gap the month before The November deficit was much less negative than market expectations for a $41.0 billion shortfall.
 The narrower gap reflected growth in exports slightly outpacing that for imports. Exports rose 0.8 percent, following a 3.0 percent jump in October. Imports rebounded a modest 0.6 percent after declining 0.8 percent in October. The narrower gap reflected growth in exports slightly outpacing that for imports. Exports rose 0.8 percent, following a 3.0 percent jump in October. Imports rebounded a modest 0.6 percent after declining 0.8 percent in October.
The narrowing of the trade deficit was primarily in the nonpetroleum goods gap which eased to $30.3 billion from $30.8 billion in October. The services surplus also edged higher. As expected, the petroleum differential widened to $20.1 billion from $18.9 billion the month before.
Manufacturers should be encouraged by a widespread gain in exports. By end-use categories, the increase in goods exports was led by a $1.0 billion gain in consumer goods with foods, feeds & beverages up $0.6 billion. Also rising were capital goods. However, the automotive category dipped $0.6 billion.
The rising price of crude oil was partly behind the rise in imports. The rebound in goods imports was led by a $1.9 billion boost in industrial supplies—largely oil imports. Also gaining were foods, feeds & beverages and capital goods. Imports of autos and consumer goods declined marginally.
On a bilateral basis (not seasonally adjusted), the deficit with China widened to $25.6 billion from $25.5 billion the month before. The shortfall with Japan grew to $5.8 billion from $5.7 billion. The gap with OPEC surged to $7.0 billion from $5.7 billion in October. There were some surpluses with the largest with Hong Kong at $1.9 billion (little changed from October); Australia at $1.2 billion, down from $1.3 billion; and Singapore at $0.5 billion, down from $0.6 billion.
 Higher oil prices are wreaking havoc with overall inflation numbers. But energy price pressures have had little impact on core CPI inflation. Higher oil prices are wreaking havoc with overall inflation numbers. But energy price pressures have had little impact on core CPI inflation.
The CPI in December jumped 0.5 percent, following a modest 0.1 percent rise the month before. Analysts had projected a 0.4 percent boost for the latest month. The December boost was the largest since a 0.7 percent surge in June 2009. Excluding food and energy, CPI inflation came in at 0.1 percent, equaling the rise for November and matching expectations.
 By major components, energy jumped 4.6 percent, following a 0.2 percent rise in November. Gasoline spiked a monthly 8.5 percent, following a 0.7 percent increase the prior month. Food price inflation actually slowed to 0.1 percent from 0.2 percent in November. By major components, energy jumped 4.6 percent, following a 0.2 percent rise in November. Gasoline spiked a monthly 8.5 percent, following a 0.7 percent increase the prior month. Food price inflation actually slowed to 0.1 percent from 0.2 percent in November.
As in recent months, shelter helped keep the core rate soft. The index for shelter rose 0.1 percent for the third month in a row. The rent index rose 0.2 percent while the index for owners’ equivalent rent increased 0.1 percent.
Not only is the rent index tied to rental markets but so is owners’ equivalent rent. This latter component reflects rents received for rental houses of comparable quality to those owned by occupants. More rental houses are on the market because of lengthy duration for homes on the market going unsold. Many unsold and unoccupied homes have been moved from “for sale” to “for rent” because the owner no longer can keep paying the mortgage without rental income. In turn, rents have softened.
Motor vehicles also helped the core. The index for new vehicles was unchanged in December while the used cars and trucks index fell 0.1 percent, its fourth consecutive decline. Also falling in December were the indexes for recreation, communication, and household furnishings and operations.
Year-on-year, overall CPI inflation rose to 1.4 (seasonally adjusted) from 1.1 percent in November. The core rate, however, eased 0.6 percent from 0.7 percent. On an unadjusted year-ago basis, the headline number was up 1.5 percent in December while the core was up 0.8 percent.
These year-ago numbers continue to point to inflation being below the Fed’s implicit target range of 1-1/2 percent to 2 percent for PCE inflation. But if energy costs continue to rise, they could feed into the costs for other goods and services. Though it is quite a few months—or even a few years—down the road, but when the housing market picks up along with household formation, shelter cost inflation could rise quickly and boost core inflation. Even though this possibility is in the future, the Fed will need to start taking this into account when the time comes to start unwinding its balance sheet expansion.
 Headline inflation is even stronger at the producer level as the overall PPI inflation rate in December came in with a 1.1 percent boost after jumping 0.8 percent in November. The December boost topped the consensus forecast for a 0.9 percent increase. At the core level, the PPI rate slowed to 0.2 percent from a 0.3 percent rebound the prior month. Analysts expected a 0.2 percent rise. Headline inflation is even stronger at the producer level as the overall PPI inflation rate in December came in with a 1.1 percent boost after jumping 0.8 percent in November. The December boost topped the consensus forecast for a 0.9 percent increase. At the core level, the PPI rate slowed to 0.2 percent from a 0.3 percent rebound the prior month. Analysts expected a 0.2 percent rise.
 By components, food prices gained 0.8 percent, after a 1.0 percent jump in November. The energy component continued a strong upward trend, surging 3.7 percent in December after rising 2.1 percent the prior month. Within energy, gasoline spiked 6.4 percent after jumping 4.7 percent in November. For food, over three-fourths of the December increase was due to prices for fresh and dry vegetables, which surged 22.8 percent. Higher prices for meats also were a major factor. By components, food prices gained 0.8 percent, after a 1.0 percent jump in November. The energy component continued a strong upward trend, surging 3.7 percent in December after rising 2.1 percent the prior month. Within energy, gasoline spiked 6.4 percent after jumping 4.7 percent in November. For food, over three-fourths of the December increase was due to prices for fresh and dry vegetables, which surged 22.8 percent. Higher prices for meats also were a major factor.
The core was kept somewhat soft in part by a 0.4 percent decline in prices for passenger cars.
For the overall PPI, the year-on-year rate increased to 4.1 percent from 3.5 percent in November (seasonally adjusted). The core rate firmed to 1.4 percent from 1.3 the prior month.
The latest PPI numbers will heat up the debate at the Fed during the end-of-month FOMC meeting as inflation pressures are rising while unemployment remains high. And it is not just energy that is a concern as food prices are being pressured by higher commodities prices.
The Beige Book prepared for the January 25-26 FOMC meeting found "economic activity in Fed Districts continued to expand moderately from November through December." The retail, manufacturing, and nonfinancial services sectors were cited as relatively strong while financial services and real estate were cited as the weak spots. Overall, the report is a little more positive than the prior Beige Book. Labor markets in most Districts appear to be firming somewhat. All District reports indicated that employment levels are rising in at least some sectors.
On the inflation front, while retailers and manufacturers report rising costs, pass through to consumers is modest. Specific markets or products identified as experiencing high or rising prices included various food products, steel and other metals, building materials, textiles, chemicals, and petroleum-related products. Wage pressures are limited.
The bottom line is that the recovery is gradually improving. The Fed at this time has little reason to change the stance of monetary policy although with more inflation hawks on this year's FOMC voting panel, there may be more discussion in the statement about planning for a return to normalcy.
The recovery continues to get support from consumer and trade sectors with demand showing up in manufacturing. But sentiment numbers raise questions about how strong consumer spending will continue without notable gains in employment. And higher food and energy costs could lead to some pullback in spending elsewhere. But for now, it appears that the recovery is overcoming these headwinds and growth is picking up, albeit slowly.
Regional manufacturing and housing are the focus of the holiday shortened week. Empire State posts Tuesday while the Philly Fed hits the wires Thursday. Housing starts take the spotlight on Wednesday, followed the next day by existing home sales.
U.S. Holiday: Martin Luther King, Jr. Day, All Markets Closed
The Empire State manufacturing index in December jumped to plus 10.57 from minus 11.14 in November, meaning overall conditions swung from contraction to moderate growth. However, the new orders index was not as robust, suggesting a sluggish report for January. New orders improved to just barely over breakeven at plus 2.60 in December from minus 24.38 the prior month.
Empire State Manufacturing Survey Consensus Forecast for January 11: 14.0
Range: 10.0 to 20.0
Housing starts in November rebounded 3.9 percent, following a sharp 11.1 percent drop the prior month. The November annualized pace of 0.555 million units is down 5.8 percent on a year-ago basis. In October, the multifamily component had fallen sharply and analysts had expected that component to lead a November rebound in overall starts. Instead, the gain in November was led by a monthly 6.9 percent boost in single-family starts, following a 2.7 percent dip the month before. But there is little to no forward momentum for notable improvement. Overall permits, however, fell back 4.0 percent in November after edging up 0.9 percent in October.
Housing starts Consensus Forecast for December 10: 0.550 million-unit rate
Range: 0.527 million to 0.585 million-unit rate
Initial jobless claims for the January 8 week surged 35,000 to 445,000 for the worst result since October. The Labor Department indicated that the week's surge reflected administrative backlog built up during the shortened weeks of the holidays. They also note that many claimants postponed filing until the New Year, a move that increased their benefits. Based on these technical factors, there likely will be retracement this week but how much is the question.
Jobless Claims Consensus Forecast for 1/15/11: 420,000
Range: 397,000 to 435,000
Existing home sales in November gained 5.6 percent to an annualized 4.68 million unit. Details showed improvement across all regions along with a strong 6.7 percent rise in sales of single-family homes, the report's key component. Another plus is that prices did not soften, up slightly to a median $170,600 to end a nearly six-month run of declines. Supply on the market fell for a third straight month yet at 9.5 months is still very heavy. We may see additional moderate improvement in December existing home sales as pending existing home sales jumped 10.1 percent in October and rose 3.5 percent in November. Pending sales are based on signings while existing sales are based on closings.
Existing home sales Consensus Forecast for December 10: 4.90 million-unit rate
Range: 4.55 to 5.04 million-unit rate
The Conference Board's index of leading indicators for November index jumped 1.1 percent, following healthy gains of 0.4 percent in October and 0.6 percent in September. In addition to the sharp rise, what also stands out for November is that the boost was based on widespread positive contributions by components with all but one contributing to the month’s gain.
Leading indicators Consensus Forecast for December 10: +0.6 percent
Range: +0.4 to +0.7 percent
The general business conditions index of the Philadelphia Fed's Business Outlook Survey in December rose nearly two points to 24.3. A healthy positive reading for January is likely. The new orders index advanced to 14.6 from 10.4 in November.
Philadelphia Fed survey Consensus Forecast for January 11: 20.0
Range: 18.3 to 26.4
R. Mark Rogers is the author of The Complete Idiot’s Guide to Economic Indicators, Penguin Books, 2009.
Econoday Senior Writer Mark Pender contributed to this article.
|
