|
The year of 2010 started with uncertainty and lingering fears of a double dip recession. But the economy has gradually grown stronger. And despite some European driven weakness in equities during the autumn, stocks continued to rebound, holding onto earlier gains and some ending the year at two-year highs.
 This past week was relatively quiet but most indexes posted incremental gains for the week. Techs were an exception with small caps also losing ground late in trading. This past week was relatively quiet but most indexes posted incremental gains for the week. Techs were an exception with small caps also losing ground late in trading.
The economic calendar was light with news only Tuesday and Thursday. On Tuesday, economic news was disappointing for the consumer and housing sectors but upbeat for manufacturing. The Conference Board's consumer confidence index for December unexpectedly declined. Respondents’ assessment of the jobs market was surprisingly negative. The S&P/Case-Shiller home price index fell more than expected. The positive news came from the Richmond Fed with its manufacturing survey headline index jumping to a reading of 25 in December (breakeven of zero) from a reading of 9 in November. There were strong gains for new orders, shipments, the workweek, employment, and wages.
 There was plenty of good news to boost shares, but apparently just about everyone has already clocked out for the year, leaving stocks little changed in thin trading. Initial jobless claims fell sharply in the December 25 week. The Chicago PMI showed an accelerating regional economy with the headline business barometer index jumping significantly. Finally, the NAR pending home sales index rose for the second month in a row. There was plenty of good news to boost shares, but apparently just about everyone has already clocked out for the year, leaving stocks little changed in thin trading. Initial jobless claims fell sharply in the December 25 week. The Chicago PMI showed an accelerating regional economy with the headline business barometer index jumping significantly. Finally, the NAR pending home sales index rose for the second month in a row.
Even though economic news was net positive, most indexes showed little change for the week. Techs, however, lost ground with Apple and Microsoft two notable decliners. The Russell 2000 fell in light volume as trading closed for the year.
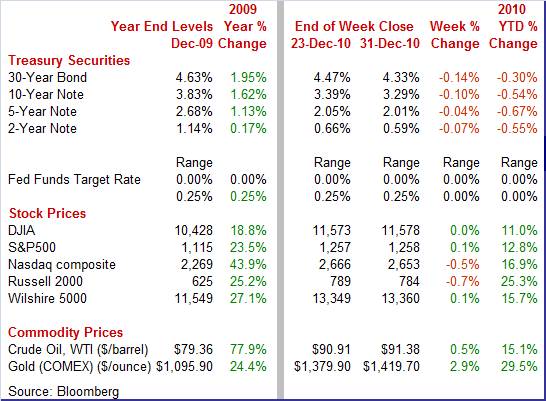
Equities were mixed this past week. The Dow was essentially unchanged, a tick or so positive while the S&P 500 edged up 0.1 percent. The Nasdaq fell 0.5 percent while the Russell 2000 dropped 0.7 percent.
December showed healthy gains for most indexes. The Dow gained 5.2 percent; the S&P 500 rose 6.5 percent; the Nasdaq, grew 6.2 percent; and the Russell 2000 advanced 7.8 percent.
 For the year, major indexes are up as follows: the Dow, up 11.0 percent; the S&P 500, up 12.8 percent; the Nasdaq, up 16.9 percent; and the Russell 2000, increased 25.3 percent. For the year, major indexes are up as follows: the Dow, up 11.0 percent; the S&P 500, up 12.8 percent; the Nasdaq, up 16.9 percent; and the Russell 2000, increased 25.3 percent.
Even though equities have posted sizeable gains over the past two years, indexes are still below their levels on October 9, 2007 when the Dow hit an historical high. Showing the least remaining gap to make up are the Nasdaq and Russell 2000, still down 5.4 percent and 7.3 percent from October 9, 2007. The S&P 500 and the Dow are still down 19.6 percent and 18.3 percent.
Weekly percent change column reflects percent changes for all components except interest rates. Interest rate changes are reflected in simple differences.
Bond yields drifted down this past week in thin trading. However, there were some notable daily swings. Treasury yields rose significantly on Tuesday as the 5-year note auction attracted the lowest demand since June. In contrast, on Wednesday Treasury rates fell on a favorable auction for 7-year notes. At Wednesday’s auction, indirect bidders, including foreign central banks, purchased 64.2 percent of the notes, the highest level since June 2009.
 Economic news was more positive than negative and rates should have firmed, but in very thin markets, recent movement does not have a lot of meaning. Economic news was more positive than negative and rates should have firmed, but in very thin markets, recent movement does not have a lot of meaning.
For this past week Treasury rates were down as follows: 3-month T-bill, down 1 basis point; the 2-year note, down 7 basis points; the 5-year note, down 4 basis points; the 7-year note, down 8 basis points; the 10-year bond, down 10 basis points; and the 30-year bond, down 14 basis points.
 Reviewing the year, movement in rates has been interesting. For most of the year, Treasury yields drifted down on the belief that the recovery was losing some momentum and from weak core inflation. Flight to safety on worries about European sovereign debt helped push rates to their lowest during 2010 during autumn. But late in the year, signs of a stronger economy and the Fed’s second round of quantitative easing bumped rates back up. The extension of federal tax cuts and a temporary reduction in payroll taxes were seen as adding to economic momentum and contributed to lifting yields during latter 2010. Reviewing the year, movement in rates has been interesting. For most of the year, Treasury yields drifted down on the belief that the recovery was losing some momentum and from weak core inflation. Flight to safety on worries about European sovereign debt helped push rates to their lowest during 2010 during autumn. But late in the year, signs of a stronger economy and the Fed’s second round of quantitative easing bumped rates back up. The extension of federal tax cuts and a temporary reduction in payroll taxes were seen as adding to economic momentum and contributed to lifting yields during latter 2010.
 Trading also was thin in oil markets but the spot price for West Texas Intermediate continues to creep higher. Prices were relatively stable the first three days of trading but dipped on Thursday after a government report showed inventories down less than expected, dropping WTI just below $90 per barrel. But traders, not wanting to be in short positions over the holiday weekend, boosted prices significantly on the last trading day of the week and year to notably over the $91 mark. Trading also was thin in oil markets but the spot price for West Texas Intermediate continues to creep higher. Prices were relatively stable the first three days of trading but dipped on Thursday after a government report showed inventories down less than expected, dropping WTI just below $90 per barrel. But traders, not wanting to be in short positions over the holiday weekend, boosted prices significantly on the last trading day of the week and year to notably over the $91 mark.
Net for the week, spot prices for West Texas Intermediate firmed 47 cents per barrel to settle at $91.38. Spot WTI ended the year up 15.1 percent from the December 31, 2009 level of $79.36.
Of course, the steady uptrend in oil prices has raised the risk of higher headline inflation. The Fed may have to start worrying that inflation is going up sooner than previously expected.
Economic news was mixed this past week but net positive as improvement in pending home sales and especially in the Chicago PMI were offsets to softness in consumer confidence and in home prices.
 The consumer view of the economy has been in a holding pattern since late 2009—one that is still on the gloomy side. The Conference Board's consumer confidence index for December unexpectedly declined, down 1.8 points to 52.5 and falling short of market forecasts for 57.4. The consumer view of the economy has been in a holding pattern since late 2009—one that is still on the gloomy side. The Conference Board's consumer confidence index for December unexpectedly declined, down 1.8 points to 52.5 and falling short of market forecasts for 57.4.
The latest setback was largely related to soft labor market conditions. Of the report's roughly 3,000 initial sample, 46.8 percent say jobs are currently hard to get in what is the worst reading since February.
The best you can say about the December report is that it is notably above the recent recession’s low of 25.3 in February 2009. The curious issue remains that consumer spending has been healthy in recent months—suggesting a two track consumer economy. Those with jobs are spending, with help from pent up demand. And those without jobs are holding back and remain gloomy about their prospects.
The housing sector appears to be in a mixed state of recovery and recession. Sales are making a modest comeback, but we will see that prices may be back in recession.  The National Association of Realtor’s pending home sales index for existing homes advanced 3.5 percent in November, following a 10.1 percent jump in October. However, sales are rising from very low levels and are still considered quite soft. The National Association of Realtor’s pending home sales index for existing homes advanced 3.5 percent in November, following a 10.1 percent jump in October. However, sales are rising from very low levels and are still considered quite soft.
November's gain also does not show any breadth. The key region in terms of number of units sold, the South, shows a small dip with the Midwest showing a more sizable decline. The Northeast shows a small increase while the West, the smallest and most volatile region, shows a big jump.
Pending home sales, which are based on contract signings, offer indications on future sales of existing homes, which are based on closings. The latest report suggests a pickup in existing home sales. While a soft labor market is constraining home sales, two factors may be adding lift to home purchases. Soft prices are one plus, also mortgage rates have been firming and fears of higher rates may lead potential buyers to stop delaying.
Home sales may be recovering but a big reason may be that prices have softened—making purchases more attractive. The housing sector—or at least the price facet—may be slipping back into recession, according to the S&P/Case-Shiller 10-city composite home price index which dropped a seasonally adjusted 0.9 percent in October after dipping 0.8 percent the month before. This index has fallen four months in a row.
 Year-on-year, sales are up 0.2 percent for the 10-city adjusted index but are down 0.8 percent for the 20-city index which is being depressed by mid-single digit declines in Atlanta, Detroit and Portland. Phoenix, Charlotte and Seattle, also part of the 20 index, also show sizable on-year declines. Year-on-year, sales are up 0.2 percent for the 10-city adjusted index but are down 0.8 percent for the 20-city index which is being depressed by mid-single digit declines in Atlanta, Detroit and Portland. Phoenix, Charlotte and Seattle, also part of the 20 index, also show sizable on-year declines.
The appearance of on-year declines in this report, which is noted for its breadth and accuracy, raises the risk of a pivotal downshift in home prices. Yet the outlook for home prices is not completely negative given price gains in recent reports on existing homes and new homes and also the FHFA house price index. However, the Case-Shiller index has the broadest coverage among types of mortgages for homes measured. FHFA covers homes sold or bundled through government agencies—more moderately priced homes. The Case-Shiller index and FHFA are repeat transaction indexes and are not affected by shifts in composition of sales month to month from low end to high end and vice versa. New and existing home prices are impacted by composition shift. The bottom line is that the direction of prices is uncertain, but Case-Shiller likely is most reliable.
 Despite slippage in consumer confidence, there is a growing list of signs that the recovery is gaining strength. The latest addition is the Chicago PMI as purchasers in the Chicago area are reporting red hot conditions in December. The Chicago PMI jumped more than six points to 68.6, topping analysts’ forecast for 62.0. Details show major acceleration in new orders, to a 73.6 level from a reading of 67.2 in November. Despite slippage in consumer confidence, there is a growing list of signs that the recovery is gaining strength. The latest addition is the Chicago PMI as purchasers in the Chicago area are reporting red hot conditions in December. The Chicago PMI jumped more than six points to 68.6, topping analysts’ forecast for 62.0. Details show major acceleration in new orders, to a 73.6 level from a reading of 67.2 in November.
Production, at 74.0 is considerably above breakeven and indicates a strong growth rate. The employment index gained nearly four points to 60.2 and suggests moderate hiring. The Chicago PMI includes both manufacturing and nonmanufacturing and is pointing to possible acceleration in upcoming ISM reports.
The recovery continues but with sectors showing alternating positives and negatives on a monthly basis. But overall, the recovery appears to be slowly gaining strength.
If recent regional surveys are a guide, the trading year should start with a healthy ISM manufacturing reading on Monday. Focus largely turns to the consumer with motor vehicle sales on Tuesday, jobless claims on Thursday, the all important employment report on Friday, and consumer credit Friday afternoon. The Fed’s FOMC minutes should also garner attention on Tuesday.
The composite index from the ISM manufacturing survey for November came in at 56.6—well above breakeven and just below October’s 56.9 reading. The pace of production slowed noticeably but, at 55.0, is still strong though less strong than the prior month's 62.7. We are likely to see a moderately healthy headline number for December as the new orders index remains on a recent rebound, posting at 56.6 in November, indicating solid month-to-month growth.
ISM manufacturing composite index Consensus Forecast for December 10: 57.2
Range: 55.5 to 58.6
Construction spending in October was surprisingly strong, rising 0.7 percent, following a 0.7 percent rebound the month before. The gain in October was primarily due to a 2.5 percent increase in private residential outlays. Public outlays increased 0.4 percent but private nonresidential spending fell 0.7 percent.
Construction spending Consensus Forecast for November 10: +0.1 percent
Range: -0.5 to +0.2 percent
Sales of domestic light motor vehicles held unchanged in November at a healthy 9.0 million unit annual rate. For the latest month, sales of domestic-made cars edged up to 3.7 million units while light trucks slipped to 5.3 million (includes SUVs, vans, and minivans). Combined domestics and imports posted a strong 12.3 million units—the same as in October.
Motor vehicle domestic sales Consensus Forecast for December 10: 9.2 million-unit rate
Range: 9.0 to 9.3 million-unit rate
Factory orders fell 0.9 percent in October, not a surprise given a 3.4 percent drop in durable goods orders. Nondurable goods orders rose 1.5 percent on gains in petroleum and coal products. More recently, durables orders in November declined 1.3 percent. Weakness was led by a drop in civilian aircraft orders. However, excluding transportation, new orders for durables rebounded 2.4 percent after a 1.9 percent contraction in October. Strength in core orders was broad based.
Factory orders Consensus Forecast for November 10: 0.0 percent
Range: -0.5 to +0.5 percent
The Minutes of the December 14 FOMC meeting are scheduled for release at 2:00 p.m. ET. Traders will focus on further details on the second round of quantitative easing. Also, many Fed watchers were disappointed that the latest meeting statement was somewhat negative about the economy even though economic news had been relatively upbeat. The minutes will be parsed to see if there was more optimism that indicated in the statement.
The composite index from the ISM non-manufacturing survey in November rose seven tenths to 55.0, the highest reading in six months and reflecting strong monthly gains for new orders and employment. The latter, posting at 52.7, is at its strongest level of the recovery. The composite should be well into positive territory in December as the new orders index improved to 57.7 from 56.7 in October.
ISM non-manufacturing composite index Consensus Forecast for December 10: 56.0
Range: 55.0 to 57.0
Initial jobless claims for the December 25 week fell a very steep and very surprising 34,000 to a sub-400,000 level of 388,000. However, this time of year with shortened weeks, seasonal adjustment is not so reliable for weekly numbers. However, the four-week average fell a steep 12,500 to 414,000.
Jobless Claims Consensus Forecast for 1/1/11: 412,000
Range: 400,000 to 415,000
Nonfarm payroll employment for November was unexpectedly soft, rising a very modest 39,000, following a 172,000 boost in October. Private sector payrolls increase 50,000 in November, following a 160,000 boost the month before. Average hourly earnings were flat in November after rising 0.3 percent the prior month. The average workweek for all workers was unchanged at an as-expected 34.3 hours. As many economists have been expecting, the unemployment rate turned up, rising to 9.8 percent from 9.6 percent in October. Looking ahead, jobless claims have been declining and suggest some improvement in the labor market. However, just because firms are laying off at a reduced rate does not mean hiring is picking up. And the unemployment rate likely is still under upward pressure from re-entrants to the labor force.
Nonfarm payrolls Consensus Forecast for December 10: 140,000
Range: 98,000 to 165,000
Private nonfarm payrolls Consensus Forecast for December 10: 150,000
Range: 108,000 to 175,000
Unemployment rate Consensus Forecast for December 10: 9.7 percent
Range: 9.6 to 9.8 percent
Average workweek Consensus Forecast for December 10: 34.3 hours
Range: 34.3 to 34.4 hours
Average hourly earnings Consensus Forecast for December 10: +0.1 percent
Range: +0.1 to +0.2 percent
Consumer credit outstanding in October expanded $3.4 billion, following a $1.2 billion rise in September. This was the first two consecutive month gain since mid-2008. The latest rise was led by a $9.0 billion boost in non-revolving credit, following a $10.1 billion jump in September. Both months reflect healthy motor vehicle sales. Looking ahead, November could be back in the red as motor vehicle sales were flat and revolving credit may be continuing its downtrend. But the consensus is still betting on a modest rise.
Consumer credit Consensus Forecast for November 10: +$2.0 billion
Range: -$2.5 billion to +$4.5 billion
R. Mark Rogers is the author of The Complete Idiot’s Guide to Economic Indicators, Penguin Books, 2009.
Econoday Senior Writer Mark Pender contributed to this article.
|
