Market focus was squarely on the U.S. last week. The midterm elections Tuesday went about as expected with the Republicans winning a majority in the House of Representatives while the Democrats retained control of the Senate. Wednesday’s long awaited Federal Reserve decision to begin a new round of quantitative easing (aka QE2) was greeted at first with circumspection then with glee. However, not everyone was happy about it, especially those policy makers in emerging markets who are concerned about inflows of cash.
There were a plethora of central bank meetings — the largest concentration since the first week of October 2008 when they met in emergency sessions to fight the global financial crisis. The results of last week’s meetings include two interest rate increases (Reserve Banks of Australia and India), three with no policy change (European Central Bank and the Banks of England and Japan) and one of course that expanded its quantitative easing program (Federal Reserve).
On Thursday, the S&P 500 and Dow hit two year highs. And elsewhere, the FTSE and DAX were at their highest since June 2008. Many analysts attributed the rally to the removal of the uncertainties surrounding the elections and the Fed. Stocks however have been supported by strong corporate profits — and possibly stronger economic growth.
Policy makers in emerging market nations criticized the Federal Reserve for its decision to pump more money into the U.S. economy, a measure that they fear could escalate the worrisome influx of cash into fast-growing economies around the world. Officials from Brazil to South Korea threatened more measures to curb the flood of money that has pushed up currency values and fueled concerns that asset price bubbles might be in the making in their countries. The unusually sharp backlash against the Fed’s action underscores the divide among some of the largest economies in the world over appropriate economic policy and is likely to overshadow a gathering of leaders of the Group of 20 leading economies in Seoul at the end of the week.
All indexes followed here were up last week with gains ranging from 0.4 percent for the KLCI to 7.7 percent for the Hang Seng and 5.7 percent for the SET.
|
|
2009 |
2010 |
% Change |
|
Index |
Dec 31 |
Oct 29 |
Nov 5 |
Week |
Year |
| Asia/Pacific |
|
|
|
|
|
|
| Australia |
All Ordinaries |
4882.7 |
4733.4 |
4872.9 |
2.9% |
-0.2% |
| Japan |
Nikkei 225 |
10546.4 |
9202.5 |
9626.0 |
4.6% |
-8.7% |
|
Topix |
907.6 |
810.9 |
835.0 |
3.0% |
-8.0% |
| Hong Kong |
Hang Seng |
21872.5 |
23096.3 |
24876.8 |
7.7% |
13.7% |
| S. Korea |
Kospi |
1682.8 |
1883.0 |
1939.0 |
3.0% |
15.2% |
| Singapore |
STI |
2897.6 |
3142.6 |
3240.3 |
3.1% |
11.8% |
| China |
Shanghai Composite |
3277.1 |
2978.8 |
3129.5 |
5.1% |
-4.5% |
|
|
|
|
|
|
|
| India |
Sensex 30 |
17464.8 |
20032.3 |
20893.6 |
4.3% |
19.6% |
| Indonesia |
Jakarta Composite |
2534.4 |
3635.3 |
3655.3 |
0.5% |
44.2% |
| Malaysia |
KLCI |
1272.8 |
1505.7 |
1511.7 |
0.4% |
18.8% |
| Philippines |
PSEi |
3052.7 |
4268.7 |
4349.1 |
1.9% |
42.5% |
| Taiwan |
Taiex |
8188.1 |
8287.1 |
8449.3 |
2.0% |
3.2% |
| Thailand |
SET |
734.5 |
984.5 |
1040.5 |
5.7% |
41.6% |
|
|
|
|
|
|
|
| Europe |
|
|
|
|
|
|
| UK |
FTSE 100 |
5412.9 |
5675.2 |
5875.4 |
3.5% |
8.5% |
| France |
CAC |
3936.3 |
3833.5 |
3916.7 |
2.2% |
-0.5% |
| Germany |
XETRA DAX |
5957.4 |
6601.4 |
6754.2 |
2.3% |
13.4% |
|
|
|
|
|
|
|
| North America |
|
|
|
|
|
|
| United States |
Dow |
10428.1 |
11118.5 |
11444.1 |
2.9% |
9.7% |
|
NASDAQ |
2269.2 |
2507.4 |
2579.0 |
2.9% |
13.7% |
|
S&P 500 |
1115.1 |
1183.3 |
1225.9 |
3.6% |
9.9% |
| Canada |
S&P/TSX Comp. |
11746.1 |
12676.2 |
12925.1 |
2.0% |
10.0% |
| Mexico |
Bolsa |
32120.5 |
35568.2 |
36317.5 |
2.1% |
13.1% |
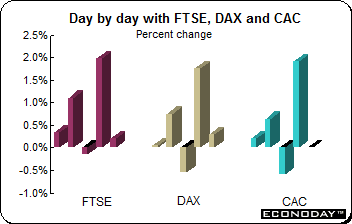 Equities in Europe and the UK took part in the global rally. The FTSE gained 3.5 percent, the DAX was up 2.3 percent and the CAC advanced 2.2 percent. However, on Friday, investors hesitated as shockingly weak German manufacturing data and disappointing eurozone retail sales weighed. Nerves also set in prior to the U.S. employment report. The indexes recovered their morning trading losses after employment increased much more than analysts had predicted. Equities in Europe and the UK took part in the global rally. The FTSE gained 3.5 percent, the DAX was up 2.3 percent and the CAC advanced 2.2 percent. However, on Friday, investors hesitated as shockingly weak German manufacturing data and disappointing eurozone retail sales weighed. Nerves also set in prior to the U.S. employment report. The indexes recovered their morning trading losses after employment increased much more than analysts had predicted.
There was a good deal of profit taking and general investor fatigue besides after the momentous week and after the FTSE and DAX reached their highest levels since June 2008. During the week, market players were forced to vigil three market moving events — Tuesday’s U.S. midterm elections, Wednesday’s FOMC announcement concerning quantitative easing and Friday’s employment situation report.
European Central Bank
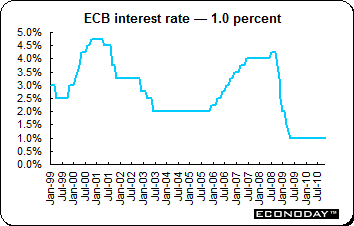 As expected the European Central Bank left its key interest rate unchanged at 1 percent where it has been since May 7, 2009. Usually, the refi or minimum bid rate would be the lowest rate at which banks could seek ECB financing in competitive bidding at the ECB's main weekly refinancing operations. However, for now and until further notice, it is the rate at which those refinancing agreements are fixed for all bidders. The governing council also left the deposit rate or the floor for euro money market rates at 0.25 percent and the marginal lending rate or the ceiling at 1.75 percent. As expected the European Central Bank left its key interest rate unchanged at 1 percent where it has been since May 7, 2009. Usually, the refi or minimum bid rate would be the lowest rate at which banks could seek ECB financing in competitive bidding at the ECB's main weekly refinancing operations. However, for now and until further notice, it is the rate at which those refinancing agreements are fixed for all bidders. The governing council also left the deposit rate or the floor for euro money market rates at 0.25 percent and the marginal lending rate or the ceiling at 1.75 percent.
The ECB wants to press ahead with an ‘exit strategy’ to unwind exceptional measures taken after the Lehman Brothers collapse. The Bank has said it intends to continue withdrawing its emergency measures, with some policy makers voicing concern about the risks of leaving them in place too long. At the same time, economic divergences within the euro region are growing as Germany’s expanding economy outpaces other member states such as Portugal, Ireland and Greece.
But the risk is that a stronger euro will choke off the economic recovery. The Fed’s decision to buy an additional $600 billion Treasuries through June 2011 to bolster the U.S. economy may force the ECB to delay the withdrawal of its own stimulus measures. QE2 risks driving the euro higher and threatening Europe’s export-led recovery.
Bank of England
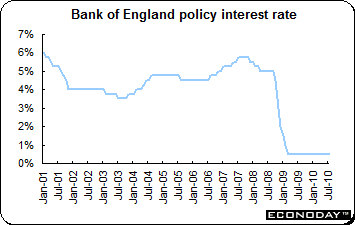 As expected, the Bank of England monetary policy committee left its key interest rate at 0.5 percent where it has been since March 5, 2009 and left the total amount of quantitative easing unchanged at Stg200 billion. The program of asset purchases financed by the issuance of central bank reserves was initiated on March 5, 2009. The most recent change in the size of that program was an increase of Stg25 billion to a total of Stg200 billion on November 5, 2009. As is usual when the MPC leaves policy unchanged, it did not release a statement. As expected, the Bank of England monetary policy committee left its key interest rate at 0.5 percent where it has been since March 5, 2009 and left the total amount of quantitative easing unchanged at Stg200 billion. The program of asset purchases financed by the issuance of central bank reserves was initiated on March 5, 2009. The most recent change in the size of that program was an increase of Stg25 billion to a total of Stg200 billion on November 5, 2009. As is usual when the MPC leaves policy unchanged, it did not release a statement.
Economic data have surprised recently. First estimate of third quarter GDP surpassed all forecasts and was up 0.8 percent on the quarter. These data were backed by strong October PMI surveys for both manufacturing and services. However, inflation remains too high at 3.1 percent on the year and far above the Bank’s inflation target of 2 percent.
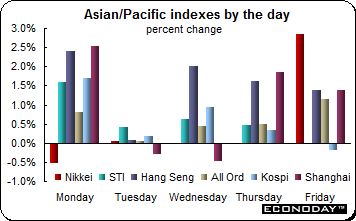 Equities recorded solid gains last week especially thanks to rallies on both Thursday and Friday on optimism about the global economic recovery sparked by the Fed’s QE2 plan. Earnings during the week also sparked optimism. The All Ordinaries gained following the release of the RBA’s quarterly monetary policy statement in which it said the pace of the nation’s economic growth will increase next year. The only indexes to gain under 1.9 percent were the Jakarta Composite (up 0.6 percent) and the KLCI (up 0.4 percent). Equities recorded solid gains last week especially thanks to rallies on both Thursday and Friday on optimism about the global economic recovery sparked by the Fed’s QE2 plan. Earnings during the week also sparked optimism. The All Ordinaries gained following the release of the RBA’s quarterly monetary policy statement in which it said the pace of the nation’s economic growth will increase next year. The only indexes to gain under 1.9 percent were the Jakarta Composite (up 0.6 percent) and the KLCI (up 0.4 percent).
Emerging market nations’ policy makers criticized the Federal Reserve for its decision to pump more money into the U.S. economy. They fear that it could escalate the worrisome influx of cash as investors seek higher returns. Officials from Brazil to South Korea threatened more measures to curb the flood of money that has pushed up currency values and fueled concerns that asset price bubbles might be in the making in their countries. The unusually sharp backlash against the Fed’s action underscores the divide among some of the largest economies in the world over appropriate economic policy and is likely to overshadow a gathering of leaders of the Group of 20 leading economies in Seoul at the end of this week.
Several of the regions central banks held policy meetings during the week. Both the Reserve Bank of Australia and the Reserve Bank of India increased interest rates to 4.75 percent and 6.25 percent respectively. The Bank of Japan maintained its overnight call rate range of around zero to 0.1 percent and fleshed out its purchases of securities other than government bonds (JGBs). The monetary policy board decided to buy Japan real estate investment trusts that are rated AA or higher and for which there are no concerns regarding their creditworthiness. Also, it will buy exchange traded funds (ETFs) whose prices track the Tokyo Stock Price Index or the Nikkei 225 Stock Average.
Reserve Bank of India
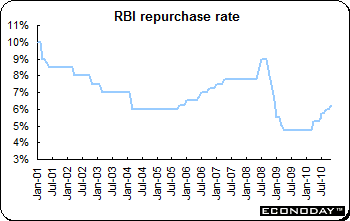 The Reserve Bank of India joined the Reserve Bank of Australia and increased interest rates by 25 basis points to 6.25 percent for its repurchase or lending rate and to 5.25 percent for its reverse repurchase or borrowing rate. The RBI’s rate increase was the sixth in 2010. It said that the chance of further policy tightening in the “immediate future is relatively low.” The immediate future refers to the next three months and only unforeseen events can trigger a rate action during the period. The Bank’s rate increase is aimed at slowing inflation — the CPI for industrial workers was up 9.9 percent on the year. The Reserve Bank of India joined the Reserve Bank of Australia and increased interest rates by 25 basis points to 6.25 percent for its repurchase or lending rate and to 5.25 percent for its reverse repurchase or borrowing rate. The RBI’s rate increase was the sixth in 2010. It said that the chance of further policy tightening in the “immediate future is relatively low.” The immediate future refers to the next three months and only unforeseen events can trigger a rate action during the period. The Bank’s rate increase is aimed at slowing inflation — the CPI for industrial workers was up 9.9 percent on the year.
Reserve Bank of Australia
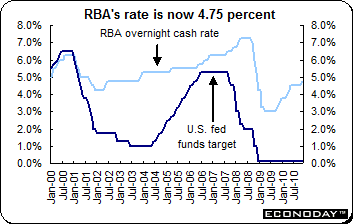 The Reserve Bank of Australia increased its key interest rate by 25 basis points to 4.75 percent. Analysts had been split with some expecting the rate to remain unchanged while others expected a 25 basis point increase. The rate had been unchanged since May when the board raised the rate to 4.5 percent. Third quarter consumer prices eased and are within the RBA’s inflation target range of 2 percent to 3 percent. But the Bank said it was prudent to tighten monetary policy early given that the risk of rising inflation remains. But the country is undergoing a mining boom that IMF staff said is starting to exhibit early signs of inflationary pressures. The Reserve Bank of Australia increased its key interest rate by 25 basis points to 4.75 percent. Analysts had been split with some expecting the rate to remain unchanged while others expected a 25 basis point increase. The rate had been unchanged since May when the board raised the rate to 4.5 percent. Third quarter consumer prices eased and are within the RBA’s inflation target range of 2 percent to 3 percent. But the Bank said it was prudent to tighten monetary policy early given that the risk of rising inflation remains. But the country is undergoing a mining boom that IMF staff said is starting to exhibit early signs of inflationary pressures.
The RBA said that the decision to increase rates was predicated on the assumption that the economy is on the verge of a large expansionary shock as shipments of resources to China boost trade and help lower unemployment. It also said that the period that saw a “moderation” of inflation “is probably now close to ending.” RBA Governor Glenn Stevens has raised the overnight cash rate target seven times since October 2009, the most aggressive monetary tightening of any developed economy in the Group of 20. The RBA’s rate increase came a day before the Federal Reserve decided embark on further quantitive easing. The divergence in monetary policies has sent the Australian dollar above parity.
Bank of Japan
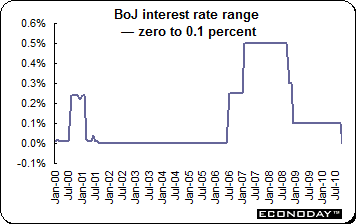 The Bank of Japan left its key interest rate at zero to 0.1 percent today. The vote was unanimous. The monetary policy board said that the economy shows signs of moderate recovery, but the recovery seems to be pausing. The BoJ said that the economy was likely to grow at a slower pace but should return to a moderate paced recovery. However, it warned that the downside risks must be monitored carefully and that the uncertainty over Japanese economic growth was high. The Bank will begin buying JGBs with the newly created fund as soon as early next week. It will then begin to start purchasing other assets after that. The MPB expects the effects of comprehensive easing to spread quickly. The Bank of Japan left its key interest rate at zero to 0.1 percent today. The vote was unanimous. The monetary policy board said that the economy shows signs of moderate recovery, but the recovery seems to be pausing. The BoJ said that the economy was likely to grow at a slower pace but should return to a moderate paced recovery. However, it warned that the downside risks must be monitored carefully and that the uncertainty over Japanese economic growth was high. The Bank will begin buying JGBs with the newly created fund as soon as early next week. It will then begin to start purchasing other assets after that. The MPB expects the effects of comprehensive easing to spread quickly.
The Bank of Japan today said that it will use part of its ¥5 trillion yen ($62 billion) fund to buy exchange-traded funds that track the Nikkei 225 Stock Average and the Topix index and Japanese real-estate investment trusts with credit ratings of AA or higher. The fund will also start purchasing government debt early next week.
The board finalized plans to buy exchange-traded funds and real-estate investment trusts in a ¥5 trillion asset purchase program it announced early last month. The bulk of the new fund — about ¥3.5 trillion — will be used to buy Japanese government securities, beginning this week.
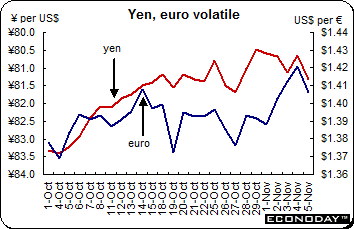 The U.S. dollar was up on the week against the yen and Swiss franc. However, it dropped against the commodity currencies — the Canadian and Australian dollars. The Canadian currency is at parity while the Australian is now above parity. Currency traders were quick to react to the important events of the week, but especially the FOMC announcement of QE2 and the employment report. The program announcement met with general approval in the U.S. even though analysts admitted that they didn’t have a clue — but lots of opinions — what it means. There's more certainty overseas about what it means and the tensions it is generating will have priority at the Group of 20 summit meeting in Seoul, South Korea on Thursday and Friday. The U.S. dollar was up on the week against the yen and Swiss franc. However, it dropped against the commodity currencies — the Canadian and Australian dollars. The Canadian currency is at parity while the Australian is now above parity. Currency traders were quick to react to the important events of the week, but especially the FOMC announcement of QE2 and the employment report. The program announcement met with general approval in the U.S. even though analysts admitted that they didn’t have a clue — but lots of opinions — what it means. There's more certainty overseas about what it means and the tensions it is generating will have priority at the Group of 20 summit meeting in Seoul, South Korea on Thursday and Friday.
The Australian dollar jumped closer to parity with its U.S. counterpart after the RBA lifted the official cash rate to 4.75 percent. It soared above parity after the Fed’s move. Higher commodity prices also gave the Canadian dollar a lift to parity. Other central bank announcements had a negligible effect on currencies.
Selected currencies — weekly results
|
|
2009 |
2010 |
% Change |
|
|
Dec 31 |
Oct 29 |
Nov 5 |
Week |
2010 |
| U.S. $ per currency |
|
|
|
|
|
|
| Australia |
A$ |
0.898 |
0.980 |
1.015 |
3.6% |
13.1% |
| New Zealand |
NZ$ |
0.727 |
0.763 |
0.797 |
4.6% |
9.7% |
| Canada |
C$ |
0.955 |
0.980 |
1.000 |
2.0% |
4.6% |
| Eurozone |
euro (€) |
1.433 |
1.391 |
1.404 |
0.9% |
-2.1% |
| UK |
pound sterling (£) |
1.617 |
1.602 |
1.619 |
1.0% |
0.1% |
|
|
|
|
|
|
|
| Currency per U.S. $ |
|
|
|
|
|
|
| China |
yuan |
6.827 |
6.670 |
6.657 |
0.2% |
2.5% |
| Hong Kong |
HK$* |
7.753 |
7.752 |
7.751 |
0.0% |
0.0% |
| India |
rupee |
46.525 |
44.428 |
44.211 |
0.5% |
5.2% |
| Japan |
yen |
93.125 |
80.466 |
81.325 |
-1.1% |
14.5% |
| Malaysia |
ringgit |
3.427 |
3.112 |
3.085 |
0.9% |
11.1% |
| Singapore |
Singapore $ |
1.405 |
1.295 |
1.286 |
0.7% |
9.3% |
| South Korea |
won |
1164.000 |
1125.163 |
1107.325 |
1.6% |
5.1% |
| Taiwan |
Taiwan $ |
31.985 |
30.624 |
30.107 |
1.7% |
6.2% |
| Thailand |
baht |
33.400 |
29.935 |
29.645 |
1.0% |
12.7% |
| Switzerland |
Swiss franc |
1.035 |
0.984 |
0.962 |
2.4% |
7.7% |
| *Pegged to U.S. dollar |
|
|
|
|
|
|
| Source: Bloomberg |
|
|
|
|
|
|
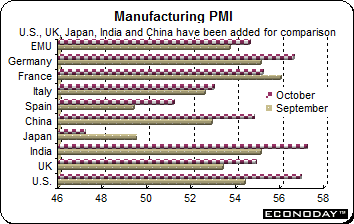 October purchasing managers' manufacturing index was revised to 54.6 from its flash reading of 54.1 and was 0.9 points above its level in September. The minor adjustment reflected a better than previously reported performance in Germany where the national PMI rose from 55.1 percent to 56.6 — the flash estimate was 56.1. Elsewhere Italy secured a 0.4 point monthly rise to 53.0 but France posted a 0.8 point decline to 55.2. Spain bounced back over the 50 mark with a reading of 51.2 after sinking to 49.6 in September. National PMIs generally were firmer in most EMU states. The exception however was Greece where the rate of deterioration actually accelerated and output fell at its fastest pace since June. October purchasing managers' manufacturing index was revised to 54.6 from its flash reading of 54.1 and was 0.9 points above its level in September. The minor adjustment reflected a better than previously reported performance in Germany where the national PMI rose from 55.1 percent to 56.6 — the flash estimate was 56.1. Elsewhere Italy secured a 0.4 point monthly rise to 53.0 but France posted a 0.8 point decline to 55.2. Spain bounced back over the 50 mark with a reading of 51.2 after sinking to 49.6 in September. National PMIs generally were firmer in most EMU states. The exception however was Greece where the rate of deterioration actually accelerated and output fell at its fastest pace since June.
 September producer prices (excluding construction) posted a 0.3 percent increase on the month and were up 4.2 percent on the year. Core PPI was up 0.3 percent and 2.5 percent on the year. Headline prices were boosted on the month by a 0.5 percent increase in intermediates. Prices in this sub-sector are now running at an annual 5.1 percent rate, well ahead of the other major categories excluding energy (9.4 percent). Both capital and durable consumer goods were unchanged and nondurable consumer goods edged up 0.2 percent. Regionally, all member states posted higher national PPIs on the month with the exception of Slovakia (down 0.4 percent). September producer prices (excluding construction) posted a 0.3 percent increase on the month and were up 4.2 percent on the year. Core PPI was up 0.3 percent and 2.5 percent on the year. Headline prices were boosted on the month by a 0.5 percent increase in intermediates. Prices in this sub-sector are now running at an annual 5.1 percent rate, well ahead of the other major categories excluding energy (9.4 percent). Both capital and durable consumer goods were unchanged and nondurable consumer goods edged up 0.2 percent. Regionally, all member states posted higher national PPIs on the month with the exception of Slovakia (down 0.4 percent).
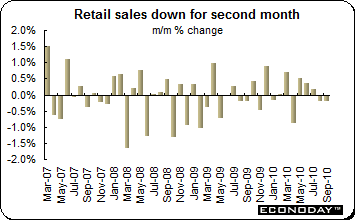 September retail sales declined 0.2 percent and were 1.2 percent higher on the year. The overall drop in September would have been steeper but for the comparative buoyancy of the food sector which slipped only 0.1 percent. Non-food and auto fuel purchases were off 0.3 percent on the month, albeit after a 0.8 percent advance last time. Regionally the full eurozone figures were dragged lower by a 2.3 percent monthly collapse in volumes in Germany. This was compounded by a 0.4 percent decline in France and a 0.6 percent drop in Spain. However, there were some pockets of strength, notably Belgium (1.9 percent), Austria (1.5 percent) and Slovenia (0.8 percent). September retail sales declined 0.2 percent and were 1.2 percent higher on the year. The overall drop in September would have been steeper but for the comparative buoyancy of the food sector which slipped only 0.1 percent. Non-food and auto fuel purchases were off 0.3 percent on the month, albeit after a 0.8 percent advance last time. Regionally the full eurozone figures were dragged lower by a 2.3 percent monthly collapse in volumes in Germany. This was compounded by a 0.4 percent decline in France and a 0.6 percent drop in Spain. However, there were some pockets of strength, notably Belgium (1.9 percent), Austria (1.5 percent) and Slovenia (0.8 percent).
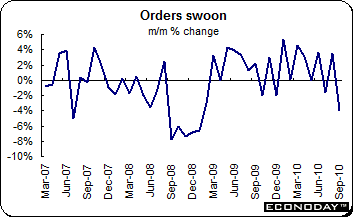 September manufacturing orders sank 4.0 percent on the month but were up 14.0 percent on the year. The September slide was led by a 4.5 percent nosedive in capital goods orders although basics were not far behind, sinking a 4.0 percent on the month. Consumer and durables posted a 0.3 percent gain. Domestic orders declined 0.6 percent from August, a dip that was wholly attributable to a 1.8 percent decline in basics. Capital goods (0.2 percent) and especially consumer and durables (2.4 percent) kept their respective heads above water. However, foreign demand slumped 6.6 percent on the month. Eurozone orders plummeted 13.3 percent (after a 13.8 percent leap last time) while non-eurozone demand was off only 1.2 percent. September manufacturing orders sank 4.0 percent on the month but were up 14.0 percent on the year. The September slide was led by a 4.5 percent nosedive in capital goods orders although basics were not far behind, sinking a 4.0 percent on the month. Consumer and durables posted a 0.3 percent gain. Domestic orders declined 0.6 percent from August, a dip that was wholly attributable to a 1.8 percent decline in basics. Capital goods (0.2 percent) and especially consumer and durables (2.4 percent) kept their respective heads above water. However, foreign demand slumped 6.6 percent on the month. Eurozone orders plummeted 13.3 percent (after a 13.8 percent leap last time) while non-eurozone demand was off only 1.2 percent.
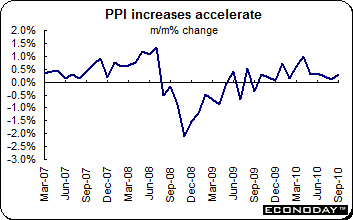
 October producer output prices were up 0.6 percent — their strongest monthly increase in six months — and now stand 4.0 percent higher on the year. Input prices surged 2.1 percent on the month for a 12-month growth rate of 8.0 percent. Note that as of the data October recyclables have been excluded from the output price data so the new series is not directly comparable with the old one. The switch has had the effect of reducing inflation in the latest and previous months by up to 1.5 percentage points. Output prices were boosted by a 2.1 percent spike in the cost of petroleum. This alone added more than 0.2 percentage points to the overall monthly increase. The other main boosts came from food (0.7 percent), chemicals (0.9 percent) and transport equipment (0.7 percent). The only decline in prices was seen in computers and electrical & optical equipment (0.3 percent). Core output prices advanced 0.4 percent and 3.3 percent on the year. Input prices were inflated by a 4.2 percent jump in the price of crude oil. This added nearly a full percentage point to the headline monthly gain. In addition, there were strong increases in fuel (2.6 percent), imported food (1.9 percent), imported metals (2.8 percent), imported chemicals (1.3 percent) and imported parts & equipment (1.4 percent). There were no declines in prices in any subsector. October producer output prices were up 0.6 percent — their strongest monthly increase in six months — and now stand 4.0 percent higher on the year. Input prices surged 2.1 percent on the month for a 12-month growth rate of 8.0 percent. Note that as of the data October recyclables have been excluded from the output price data so the new series is not directly comparable with the old one. The switch has had the effect of reducing inflation in the latest and previous months by up to 1.5 percentage points. Output prices were boosted by a 2.1 percent spike in the cost of petroleum. This alone added more than 0.2 percentage points to the overall monthly increase. The other main boosts came from food (0.7 percent), chemicals (0.9 percent) and transport equipment (0.7 percent). The only decline in prices was seen in computers and electrical & optical equipment (0.3 percent). Core output prices advanced 0.4 percent and 3.3 percent on the year. Input prices were inflated by a 4.2 percent jump in the price of crude oil. This added nearly a full percentage point to the headline monthly gain. In addition, there were strong increases in fuel (2.6 percent), imported food (1.9 percent), imported metals (2.8 percent), imported chemicals (1.3 percent) and imported parts & equipment (1.4 percent). There were no declines in prices in any subsector.
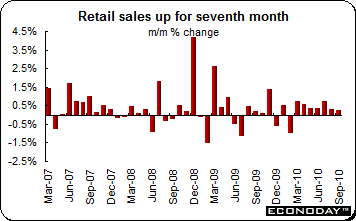 September retail sales were up 0.3 percent for the second consecutive month and 3.9 percent on the year. The largest increase was recorded in clothing, footwear & personal accessory retailing (up 2.5 percent) followed by other retailing (up 0.5 percent). Household goods edged up 0.2 percent and food, 0.1 percent. However, sales were down 0.4 percent in cafes, restaurants and takeaway food services and 0.2 percent in department stores. In the September quarter, sales were up 0.7 percent. September retail sales were up 0.3 percent for the second consecutive month and 3.9 percent on the year. The largest increase was recorded in clothing, footwear & personal accessory retailing (up 2.5 percent) followed by other retailing (up 0.5 percent). Household goods edged up 0.2 percent and food, 0.1 percent. However, sales were down 0.4 percent in cafes, restaurants and takeaway food services and 0.2 percent in department stores. In the September quarter, sales were up 0.7 percent.
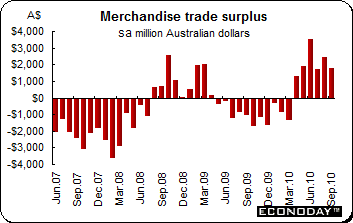 September international trade surplus was A$1.76 billion, down from August’s surplus of A$2.45 billion. Exports declined 1.5 percent. Non-rural goods fell 3 percent while rural goods dropped 8 percent. Non-monetary gold was up a heady 36 percent. Services credits remained steady. Imports were up 1.4 percent. Non-monetary gold was up A$333 million and intermediate & other merchandise goods were up 2 percent. Capital goods dropped 4 percent while consumption goods slipped by A$1 million. Services eased down 1 percent. September international trade surplus was A$1.76 billion, down from August’s surplus of A$2.45 billion. Exports declined 1.5 percent. Non-rural goods fell 3 percent while rural goods dropped 8 percent. Non-monetary gold was up a heady 36 percent. Services credits remained steady. Imports were up 1.4 percent. Non-monetary gold was up A$333 million and intermediate & other merchandise goods were up 2 percent. Capital goods dropped 4 percent while consumption goods slipped by A$1 million. Services eased down 1 percent.
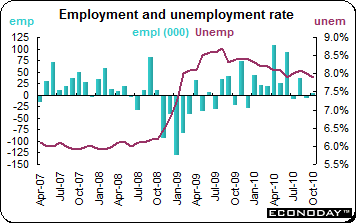 October employment was up a modest 3,000 while the unemployment rate eased to 7.9 percent from 8.0 percent in September thanks to the labor force shrinking by 4,300. The headline employment figures mask a solid 47,200 increase in new full time jobs while part time positions declined 44,200. Private sector payrolls increased 37,800 while the public sector lost 10,700 employees. Self-employment contracted 24,100. The goods producing sector jumped a surprisingly large 35,800. Within this, manufacturing gained 9,900 but construction dominated with a 20,800 advance. Agriculture also added 8,500 but natural resources declined 5,300. Services shed a sizeable 32,700 positions, largely reflecting a 28,900 shakeout in retail trade. Health care & social assistance also struggled (down 9,800) and there were declines too in accommodation & food services (down 8,600) and in the other services category (down 5,000). However, payrolls expanded in information, culture & recreation (22,100) and in finance, real estate & leasing (5,000). October employment was up a modest 3,000 while the unemployment rate eased to 7.9 percent from 8.0 percent in September thanks to the labor force shrinking by 4,300. The headline employment figures mask a solid 47,200 increase in new full time jobs while part time positions declined 44,200. Private sector payrolls increased 37,800 while the public sector lost 10,700 employees. Self-employment contracted 24,100. The goods producing sector jumped a surprisingly large 35,800. Within this, manufacturing gained 9,900 but construction dominated with a 20,800 advance. Agriculture also added 8,500 but natural resources declined 5,300. Services shed a sizeable 32,700 positions, largely reflecting a 28,900 shakeout in retail trade. Health care & social assistance also struggled (down 9,800) and there were declines too in accommodation & food services (down 8,600) and in the other services category (down 5,000). However, payrolls expanded in information, culture & recreation (22,100) and in finance, real estate & leasing (5,000).
The week generated enough news for investors to need a respite. The three major U.S. events — the midterm election, FOMC’s announcement of QE2 and the surprising employment gain —dominated the news and movements in the stock, bond and currency markets. Both the Reserve Bank of Australia and the Reserve Bank of India increased interest rates — a stark contrast to the Fed’s new dose of quantitative easing. The European Central Bank and Bank of England kept policy unchanged while the Bank of Japan fleshed out its asset purchase plan.
The Federal Reserve's fresh round of bond purchasing to boost the U.S. economy has already generated broad opposition in the days prior to the summit of the Group of 20 leading world economies. Europe has joined Asian and big emerging economies in protesting that the Fed's $600 billion new cash infusion will put upward pressure on their currencies, create asset bubbles and eventually impair growth.
| Other important events |
|
| November 11,12 |
Seoul, South Korea |
Group of 20 Summit |
|
|
|
| The following indicators will be released this week... |
| Europe |
|
|
| November 8 |
Germany |
Industrial Production (September) |
|
|
Merchandise Trade (September) |
| November 9 |
France |
Merchandise Trade (September) |
|
UK |
Industrial Production (September) |
|
|
Merchandise Trade (October) |
| November 10 |
France |
Industrial Production (September) |
|
Italy |
Industrial Production (September) |
| November 12 |
EMU |
Gross Domestic Product (Q3.10 flash) |
|
|
Industrial Production (September) |
|
Germany |
Gross Domestic Product (Q3.10 flash) |
|
France |
Gross Domestic Product (Q3.10 flash) |
|
Italy |
Gross Domestic Product (Q3.10 flash) |
|
|
|
| Asia/Pacific |
|
|
| November 11 |
Australia |
Employment/Unemployment (October) |
|
|
|
| Americas |
|
|
| November 10 |
Canada |
International Trade (September) |
Anne D Picker is the author of International Economic Indicators and Central Banks.
|
