Summer doldrums and trading volumes are light. There are a couple of reasons for this — people still do go away on vacation and traders are taking a wait and see attitude toward the world's economic growth. However, there still were a few market movers that did move the markets a lot! Midweek, the U.S. trade report vied with the FOMC statement to shake up the markets the most. Investors worried that the larger than expected U.S. trade deficit would cut into second quarter growth estimates. And the Federal Reserve — which did the expected — did not help either.
The Fed lowered its growth estimate and said it would maintain its current level of quantitative easing. The Fed’s move to pump up a flagging recovery by buying Treasury bonds with mortgage-backed securities proceeds (the Fed’s balance sheet will not expand) has led to a rush to safe haven assets. Prior to the Fed’s announcement, the Bank of Japan left its monetary policy unchanged which sent Asian/Pacific markets tumbling.
Investors are shedding risk and are once again seeking safer returns as they respond to new disappointments in labor markets and adjust to downgrades of the global growth. Further growth worries came from Australia, where the unemployment rate unexpectedly climbed to 5.3 percent from 5.1 percent. The yen’s rise was reversed after the Bank of Japan and the Japanese government practiced verbal intervention and said it was watching the yen closely. This prompted fears of market intervention to lower the currency’s value.
In Europe, despite better than anticipated second quarter growth, investors continued to fret about slower growth ahead as well as the growth rate disparities within the EMU which data vividly highlight.
On the week, all indexes followed here save the Sensex were down.
|
|
2009 |
2010 |
% Change |
|
Index |
Dec 31 |
6-Aug |
13-Aug |
Week |
2010 |
| Asia/Pacific |
|
|
|
|
|
|
| Australia |
All Ordinaries |
4882.7 |
4586.3 |
4480.9 |
-2.3% |
-8.2% |
| Japan |
Nikkei 225 |
10546.4 |
9642.1 |
9253.5 |
-4.0% |
-12.3% |
|
Topix |
907.6 |
861.2 |
831.2 |
-3.5% |
-8.4% |
| Hong Kong |
Hang Seng |
21872.5 |
21678.8 |
21071.6 |
-2.8% |
-3.7% |
| S. Korea |
Kospi |
1682.8 |
1783.8 |
1746.2 |
-2.1% |
3.8% |
| Singapore |
STI |
2897.6 |
2995.1 |
2940.0 |
-1.8% |
1.5% |
| China |
Shanghai Composite |
3277.1 |
2658.4 |
2606.7 |
-1.9% |
-20.5% |
|
|
|
|
|
|
|
| India |
Sensex 30 |
17464.8 |
18144.0 |
18167.0 |
0.1% |
4.0% |
| Indonesia |
Jakarta Composite |
2534.4 |
3060.6 |
3053.0 |
-0.2% |
20.5% |
| Malaysia |
KLCI |
1272.8 |
1360.5 |
1360.2 |
0.0% |
6.9% |
| Philippines |
PSEi |
3052.7 |
3516.3 |
3469.5 |
-1.3% |
13.7% |
| Taiwan |
Taiex |
8188.1 |
7963.3 |
7891.6 |
-0.9% |
-3.6% |
| Thailand |
SET |
734.5 |
875.1 |
862.2 |
-1.5% |
17.4% |
|
|
|
|
|
|
|
| Europe |
|
|
|
|
|
|
| UK |
FTSE 100 |
5412.9 |
5332.4 |
5275.4 |
-1.1% |
-2.5% |
| France |
CAC |
3936.3 |
3716.1 |
3610.9 |
-2.8% |
-8.3% |
| Germany |
XETRA DAX |
5957.4 |
6259.6 |
6110.4 |
-2.4% |
2.6% |
|
|
|
|
|
|
|
| North America |
|
|
|
|
|
|
| United States |
Dow |
10428.1 |
10653.6 |
10303.2 |
-3.3% |
-1.2% |
|
NASDAQ |
2269.2 |
2288.5 |
2173.5 |
-5.0% |
-4.2% |
|
S&P 500 |
1115.1 |
1121.6 |
1079.3 |
-3.8% |
-3.2% |
| Canada |
S&P/TSX Comp. |
11746.1 |
11800.0 |
11528.3 |
-2.3% |
-1.9% |
| Mexico |
Bolsa |
32120.5 |
32917.9 |
32099.8 |
-2.5% |
-0.1% |
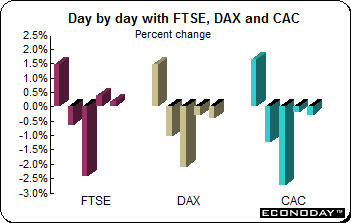 Stocks seesawed Friday but in the end could not salvage the week as the FTSE, DAX and CAC lost ground despite a spate of better than expected economic data that showed German growth accelerating at a much faster clip than expected while French growth managed to beat forecasts. Stocks seesawed Friday but in the end could not salvage the week as the FTSE, DAX and CAC lost ground despite a spate of better than expected economic data that showed German growth accelerating at a much faster clip than expected while French growth managed to beat forecasts.
Second quarter EMU GDP grew a much better than forecast 1 percent thanks to Germany’s best quarterly performance since reunification which compensated for slow growth in Spain and in Italy and a sharp decline in Greece. The figures highlighted the sharp divergence in growth rates between Germany and the southern European countries that are at the heart of the Continent’s sovereign debt crisis. In contrast to Germany’s 2.2 percent surge was Greece’s 1.5 percent contraction. After data were released, there were signs of investors shifting out of riskier assets amid fears that divergent growth rates in the region might hamper recovery.
Trade figures released separately by Eurostat on Friday illustrated even more starkly the divergence between northern and southern Europe. Germany’s trade surplus was €60.2 billion from January through May, dwarfing the rest of Europe. German companies have benefited from investor concern about debt problems in Greece and Spain, which have pushed down the value of the euro against the dollar and made German products cheaper abroad. The automaker Volkswagen, for example, said Friday it sold more than 4 million vehicles from January to July, its best performance ever in that time period.
In its monthly report, the European Central Bank offered no indication it would soon join the Fed in loosening policy and lowering interest rates. The ECB said that while growth had probably peaked in the second quarter, “the available data for the third quarter are better than expected” and “inflation expectations remain firmly anchored”.
BOE Cuts Forecast
In its quarterly Inflation Report released Wednesday the Bank of England said that inflation had already peaked but would remain well above the Bank’s two percent inflation target well into next year before declining below that level in two years time. However, the BoE acknowledged considerable uncertainty surrounding its latest projections and there was a range of views among the monetary policy committee members on where the CPI was headed. The Bank said that spare capacity would bring inflation back below the target but was uncertain about the extent to which inflation would moderate.
The Bank of England lowered its forecast for economic growth, but even its revised outlook is more optimistic than the predictions of many private sector economists. The Bank projects that GDP will grow 1.6 percent in 2010, down slightly from the 1.7 percent forecast in May. But the outlook for growth next year has been slashed to 2.7 percent from the 3.4 percent. And for 2012, the Bank foresees expansion of 3.1 percent, down from 3.5 percent in May. Analysts said that the Bank is more confident than other forecasters that its policy operations will stimulate demand. Part of the Bank’s reasoning may relate to its expectation that the planned VAT increase to 20 percent in January may not be passed on to consumers in full, allowing consumption to expand.
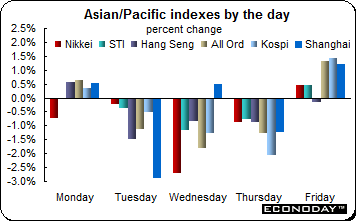 Most equity indexes here suffered from a midweek slump with gains on Monday and Friday. Once again, equities began the week on a positive note only to succumb to gravity mid-week. Friday’s gains were attributed to trader bargain hunting at lower levels. Trading volumes were relatively light as most preferred to stay on the sidelines awaiting direction from the U.S. Only the Sensex managed to edge up (0.1 percent) on the week. Most equity indexes here suffered from a midweek slump with gains on Monday and Friday. Once again, equities began the week on a positive note only to succumb to gravity mid-week. Friday’s gains were attributed to trader bargain hunting at lower levels. Trading volumes were relatively light as most preferred to stay on the sidelines awaiting direction from the U.S. Only the Sensex managed to edge up (0.1 percent) on the week.
On Thursday, Asian markets ended in negative territory after a sharp sell-off in Wall Street in the previous session on concerns about a slowdown in the global economic recovery. The unexpected rise in unemployment rate in Australia to 5.3 percent combined with the decision of Bank of Korea to keep interest rates unchanged at 2.25 percent also negatively affected market sentiment.
Concerns for most of the week about the global economic recovery dominated especially after the Federal Reserve acknowledged that the U.S. economy has slowed down in recent months and also cautioned that the economic recovery will be more modest than anticipated over the near term. And China's economy is also showing definite signs of slowdown, affecting market sentiment in the region.
The Bank of Japan, in its latest monthly review of economic developments, stated that the Japanese economic recovery is likely to proceed at a moderate pace driven by strong growth in emerging economies. The central bank said exports and production will continue to be driven by growth in emerging economies, but the pace of growth is likely to slow. Meanwhile, the bank expects domestic demand to improve at a moderate pace.
The minutes of the Bank of Japan's policy board meeting held on July 14th and 15th revealed that the monetary policy board members felt that both upside and downside risks to the Japanese economy are increasing, and opined that the pace of Japanese economic growth may slow. The minutes further added that there remains a serious degree of instability among the global financial markets. The board members added that they would closely monitor developments in the U.S. economy.
China’s latest data
 China released its monthly spate of economic data last week. The data revealed that the Chinese economy is beginning to cool after setting a torrid pace in the first half of the year. In July, Chinese fixed investment and industrial production continued to decelerate, though net exports expanded and consumer inflation picked up. Retail sales were weaker than expected, slowing in real terms as consumer prices rose at a faster pace. China released its monthly spate of economic data last week. The data revealed that the Chinese economy is beginning to cool after setting a torrid pace in the first half of the year. In July, Chinese fixed investment and industrial production continued to decelerate, though net exports expanded and consumer inflation picked up. Retail sales were weaker than expected, slowing in real terms as consumer prices rose at a faster pace.
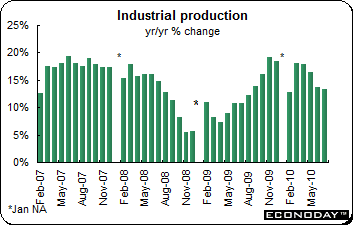
China's growth trajectory began slowing in the second quarter with GDP growth easing from 11.9 percent on the year in the first quarter to 10.3 percent in the second. Investment remains the primary driver of growth in the third quarter and its slowing will weigh on GDP growth in the second half of the year. The moderation in China’s economic growth is no accident. A series of government policies, as varied as limits on bank loans to restrictions on real estate investments, have been aimed at preventing the economy from overheating and fanning inflation.
Industrial output rose 13.4 percent last month compared with the same month last year after increasing by 13.7 percent the month before. Much the same pattern was evident in fixed asset investment, which was up 24.9 percent last month compared with a year earlier. It had been ahead by 25.5 percent in June. Meanwhile, retail sales were up 17.9 percent in July compared with the same month last year, as Chinese consumers with rising wages continued to flock to stores. But sales had grown 18.3 percent in June compared with a year earlier. July consumer prices were up 3.3 percent, accelerating from an increase of 2.9 percent in June. But there were signs that inflation could begin to moderate. Producer prices were 4.8 percent higher than a year ago, after being up 6.4 percent in June and 7.1 percent in May.
Bank of Japan
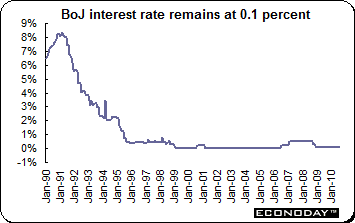 As universally expected, the Bank of Japan left its key interest rate at 0.1 percent. It also left unchanged its bank loan program and monthly bond purchases. It also left its forecast for the economy unchanged with growth likely to be on a moderate economic recovery path. But the monetary policy board said they must watch global market moves and their impact on the economy. The monetary policy board said that financial conditions in Japan are improving. The bank doubled its credit program to ¥20 trillion ($232 billion) in March, and in June unveiled a ¥3 trillion plan to encourage lending in growth areas. As universally expected, the Bank of Japan left its key interest rate at 0.1 percent. It also left unchanged its bank loan program and monthly bond purchases. It also left its forecast for the economy unchanged with growth likely to be on a moderate economic recovery path. But the monetary policy board said they must watch global market moves and their impact on the economy. The monetary policy board said that financial conditions in Japan are improving. The bank doubled its credit program to ¥20 trillion ($232 billion) in March, and in June unveiled a ¥3 trillion plan to encourage lending in growth areas.
The forecast reflects BoJ deputy governor Hirohide Yamaguchi’s July 21st comments concerning the yen. He noted that companies are better able to cope with the yen’s gain now than in November 2009, when it hit the highest level since 1995. But the Bank will find it difficult to hold this view should the yen continue to appreciate toward a 15 year high. To date the BoJ has acknowledged that the recovery has been underpinned by improving overseas economic conditions boosting export activity. Recent reports show Japan’s expansion is slowing as export growth cools. June industrial production fell the most in 16 months and the unemployment rate climbed to a seven-month high. Deflation is moderating — June consumer prices declined 1 percent, the smallest drop in more than a year.
 The yen, euro and pound sterling dropped against their U.S. counterpart as investors once again fled from risk. The commodity currencies — the Australian, Canadian and New Zealand dollars — dropped as well as investors sold these currencies on the outlook for slower global growth. The yen, euro and pound sterling dropped against their U.S. counterpart as investors once again fled from risk. The commodity currencies — the Australian, Canadian and New Zealand dollars — dropped as well as investors sold these currencies on the outlook for slower global growth.
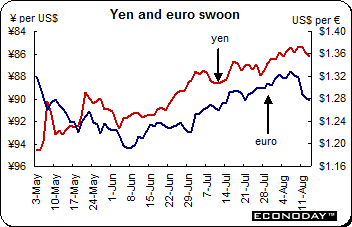
In Japan, the strength of the yen has hurt the mainstays of growth — exporters. The high value of the yen cuts into repatriated earning and dampens the ability of exporters to compete. But the options available to prevent the yen from appreciating further appear limited. The U.S. dollar's recent decline to the 84 to 85 yen level is fueling anxiety about the possible impact on the economic recovery, including a dropping in equity prices along with drooping corporate and consumer sentiment. Finance Minister Yoshihiko Noda told a news conference that the government would continue to monitor the situation closely. And reports that the BoJ was contacting financial institutions about their currency rate conditions sparked speculation that a yen-selling intervention might be in the offing and weakened the Japanese currency.
While market participants are wary of a major currency intervention, many know that the government and the Bank have only limited tools for dealing with a strong yen. Japanese monetary authorities last conducted massive interventions in the 2003 to 2004 period. Analysts broadly agree that Japanese authorities may be held back by concerns that intervention would jar with the international consensus that major economies should allow their currencies to float freely. Another option would be for the BoJ to roll out additional monetary easing measures, especially since the yen's recent strength was triggered by the FOMC’s announcement that it would buy long-term government bonds.
On Wednesday, the yen hit a multi-month high of ¥84.79 against the U.S. dollar. But considerations such as haven buying for the dollar and the risk of Japanese intervention in the market have kept the currency from rising further.
The euro continued to pull back against the dollar and yen, hurt by renewed risk aversion amid concerns that policy makers have run out of weapons to support the global economy. With stocks slumping around the world, the euro dipped to a two-week low of $1.2895, falling from last week's three-month high of 1.3333.
Selected currencies — weekly results
|
|
2009 |
2010 |
% Change |
|
|
Dec 31 |
Aug 6 |
Aug 13 |
Week |
2010 |
| U.S. $ per currency |
|
|
|
|
|
|
| Australia |
A$ |
0.898 |
0.919 |
0.892 |
-2.9% |
-0.6% |
| New Zealand |
NZ$ |
0.727 |
0.732 |
0.706 |
-3.7% |
-2.9% |
| Canada |
C$ |
0.955 |
0.973 |
0.960 |
-1.3% |
0.5% |
| Eurozone |
euro (€) |
1.433 |
1.329 |
1.275 |
-4.1% |
-11.0% |
| UK |
pound sterling (£) |
1.617 |
1.596 |
1.559 |
-2.3% |
-3.5% |
|
|
|
|
|
|
|
| Currency per U.S. $ |
|
|
|
|
|
|
| China |
yuan |
6.827 |
6.769 |
6.796 |
-0.4% |
0.5% |
| Hong Kong |
HK$* |
7.753 |
7.762 |
7.773 |
-0.1% |
-0.3% |
| India |
rupee |
46.525 |
46.160 |
46.765 |
-1.3% |
-0.5% |
| Japan |
yen |
93.125 |
85.410 |
86.284 |
-1.0% |
7.9% |
| Malaysia |
ringgit |
3.427 |
3.148 |
3.168 |
-0.6% |
8.2% |
| Singapore |
Singapore $ |
1.405 |
1.346 |
1.363 |
-1.2% |
3.1% |
| South Korea |
won |
1164.000 |
1161.900 |
1183.700 |
-1.8% |
-1.7% |
| Taiwan |
Taiwan $ |
31.985 |
31.738 |
31.899 |
-0.5% |
0.3% |
| Thailand |
baht |
33.400 |
32.025 |
31.900 |
0.4% |
4.7% |
| Switzerland |
Swiss franc |
1.035 |
1.038 |
1.052 |
-1.4% |
-1.6% |
| *Pegged to U.S. dollar |
|
|
|
|
|
|
| Source: Bloomberg |
|
|
|
|
|
|
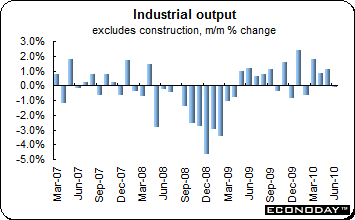 June industrial production excluding construction edged down 0.1 percent after rising an upwardly revised 1.1 percent in May. On the year, output slowed to 8.2 percent from 9.9 percent in May. Intermediate goods output dropped 0.6 percent on the month but was still up 11.7 percent on the year. Consumer durables were down 0.9 percent on the month while nondurables edged down 0.1 percent. On the year, they were up 7.6 percent and 3.0 percent respectively. Capital goods were up 0.3 percent and 8.6 percent on the year while energy edged up 0.2 percent and was up 6.1 percent on the year. Regionally, output disappointed in Germany where production slid by 0.5 percent. However, production in Italy was up another 0.6 percent after mostly stronger gains over the previous five months. Spanish output declined 0.3 percent after declining 0.4 percent in May. Output elsewhere was mixed. June industrial production excluding construction edged down 0.1 percent after rising an upwardly revised 1.1 percent in May. On the year, output slowed to 8.2 percent from 9.9 percent in May. Intermediate goods output dropped 0.6 percent on the month but was still up 11.7 percent on the year. Consumer durables were down 0.9 percent on the month while nondurables edged down 0.1 percent. On the year, they were up 7.6 percent and 3.0 percent respectively. Capital goods were up 0.3 percent and 8.6 percent on the year while energy edged up 0.2 percent and was up 6.1 percent on the year. Regionally, output disappointed in Germany where production slid by 0.5 percent. However, production in Italy was up another 0.6 percent after mostly stronger gains over the previous five months. Spanish output declined 0.3 percent after declining 0.4 percent in May. Output elsewhere was mixed.
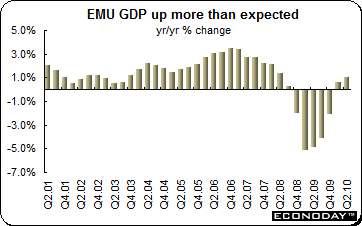 Second quarter flash gross domestic product was up a greater than expected 1.0 percent on the quarter and 1.7 percent on the year thanks to the surprise leap in Germany of 2.2 percent growth. French GDP growth was also slightly stronger than generally expected at 0.6 percent while Italy was up 0.4 percent on the quarter. Spain GDP gained 0.2 percent. In keeping with Eurostat practice, no information on GDP components was available with its flash estimate. However, eurozone industry remained dynamic, with a quarterly gain of 2.5 percent. On the expenditure side, private consumption probably recovered a bit as French consumption rebounded on the back of rising services outlays and German consumption contributed somewhat to second quarter growth. Investment is likely to have recovered along with the industry upswing and the comeback in construction after the winter slump. Second quarter flash gross domestic product was up a greater than expected 1.0 percent on the quarter and 1.7 percent on the year thanks to the surprise leap in Germany of 2.2 percent growth. French GDP growth was also slightly stronger than generally expected at 0.6 percent while Italy was up 0.4 percent on the quarter. Spain GDP gained 0.2 percent. In keeping with Eurostat practice, no information on GDP components was available with its flash estimate. However, eurozone industry remained dynamic, with a quarterly gain of 2.5 percent. On the expenditure side, private consumption probably recovered a bit as French consumption rebounded on the back of rising services outlays and German consumption contributed somewhat to second quarter growth. Investment is likely to have recovered along with the industry upswing and the comeback in construction after the winter slump.
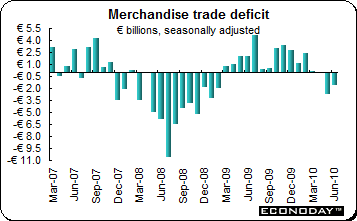 June seasonally adjusted merchandise trade deficit was €1.6 billion. Exports were up 5.2 percent while imports gained 4.3 percent. May’s unexpectedly large deficit was revised to €2.7 billion from the original €3.0 billion estimate. In non-seasonally adjusted terms, the balance returned to surplus (€2.4 billion) after May’s upwardly revised €3.3 billion shortfall. June seasonally adjusted merchandise trade deficit was €1.6 billion. Exports were up 5.2 percent while imports gained 4.3 percent. May’s unexpectedly large deficit was revised to €2.7 billion from the original €3.0 billion estimate. In non-seasonally adjusted terms, the balance returned to surplus (€2.4 billion) after May’s upwardly revised €3.3 billion shortfall.
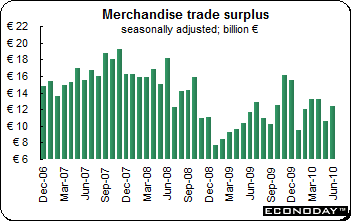 The June seasonally adjusted merchandise trade surplus jumped to €12.4 billion from a revised €10.6 billion in May. This was above analysts expectations of €11.8 billion. Exports growth was twice that of imports. However, while export growth slowed to 3.8 percent on the month after soaring by 7.8 percent in May, imports only managed to increase by 1.8 percent after climbing by 13.7 percent in May. On the year, exports were up 25.7 percent while imports gained 29.7 percent. Exports to other EMU states were up 22 percent on the year but jumped by 26.6 percent to non-EMU countries. Meanwhile purchases by other EMU countries were up 25.4 percent on the year while inflows from outside the EU were up 42.8 percent. The unadjusted trade surplus increased to €14.1 billion from May's €9.8 billion level. The June seasonally adjusted merchandise trade surplus jumped to €12.4 billion from a revised €10.6 billion in May. This was above analysts expectations of €11.8 billion. Exports growth was twice that of imports. However, while export growth slowed to 3.8 percent on the month after soaring by 7.8 percent in May, imports only managed to increase by 1.8 percent after climbing by 13.7 percent in May. On the year, exports were up 25.7 percent while imports gained 29.7 percent. Exports to other EMU states were up 22 percent on the year but jumped by 26.6 percent to non-EMU countries. Meanwhile purchases by other EMU countries were up 25.4 percent on the year while inflows from outside the EU were up 42.8 percent. The unadjusted trade surplus increased to €14.1 billion from May's €9.8 billion level.
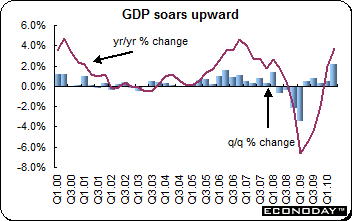 Second quarter flash gross domestic product was up 2.2 percent on the quarter and up a workday adjusted 3.7 percent on the year. First quarter GDP growth was revised to and increase of 0.5 percent (original estimate was 0.2 percent) on the quarter and 2.0 percent on the year from 1.6 percent. The unadjusted figures showed annual growth accelerating to 4.1 percent from 2.1 percent. As usual with the flash GDP report, the Federal Statistics Office provided few details about how the bottom line was arrived at. However, it did signal advances in exports and fixed investment as well as an increase in private and public spending. There was no mention of inventory changes, which had contributed 1.9 points to first quarter GDP growth according to previous calculations, Second quarter flash gross domestic product was up 2.2 percent on the quarter and up a workday adjusted 3.7 percent on the year. First quarter GDP growth was revised to and increase of 0.5 percent (original estimate was 0.2 percent) on the quarter and 2.0 percent on the year from 1.6 percent. The unadjusted figures showed annual growth accelerating to 4.1 percent from 2.1 percent. As usual with the flash GDP report, the Federal Statistics Office provided few details about how the bottom line was arrived at. However, it did signal advances in exports and fixed investment as well as an increase in private and public spending. There was no mention of inventory changes, which had contributed 1.9 points to first quarter GDP growth according to previous calculations,
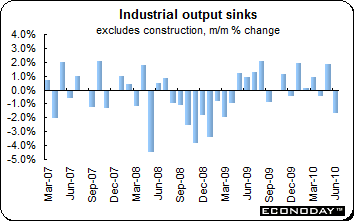 June industrial production excluding construction plunged 1.7 percent but was up 5.7 percent on the year. Manufacturing output dropped 1.3 percent. With the exception of refining which was up 5.9 percent nearly all components declined. Autos plunged 7.4 percent while transport equipment declined 4.7 percent and metal products dropped 1.7 percent. Consumer durables were down 2.9 percent while capital goods dropped 2.3 percent. Energy declined 3.9 percent. June industrial production excluding construction plunged 1.7 percent but was up 5.7 percent on the year. Manufacturing output dropped 1.3 percent. With the exception of refining which was up 5.9 percent nearly all components declined. Autos plunged 7.4 percent while transport equipment declined 4.7 percent and metal products dropped 1.7 percent. Consumer durables were down 2.9 percent while capital goods dropped 2.3 percent. Energy declined 3.9 percent.
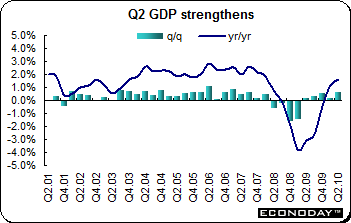 Second quarter flash gross domestic product was up 0.6 percent on the quarter and 1.2 percent on the year. First quarter GDP was revised upward to 0.2 percent on the quarter from the original estimate of 0.1 percent. All components were positive in contrast to the first quarter. Gross fixed capital formation jumped 0.8 percent after sinking 0.9 percent in the first quarter while household consumption was up 0.4 percent on the quarter from unchanged in the first quarter. Within fixed capital formation, Businesses were up 1.1 percent after dropping 1.0 percent in the first quarter while households spending here inched up 0.1 percent after dropping 0.5 percent. However, net exports subtracted 0.4 percentage points after contributing 0.5 percentage points in the first quarter. Second quarter flash gross domestic product was up 0.6 percent on the quarter and 1.2 percent on the year. First quarter GDP was revised upward to 0.2 percent on the quarter from the original estimate of 0.1 percent. All components were positive in contrast to the first quarter. Gross fixed capital formation jumped 0.8 percent after sinking 0.9 percent in the first quarter while household consumption was up 0.4 percent on the quarter from unchanged in the first quarter. Within fixed capital formation, Businesses were up 1.1 percent after dropping 1.0 percent in the first quarter while households spending here inched up 0.1 percent after dropping 0.5 percent. However, net exports subtracted 0.4 percentage points after contributing 0.5 percentage points in the first quarter.
 June unadjusted merchandise trade gap widened to €3.1 billion from €0.9 billion in the same month a year ago. On the year, exports were up 22.8 percent with non-EU exports jumping by 26.4 percent and with exports to the EU up 20.1 percent. Imports were up 30.4 percent on the year. Imports from non-EU countries were up 37.4 percent while non-EU country imports were up 25.5 percent. On a seasonally adjusted basis, the trade gap narrowed to €2.4 billion from €2.9 billion in May. On a monthly basis, exports increased 5.6 percent while imports were up 3.2 percent. June unadjusted merchandise trade gap widened to €3.1 billion from €0.9 billion in the same month a year ago. On the year, exports were up 22.8 percent with non-EU exports jumping by 26.4 percent and with exports to the EU up 20.1 percent. Imports were up 30.4 percent on the year. Imports from non-EU countries were up 37.4 percent while non-EU country imports were up 25.5 percent. On a seasonally adjusted basis, the trade gap narrowed to €2.4 billion from €2.9 billion in May. On a monthly basis, exports increased 5.6 percent while imports were up 3.2 percent.
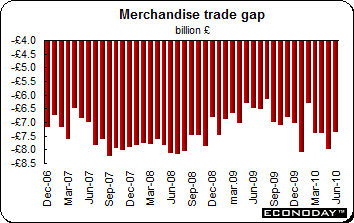 June merchandise trade deficit narrowed to Stg7.4 billion from a revised Stg8.0 billion gap in May. Exports advanced a healthy 4.3 percent while imports gained 1.0 percent. Excluding oil and erratics, the trade gap narrowed to Stg6.9 billion from Stg7.3 billion in May. The deficit with EU countries narrowed to Stg3.1 billion from Stg3.5 billion in May. The deficit with non-EU countries also narrowed — to Stg4.3 billion from Stg4.5 billion in May. June merchandise trade deficit narrowed to Stg7.4 billion from a revised Stg8.0 billion gap in May. Exports advanced a healthy 4.3 percent while imports gained 1.0 percent. Excluding oil and erratics, the trade gap narrowed to Stg6.9 billion from Stg7.3 billion in May. The deficit with EU countries narrowed to Stg3.1 billion from Stg3.5 billion in May. The deficit with non-EU countries also narrowed — to Stg4.3 billion from Stg4.5 billion in May.
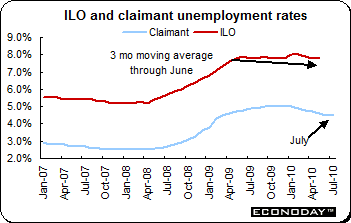 July claimant count unemployment dropped a much less than anticipated 3,800. The claimant count unemployment rate remained at 4.5 percent for the second month. There was also a revision to the June figures meaning that the claimant count was down 15,900 last month, less than the initially estimated 20,800 decline. ILO unemployment for the three months ending in June dropped by 49,000 leaving this unemployment rate at 7.8 percent. At the same time, this measure of employment jumped by 184,000 for the same three months. The increase, the largest since 1989, raised the rate of employment from 70.3 percent to 70.5 percent. While the jump in employment was mainly due to an increase of 115,000 part-time jobs, full time jobs increased by 68,000 — the highest increase since March to May 2008. Wage pressures remained subdued with average weekly earnings declining to 1.3 percent in the three months to June compared with a year earlier, down from 2.7 percent in the previous month. Excluding bonuses, average weekly earnings for regular pay eased to 1.6 percent from 1.8 percent. July claimant count unemployment dropped a much less than anticipated 3,800. The claimant count unemployment rate remained at 4.5 percent for the second month. There was also a revision to the June figures meaning that the claimant count was down 15,900 last month, less than the initially estimated 20,800 decline. ILO unemployment for the three months ending in June dropped by 49,000 leaving this unemployment rate at 7.8 percent. At the same time, this measure of employment jumped by 184,000 for the same three months. The increase, the largest since 1989, raised the rate of employment from 70.3 percent to 70.5 percent. While the jump in employment was mainly due to an increase of 115,000 part-time jobs, full time jobs increased by 68,000 — the highest increase since March to May 2008. Wage pressures remained subdued with average weekly earnings declining to 1.3 percent in the three months to June compared with a year earlier, down from 2.7 percent in the previous month. Excluding bonuses, average weekly earnings for regular pay eased to 1.6 percent from 1.8 percent.
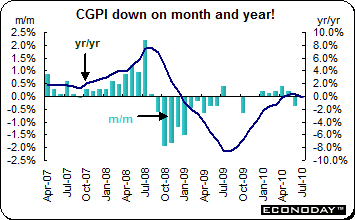 July corporate goods price index edged down 0.1 percent both on the month and year. June’s increase was revised to a 0.4 percent gain on the year. Manufacturing industry prices were down 0.3 percent on the month and on the year. Processed food stuffs edged up 0.1 percent on the month but were down 0.8 percent on the year. On the year, electrical machinery, information & communication equipment and electronic components & devices had the largest price declines of 3.2 percent, 6.7 percent and 4.9 percent respectively. Nonferrous metals prices however were up 10.8 percent on the year. Transportation equipment prices were down 3 percent on the year. July corporate goods price index edged down 0.1 percent both on the month and year. June’s increase was revised to a 0.4 percent gain on the year. Manufacturing industry prices were down 0.3 percent on the month and on the year. Processed food stuffs edged up 0.1 percent on the month but were down 0.8 percent on the year. On the year, electrical machinery, information & communication equipment and electronic components & devices had the largest price declines of 3.2 percent, 6.7 percent and 4.9 percent respectively. Nonferrous metals prices however were up 10.8 percent on the year. Transportation equipment prices were down 3 percent on the year.
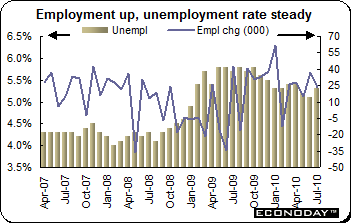 July employment jumped by 23,500 jobs to 11.236 million. The unemployment rate climbed to 5.3 percent from 5.1 percent in June. The increase in employment was driven by a rise in part time employment which was up 27,700 people to 3.369 million. That was slightly offset by a decline in full time employment which was down 4,200 people to 7.866 million. Over 129,000 jobs have been created since March. The number unemployed was up by 24,600 to 631,800. The participation rate rose to 65.5 percent from 65.3 percent in June. July employment jumped by 23,500 jobs to 11.236 million. The unemployment rate climbed to 5.3 percent from 5.1 percent in June. The increase in employment was driven by a rise in part time employment which was up 27,700 people to 3.369 million. That was slightly offset by a decline in full time employment which was down 4,200 people to 7.866 million. Over 129,000 jobs have been created since March. The number unemployed was up by 24,600 to 631,800. The participation rate rose to 65.5 percent from 65.3 percent in June.
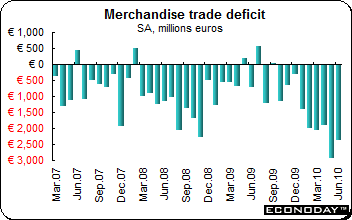
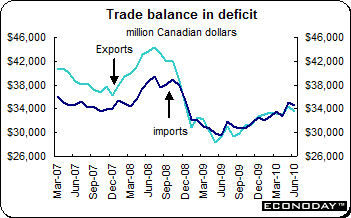 June’s merchandise trade deficit widened from C$695 million in May to C$1.1 billion. Exports dropped 2.5 percent led by industrial goods and materials. Imports decreased 1.2 percent as a result of a significant decline in energy products. Exports declined from C$34.4 billion to C$33.5 billion in June, as export prices contracted by 1.2 percent and volumes decreased by 1.3 percent. Export volumes had grown for six consecutive months. Industrial goods & materials accounted for two-thirds of the decline in the value of overall exports, followed by energy products and automotive products. A gain in exports of machinery and equipment mitigated the decrease. After a solid gain in May, imports declined from C$35.0 billion in May to C$34.6 billion. Lower imports of energy products were instrumental. Excluding energy products, imports grew 0.9 percent on the month. Higher imports of industrial goods and materials moderated the overall decline. Import prices fell 1.2 percent while volumes remained unchanged following four consecutive monthly increases. Exports to the United States were down 1.0 percent reflecting the weakness in exports of energy products while imports were up 0.8 percent. As a result, Canada's trade surplus with the United States narrowed from C$3.4 billion in May to C$3.0 billion in June. Exports to countries other than the United States dropped 7.0 percent, largely a result of declining exports to the European Union. The fall in exports outpaced a 4.6 percent decrease in imports and consequently, Canada's trade deficit with countries other than the United States rose from C$4.1 billion in May to C$4.2 billion in June. June’s merchandise trade deficit widened from C$695 million in May to C$1.1 billion. Exports dropped 2.5 percent led by industrial goods and materials. Imports decreased 1.2 percent as a result of a significant decline in energy products. Exports declined from C$34.4 billion to C$33.5 billion in June, as export prices contracted by 1.2 percent and volumes decreased by 1.3 percent. Export volumes had grown for six consecutive months. Industrial goods & materials accounted for two-thirds of the decline in the value of overall exports, followed by energy products and automotive products. A gain in exports of machinery and equipment mitigated the decrease. After a solid gain in May, imports declined from C$35.0 billion in May to C$34.6 billion. Lower imports of energy products were instrumental. Excluding energy products, imports grew 0.9 percent on the month. Higher imports of industrial goods and materials moderated the overall decline. Import prices fell 1.2 percent while volumes remained unchanged following four consecutive monthly increases. Exports to the United States were down 1.0 percent reflecting the weakness in exports of energy products while imports were up 0.8 percent. As a result, Canada's trade surplus with the United States narrowed from C$3.4 billion in May to C$3.0 billion in June. Exports to countries other than the United States dropped 7.0 percent, largely a result of declining exports to the European Union. The fall in exports outpaced a 4.6 percent decrease in imports and consequently, Canada's trade deficit with countries other than the United States rose from C$4.1 billion in May to C$4.2 billion in June.
Equities swooned last week after the Federal Reserve lowered its growth expectations for the U.S. economy and the Bank of Japan did nothing to stem the increase in the yen. And despite improved second quarter GDP estimates for the eurozone, investors remained dour looking ahead. Trading volumes were thin as investors either chose to not participate or were on vacation.
New data to evaluate will be light this week. Of main interest will be Japan’s first estimate of GDP growth for the second quarter and the German ZEW sentiment survey. And in the UK, consumer prices will attract attention as a harbinger of Bank of England policy. Also on tap are UK retail sales which will tell whether the reduced levels of unemployment are translating into increased volumes here.
| Central Bank activities |
|
| August 18 |
UK |
Bank of England MPC Minutes |
|
|
|
| The following indicators will be released this week... |
| Europe |
|
|
| August 16 |
EMU |
Harmonized Index of Consumer Prices (July) |
| August 17 |
Germany |
ZEW Business Confidence (August) |
|
UK |
Consumer Price Index (July) |
| August 19 |
Germany |
Producer Price Index (July) |
|
UK |
Retail Sales (July) |
|
|
|
| Asia/Pacific |
|
|
| August 15 |
Japan |
Gross Domestic Product (Q2.10 first estimate) |
|
|
Tertiary Sector Index (June) |
|
|
|
| Americas |
|
|
| August 17 |
Canada |
Manufacturing Sales (July) |
| August 20 |
Canada |
Consumer Price Index (July) |
Anne D Picker is the author of International Economic Indicators and Central Banks.
|
