The week’s events surged to a climax with the release of the European bank stress tests. Whether they will mollify investors concerned with the health and well-being of the European banking system remains to be seen — closer study is needed. With European and Asian markets already closed for the week, response was minimal with little reaction in still open North American markets.
Earlier in the week, better than expected earnings along with several solid European economic releases overshadowed Fed Chairman Ben Bernanke’s semi-annual congressional testimony mid-week. However, his cautious tone and a comment that the outlook for the U.S. economy was ‘unusually uncertain’ disheartened traders on Wednesday and they sold equities. But on Thursday, after Bernanke’s second day of testimony (mostly a repeat of the day before), investors changed their minds and U.S. equities enjoyed their best day of the week.
On the week, all equity indexes followed here were up with the exception of the Philippine PSEi.
European stress tests capture investor focus
The results of the European stress tests were announced after markets there closed for the week. According to the Committee of European Banking Supervisors (CEBS), seven of 91 banks tested failed the tests. All the big European banking names passed but the seven that did not either had already failed or are the weaker banks in Spain and Greece. They included five Spanish, one Greek and one German bank. These banks would see their Tier 1 capital ratios drop below 6 percent if the test’s most adverse scenario occurred. Banks that failed the tests will be required to raise additional capital. The tests only looked at the banks’ trading books and did not address exposure to sovereign debt. The regulators assumed that no European sovereign would default. The tests reportedly assumed a loss of 23.1 percent on Greek debt, 14 percent of Portuguese bonds, 12.3 percent on Spanish debt, and 4.7 percent on German state debt.
The stress tests were similar to those in the United States last year and were intended to rebuild confidence in European financial institutions that has been shaken by the sovereign debt crisis. Uncertainty about which banks may be sitting on piles of Greek debt or other potentially toxic assets has made institutions reluctant to lend to each other or to businesses, and has acted as a drag on economic growth. Whether the tests succeed in reviving confidence depends on whether investors and analysts believe they were severe enough to expose vulnerable banks — and that may not be clear for a while. Disclosure of the test results was unprecedented and came only after extensive negotiations with banks, which in Germany and some other countries could not legally be compelled to release the data. Earlier stress test exercises covered far fewer banks and authorities released only general information about the results.
|
|
2009 |
2010 |
% Change |
|
Index |
Dec 31 |
July 16 |
July 23 |
Week |
2010 |
| Asia/Pacific |
|
|
|
|
|
|
| Australia |
All Ordinaries |
4882.7 |
4437.0 |
4475.1 |
0.9% |
-8.3% |
| Japan |
Nikkei 225 |
10546.4 |
9408.4 |
9431.0 |
0.2% |
-10.6% |
|
Topix |
907.6 |
840.6 |
841.3 |
0.1% |
-7.3% |
| Hong Kong |
Hang Seng |
21872.5 |
20250.2 |
20815.3 |
2.8% |
-4.8% |
| S. Korea |
Kospi |
1682.8 |
1738.5 |
1758.1 |
1.1% |
4.5% |
| Singapore |
STI |
2897.6 |
2957.7 |
2973.5 |
0.5% |
2.6% |
| China |
Shanghai Composite |
3277.1 |
2424.3 |
2572.0 |
6.1% |
-21.5% |
|
|
|
|
|
|
|
| India |
Sensex 30 |
17464.8 |
17955.8 |
18131.0 |
1.0% |
3.8% |
| Indonesia |
Jakarta Composite |
2534.4 |
2992.5 |
3042.0 |
1.7% |
20.0% |
| Malaysia |
KLCI |
1272.8 |
1336.7 |
1345.7 |
0.7% |
5.7% |
| Philippines |
PSEi |
3052.7 |
3442.7 |
3416.1 |
-0.8% |
11.9% |
| Taiwan |
Taiex |
8188.1 |
7664.6 |
7761.2 |
1.3% |
-5.2% |
| Thailand |
SET |
734.5 |
827.5 |
840.2 |
1.5% |
14.4% |
|
|
|
|
|
|
|
| Europe |
|
|
|
|
|
|
| UK |
FTSE 100 |
5412.9 |
5158.9 |
5312.6 |
3.0% |
-1.9% |
| France |
CAC |
3936.3 |
3500.2 |
3607.1 |
3.1% |
-8.4% |
| Germany |
XETRA DAX |
5957.4 |
6040.3 |
6166.3 |
2.1% |
3.5% |
|
|
|
|
|
|
|
| North America |
|
|
|
|
|
|
| United States |
Dow |
10428.1 |
10097.9 |
10424.6 |
3.2% |
0.0% |
|
NASDAQ |
2269.2 |
2179.1 |
2269.5 |
4.1% |
0.0% |
|
S&P 500 |
1115.1 |
1064.9 |
1102.7 |
3.5% |
-1.1% |
| Canada |
S&P/TSX Comp. |
11746.1 |
11569.7 |
11714.2 |
1.2% |
-0.3% |
| Mexico |
Bolsa |
32120.5 |
31783.4 |
32806.0 |
3.2% |
2.1% |
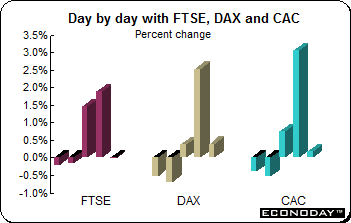 The FTSE, DAX and CAC were up this week thanks to better than anticipated earnings and mostly good economic data. UK retail sales and second quarter gross domestic product were up more than anticipated. And eurozone services, manufacturing and industrial orders all beat forecasts reducing fears about economic fragility. In Germany, the Ifo readings were above expectations. However consumer spending data in both Italy and France were down on the month. The FTSE, DAX and CAC were up this week thanks to better than anticipated earnings and mostly good economic data. UK retail sales and second quarter gross domestic product were up more than anticipated. And eurozone services, manufacturing and industrial orders all beat forecasts reducing fears about economic fragility. In Germany, the Ifo readings were above expectations. However consumer spending data in both Italy and France were down on the month.
But on Friday, stocks were virtually unchanged Friday as investors awaited the stress test results which were released after the markets closed here. Banks offset gains elsewhere. On the week, the FTSE was up 3 percent, the CAC gained 3.1 percent and the DAX was up 2.1 percent.
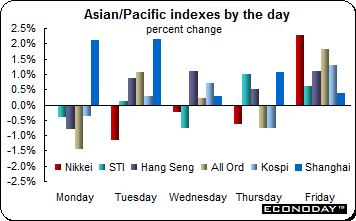 All Asian/Pacific equity indexes followed here were up last week with the exception of the Philippine PSEi. Gains ranged from the Topix — it barely edged up 0.1 percent — to the Shanghai Composite — it jumped 6.1 percent. It should be noted however, both of these indexes are still down on the year by 7.3 percent and 21.5 percent respectively. All Asian/Pacific equity indexes followed here were up last week with the exception of the Philippine PSEi. Gains ranged from the Topix — it barely edged up 0.1 percent — to the Shanghai Composite — it jumped 6.1 percent. It should be noted however, both of these indexes are still down on the year by 7.3 percent and 21.5 percent respectively.
With little new important economic data available in the region, attention focused on the spate of earnings reports from U.S. companies and Fed Chairman Ben Bernanke’s congressional testimony. But investors were also edgy as they awaited the results of Europe’s bank stress tests which would be announced long after markets here were closed for the week. However enough information had been leaked in advance to reassure markets that the results would be a net positive.
Asian markets followed here ended the last day of trading session for the week in positive territory, lifted by strong gains in the U.S. and on earnings optimism. Better than expected earnings reported by Microsoft after U.S. markets closed and buoyant European economic data also lifted market sentiment. Higher commodity and oil prices led to gains across the markets as traders await the stress test results of European banks later in the day. The Shanghai Composite was up each of the five days gaining 6.1 percent on the week, reducing its 2010 decline to 21.6 percent. The Chinese market has undergone a resurrection, having posted its best week in seven months.
The Japan Ministry of Finance revealed that Japanese investors purchased a net ¥1.305 trillion in foreign bonds and notes last week. The statement further revealed that Japanese residents also bought a net ¥49.2 billion in foreign stocks. Over the same period, foreign investors sold a net ¥29.8 billion in Japanese stocks and purchased a net ¥231.2 billion in Japanese bonds.
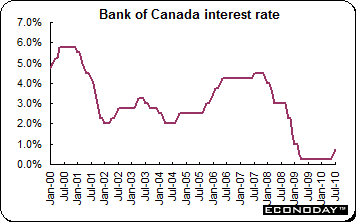 As expected, the Bank of Canada increased its policy interest rate by 25 basis points for the second month despite growing uncertainty over both the domestic and global economic outlook. Its target rate for overnight loans between commercial banks now stands at 0.75 percent. In its statement, the Bank is still cautious about future rate increases saying that further increases would have to be weighed carefully. It said they were worried about global growth commenting that the recovery was not yet self-sustaining. Saying the recovery would be more gradual than expected, the Bank lowered its growth estimate for Canada to 3.5 percent, adjusted for inflation, from April’s 3.7 percent estimate. Next year’s growth rate is now projected at 2.9 percent, down from the previous 3.1 percent. The Bank also noted that Canadian business investment is being held back by global uncertainty. The continuing rise in interest rates reflects the bank’s eagerness to move gradually towards a more normal monetary policy rather than face the risk of being forced into more aggressive tightening later. As expected, the Bank of Canada increased its policy interest rate by 25 basis points for the second month despite growing uncertainty over both the domestic and global economic outlook. Its target rate for overnight loans between commercial banks now stands at 0.75 percent. In its statement, the Bank is still cautious about future rate increases saying that further increases would have to be weighed carefully. It said they were worried about global growth commenting that the recovery was not yet self-sustaining. Saying the recovery would be more gradual than expected, the Bank lowered its growth estimate for Canada to 3.5 percent, adjusted for inflation, from April’s 3.7 percent estimate. Next year’s growth rate is now projected at 2.9 percent, down from the previous 3.1 percent. The Bank also noted that Canadian business investment is being held back by global uncertainty. The continuing rise in interest rates reflects the bank’s eagerness to move gradually towards a more normal monetary policy rather than face the risk of being forced into more aggressive tightening later.
The Bank's June increase was the first in the Group of Seven after last year's global recession, and Bank Chairman Mark Carney has said future moves are not 'preordained.' Recent economic data have been mixed. Economic growth stalled in April, while job creation was almost five times stronger than expected in June. Employment has increased by over 308,000 so far this year. And in its June 21 report, the BoC said that the country's financial system faces a higher level of risk than at the end of last year because of global strains.
In its Monetary Policy Report, the Bank of Canada provided more insight to the new growth and inflation forecasts contained in its policy announcement. The Bank was clear that over the long term their projection includes a gradual reduction in monetary policy stimulus. While the current risks are ‘roughly balanced’ there are many uncertainties surrounding the outlook. The Bank made no material changes to the inflation outlook, expecting its core measure (which excludes eight volatile items) to hover slightly below the 2 percent midpoint of its 1 percent to 3 percent inflation target range until the end of 2012.
 The euro’s rebound from the four year low it hit against the dollar in June has been impressive. Last week it broke through $1.30 for the first time in more than two months as fears about the eurozone debt crisis begin to recede. When the euro tumbled to $1.1875 in early June, many traders were braced for the euro to fall further, even to parity with the dollar. However, as investors’ attention shifted to signs of weakness in the U.S. economy and slowing Chinese growth, hedge funds and other traders who shorted the euro began to unwind their positions. Weak economic data and a downgrade of the Federal Reserve’s growth forecast have weighed heavily on the dollar, which had until now benefited from safe haven demand. The euro’s rebound from the four year low it hit against the dollar in June has been impressive. Last week it broke through $1.30 for the first time in more than two months as fears about the eurozone debt crisis begin to recede. When the euro tumbled to $1.1875 in early June, many traders were braced for the euro to fall further, even to parity with the dollar. However, as investors’ attention shifted to signs of weakness in the U.S. economy and slowing Chinese growth, hedge funds and other traders who shorted the euro began to unwind their positions. Weak economic data and a downgrade of the Federal Reserve’s growth forecast have weighed heavily on the dollar, which had until now benefited from safe haven demand.
The yen’s surge to its highest level of the year against the dollar has put investors on alert for possible currency intervention by the Japanese authorities. If Japan acts to shield its stock markets and exporters from the rising yen, it will be the first time they have intervened in the foreign exchange markets since April 2004. Analysts think that if the dollar goes below ¥85 there will be intervention. Verbal intervention from officials have done little to stem the currency’s rise.
The Swiss National Bank has revealed it had lost more than SFr14 billion in trying to keep down the value of the franc through currency interventions in the first half of this year. The scale of the losses reflect the extent to which the central bank sold francs and bought foreign currencies during a series of interventions, culminating around May. In the first half of this year, the SNB’s foreign exchange holdings surged by SFr132 billion ($126 billion, €98 billion, £83 billion). The SNB said last month it had stopped intervention because deflationary risks from the surging franc had declined. But most economists attributed the change in policy to deepening concerns about the risks from the huge foreign reserves.
Selected currencies — weekly results
|
|
2009 |
2010 |
% Change |
|
|
Dec 31 |
July 16 |
July 23 |
Week |
2010 |
| U.S. $ per currency |
|
|
|
|
|
|
| Australia |
A$ |
0.898 |
0.870 |
0.897 |
3.1% |
-0.1% |
| New Zealand |
NZ$ |
0.727 |
0.711 |
0.727 |
2.3% |
0.1% |
| Canada |
C$ |
0.955 |
0.948 |
0.965 |
1.8% |
1.0% |
| Eurozone |
euro (€) |
1.433 |
1.293 |
1.291 |
-0.1% |
-9.9% |
| UK |
pound sterling (£) |
1.617 |
1.530 |
1.543 |
0.8% |
-4.6% |
|
|
|
|
|
|
|
| Currency per U.S. $ |
|
|
|
|
|
|
| China |
yuan |
6.827 |
6.775 |
6.780 |
-0.1% |
0.7% |
| Hong Kong |
HK$* |
7.753 |
7.772 |
7.765 |
0.1% |
-0.2% |
| India |
rupee |
46.525 |
46.772 |
46.945 |
-0.4% |
-0.9% |
| Japan |
yen |
93.125 |
86.689 |
87.342 |
-0.7% |
6.6% |
| Malaysia |
ringgit |
3.427 |
3.208 |
3.200 |
0.2% |
7.1% |
| Singapore |
Singapore $ |
1.405 |
1.378 |
1.370 |
0.6% |
2.6% |
| South Korea |
won |
1164.000 |
1203.388 |
1199.150 |
0.4% |
-2.9% |
| Taiwan |
Taiwan $ |
31.985 |
32.109 |
32.108 |
0.0% |
-0.4% |
| Thailand |
baht |
33.400 |
32.250 |
32.230 |
0.1% |
3.6% |
| Switzerland |
Swiss franc |
1.035 |
1.051 |
1.054 |
-0.2% |
-1.8% |
| *Pegged to U.S. dollar |
|
|
|
|
|
|
| Source: Bloomberg |
|
|
|
|
|
|
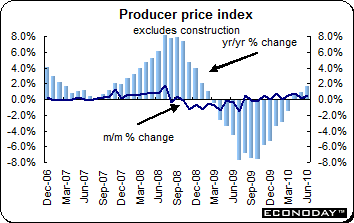 June producer prices jumped 0.6 percent on the month, and were up 1.7 percent on the year. Energy costs surged 1.4 percent on the month. Excluding this sector the PPI was up a much more modest 0.3 percent from mid-quarter and was up 2.1 percent on the year. Among the other main sectors, prices were up most steeply for consumer nondurables which saw a 0.7 percent monthly advance. However, with durables up just 0.1 percent, overall consumer goods prices increased 0.5 percent. Basic goods were up 0.3 percent while capital goods edged up a mere 0.1 percent higher. June producer prices jumped 0.6 percent on the month, and were up 1.7 percent on the year. Energy costs surged 1.4 percent on the month. Excluding this sector the PPI was up a much more modest 0.3 percent from mid-quarter and was up 2.1 percent on the year. Among the other main sectors, prices were up most steeply for consumer nondurables which saw a 0.7 percent monthly advance. However, with durables up just 0.1 percent, overall consumer goods prices increased 0.5 percent. Basic goods were up 0.3 percent while capital goods edged up a mere 0.1 percent higher.
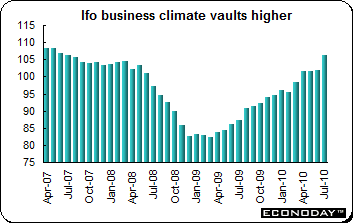 July Ifo business sentiment climbed more than 4 points to 106.2. This is its best reading since the start of the economic recovery and reflects healthy gains in both the current conditions and expectations indexes. The former rose 5.6 points to 106.8 while the latter was up 3 points on the month at 105.5. All areas saw improvements in morale with retail up 13.8 points to 3.7 and manufacturing up almost 8 points at 18.4. Confidence in services rose 2.5 points to 18.0 and in wholesale jumped 12 points to 15.6. Even the construction sector which has tended to lag other areas of the economy saw a 3.2 point increase to minus 13.9. July Ifo business sentiment climbed more than 4 points to 106.2. This is its best reading since the start of the economic recovery and reflects healthy gains in both the current conditions and expectations indexes. The former rose 5.6 points to 106.8 while the latter was up 3 points on the month at 105.5. All areas saw improvements in morale with retail up 13.8 points to 3.7 and manufacturing up almost 8 points at 18.4. Confidence in services rose 2.5 points to 18.0 and in wholesale jumped 12 points to 15.6. Even the construction sector which has tended to lag other areas of the economy saw a 3.2 point increase to minus 13.9.
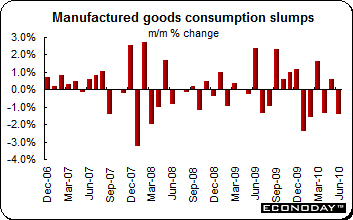 June consumption of manufactured goods dropped 1.4 percent on the month and was down 1.9 percent on the year. June saw broad-based weakness with just the other products category (0.2 percent) managing a rise on the month. Auto demand was flat but there were especially hefty declines in household goods (3.6 percent) and textiles (5.0 percent). June consumption of manufactured goods dropped 1.4 percent on the month and was down 1.9 percent on the year. June saw broad-based weakness with just the other products category (0.2 percent) managing a rise on the month. Auto demand was flat but there were especially hefty declines in household goods (3.6 percent) and textiles (5.0 percent).
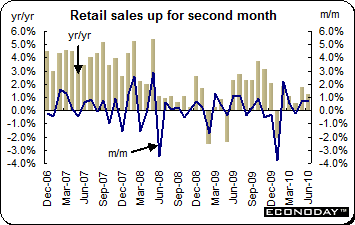 June retail sales were up a robust 0.7 percent on May following a stronger revised 0.8 percent gain in May. Non-fuel purchases advanced 1.0 percent. On the year, overall sales were up 1.3 percent and excluding fuel, 3.1 percent. The latest monthly increase provided for second quarter growth in total volumes of 1.7 percent, the fastest pace since April 2008. Non-food purchases climbed 1.2 percent on the month. Within this category household goods jumped by 1.6 percent and non-specialized stores gained 1.5 percent. Buoyant sales of electrical equipment in anticipation of the football World Cup was very likely an important factor here. The retail sales deflator slowed from a higher revised 2.4 percent annual rate in May to just 1.3 percent. June retail sales were up a robust 0.7 percent on May following a stronger revised 0.8 percent gain in May. Non-fuel purchases advanced 1.0 percent. On the year, overall sales were up 1.3 percent and excluding fuel, 3.1 percent. The latest monthly increase provided for second quarter growth in total volumes of 1.7 percent, the fastest pace since April 2008. Non-food purchases climbed 1.2 percent on the month. Within this category household goods jumped by 1.6 percent and non-specialized stores gained 1.5 percent. Buoyant sales of electrical equipment in anticipation of the football World Cup was very likely an important factor here. The retail sales deflator slowed from a higher revised 2.4 percent annual rate in May to just 1.3 percent.
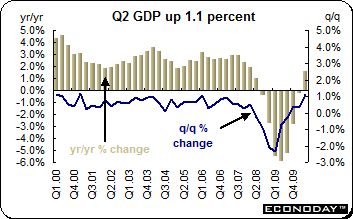 First quarter provisional gross domestic product expanded 1.1 percent on the quarter and was up 1.1 percent when compared with the same quarter a year ago. Although there are no GDP expenditure components available in the first estimate, the output data show solid contributions from both the goods producing and service sectors. Output in the former was up 1.0 percent on the quarter (1.5 percent on the year) within which manufacturing grew an impressive 1.6 percent, its best performance since 1999. Construction also rebounded very strongly with a quarterly surge of some 6.6 percent, the steepest since 1963. Meanwhile activity in services expanded 0.9 percent from the first quarter (1.7 percent on the year) largely thanks to a 1.3 percent pick-up in business services & finance and a 0.9 percent advance in the government sector. By contrast, transport, storage & communications contracted 0.7 percent. First quarter provisional gross domestic product expanded 1.1 percent on the quarter and was up 1.1 percent when compared with the same quarter a year ago. Although there are no GDP expenditure components available in the first estimate, the output data show solid contributions from both the goods producing and service sectors. Output in the former was up 1.0 percent on the quarter (1.5 percent on the year) within which manufacturing grew an impressive 1.6 percent, its best performance since 1999. Construction also rebounded very strongly with a quarterly surge of some 6.6 percent, the steepest since 1963. Meanwhile activity in services expanded 0.9 percent from the first quarter (1.7 percent on the year) largely thanks to a 1.3 percent pick-up in business services & finance and a 0.9 percent advance in the government sector. By contrast, transport, storage & communications contracted 0.7 percent.
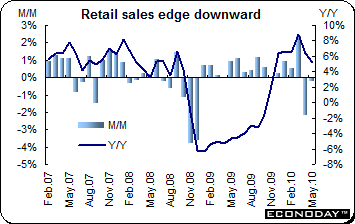 May retail sales sagged by 0.2 percent but were up 5.2 percent when compared with last year. However, the latest slippage in nominal purchases was not mirrored in volumes which were up 0.4 percent on the month. Accordingly, the decline in cash sales was attributable to lower prices, notably for gasoline where demand dropped 2.3 percent from April. Excluding the auto sector as a whole, nominal purchases edged up 0.2 percent on the month. Among the other main categories performances were very mixed. On the bright side there were healthy monthly increases in clothing & accessories (2.6 percent), food & beverages (0.9 percent) and in furniture & home furnishings (0.8 percent). Advances were almost offset by declines in building materials & outdoor equipment (4.1 percent), motor vehicles & parts (0.5 percent) and at miscellaneous store retailers (1.0 percent). May retail sales sagged by 0.2 percent but were up 5.2 percent when compared with last year. However, the latest slippage in nominal purchases was not mirrored in volumes which were up 0.4 percent on the month. Accordingly, the decline in cash sales was attributable to lower prices, notably for gasoline where demand dropped 2.3 percent from April. Excluding the auto sector as a whole, nominal purchases edged up 0.2 percent on the month. Among the other main categories performances were very mixed. On the bright side there were healthy monthly increases in clothing & accessories (2.6 percent), food & beverages (0.9 percent) and in furniture & home furnishings (0.8 percent). Advances were almost offset by declines in building materials & outdoor equipment (4.1 percent), motor vehicles & parts (0.5 percent) and at miscellaneous store retailers (1.0 percent).
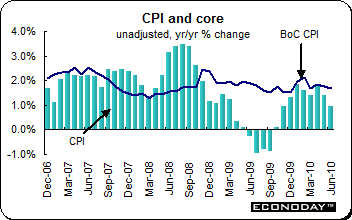 June consumer price index edged down 0.1 percent and was up 1.0 percent on the year. CPI excluding food & energy also edged down 0.1 percent on the month and was up 0.9 percent while the Bank of Canada’s core rate which excludes eight volatile items was down 0.1 percent on the month but up 1.7 percent on the year. Seasonally adjusted the total CPI declined 0.2 percent from May and reflected a particularly large 0.6 percent drop in the cost of clothing & footwear. Other more modest declines were recorded in health & personal care (0.3 percent), recreation, education & reading (0.3 percent) and food (0.1 percent). Meantime, the steepest rise in prices was in transportation (0.6 percent) followed by shelter (0.5 percent), alcohol (0.2 percent) and household operations (0.2 percent). June consumer price index edged down 0.1 percent and was up 1.0 percent on the year. CPI excluding food & energy also edged down 0.1 percent on the month and was up 0.9 percent while the Bank of Canada’s core rate which excludes eight volatile items was down 0.1 percent on the month but up 1.7 percent on the year. Seasonally adjusted the total CPI declined 0.2 percent from May and reflected a particularly large 0.6 percent drop in the cost of clothing & footwear. Other more modest declines were recorded in health & personal care (0.3 percent), recreation, education & reading (0.3 percent) and food (0.1 percent). Meantime, the steepest rise in prices was in transportation (0.6 percent) followed by shelter (0.5 percent), alcohol (0.2 percent) and household operations (0.2 percent).
What economic data that were released in Europe were for the most part positive. U.S. housing data continue to disappoint as market participants ignore the residual effects of now ended stimulus. Buyers moved sales up to take advantage of the incentive and thus ‘borrowed’ sales from future months. The European stress tests were finally released Friday afternoon. The markets appear mildly disappointed, although expectations were not that high to begin with. There always has been a concern that the test would not be severe enough. For example, the test limited itself to a sovereign price shock on trading books and excluded the impact of a possible sovereign default on banks’ investment portfolios. The results appear to validate investor concerns that the European banking system remains opaque.
| Central Bank activities |
|
| July 28 |
United States |
Federal Reserve Beige Book |
|
|
|
| The following indicators will be released this week... |
| Europe |
|
|
| July 27 |
EMU |
M3 Money Supply (June) |
| July 29 |
EMU |
Business and Consumer Confidence (July) |
|
Germany |
Unemployment (July) |
|
France |
Producer Price Index (June) |
| July 30 |
EMU |
Unemployment (June) |
|
Italy |
Producer Price Index (June) |
|
|
|
| Asia/Pacific |
|
|
| July 26 |
Japan |
Merchandise Trade Balance (June) |
|
Australia |
Producer Price Index (Q2.2010) |
| July 27 |
Australia |
Consumer Price Index (Q2.2010) |
| July 29 |
Japan |
Retail Sales (June) |
| July 30 |
Japan |
Household Spending (June) |
|
|
Unemployment (June) |
|
|
Consumer Price Index (June, July) |
|
|
Industrial Production (June) |
|
|
|
| Americas |
|
|
| July 26 |
Canada |
Industrial and Raw Material Price Indexes (June) |
| July 30 |
Canada |
Monthly Gross Domestic Product (May) |
Anne D Picker is the author of International Economic Indicators and Central Banks.
|
