Equity indexes followed here gained on the week (except the Shanghai Composite). The week began with a rediscovery of animal spirits — but they waned as the week wore on. Mixed to weak economic data especially from the U.S. were offset by some progress in the European debt crisis which has mesmerized investors. Worries were eased after the EU promised to release details of bank stress tests by the end of July. And recent bond auctions have had relative success as well. The euro, which has taken the brunt of global investor risk appetite aversity, climbed — and this in turn helped equities to rise. Analysts said that it was difficult to pinpoint a specific catalyst — but it appeared that broad sentiment is decoupling from the specific concerns over eurozone government debt.
After May's month of panic about the impact of Europe’s troubles on global growth, the recovery in risk appetite is fragile. This is evident in waning enthusiasm for equities as the week wore on. But Greece’s downgrade to emerging market status did not derail the upward trend. Credit markets have stabilized, suggesting funding is not getting worse for banks — at least outside Greece and Spain. There is more confidence that China will have a soft landing.
|
|
2009 |
2010 |
% Change |
|
Index |
Dec 31 |
June 11 |
June 18 |
Week |
2010 |
| Asia/Pacific |
|
|
|
|
|
|
| Australia |
All Ordinaries |
4882.7 |
4516.5 |
4574.1 |
1.3% |
-6.3% |
| Japan |
Nikkei 225 |
10546.4 |
9705.3 |
9995.0 |
3.0% |
-5.2% |
|
Topix |
907.6 |
866.4 |
884.6 |
2.1% |
-2.5% |
| Hong Kong |
Hang Seng |
21872.5 |
19872.4 |
20286.7 |
2.1% |
-7.3% |
| S. Korea |
Kospi |
1682.8 |
1675.3 |
1712.0 |
2.2% |
1.7% |
| Singapore |
STI |
2897.6 |
2796.3 |
2833.4 |
1.3% |
-2.2% |
| China |
Shanghai Composite |
3277.1 |
2569.9 |
2513.2 |
-2.2% |
-23.3% |
|
|
|
|
|
|
|
| India |
Sensex 30 |
17464.8 |
17042.3 |
17570.8 |
3.1% |
0.6% |
| Indonesia |
Jakarta Composite |
2534.4 |
2801.9 |
2929.6 |
4.6% |
15.6% |
| Malaysia |
KLCI |
1272.8 |
1294.7 |
1317.7 |
1.8% |
3.5% |
| Philippines |
PSEi |
3052.7 |
3265.4 |
3335.5 |
2.1% |
9.3% |
| Taiwan |
Taiex |
8188.1 |
7299.5 |
7493.1 |
2.7% |
-8.5% |
| Thailand |
SET |
734.5 |
769.6 |
791.9 |
2.9% |
7.8% |
|
|
|
|
|
|
|
| Europe |
|
|
|
|
|
|
| UK |
FTSE 100 |
5412.9 |
5163.7 |
5250.8 |
1.7% |
-3.0% |
| France |
CAC |
3936.3 |
3555.5 |
3687.2 |
3.7% |
-6.3% |
| Germany |
XETRA DAX |
5957.4 |
6047.8 |
6217.0 |
2.8% |
4.4% |
|
|
|
|
|
|
|
| North America |
|
|
|
|
|
|
| United States |
Dow |
10428.1 |
10211.1 |
10450.6 |
2.3% |
0.2% |
|
NASDAQ |
2269.2 |
2243.6 |
2309.8 |
3.0% |
1.8% |
|
S&P 500 |
1115.1 |
1091.6 |
1117.5 |
2.4% |
0.2% |
| Canada |
S&P/TSX Comp. |
11746.1 |
11666.9 |
11927.6 |
2.2% |
1.5% |
| Mexico |
Bolsa |
32120.5 |
32124.3 |
32814.6 |
2.1% |
2.2% |
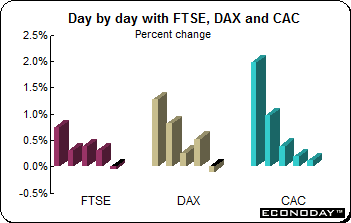 The FTSE, DAX and CAC were up for the second week gaining 1.7 percent, 2.8 percent and 3.7 percent respectively. The enthusiasm early in the week ebbed away as the week progressed. And on Friday, trading was lackluster as it wound down for the week. The day was devoid of important economic data and attention was easily distracted by ongoing World Cup matches. Tensions eased as investors decided that the publication of eurozone bank “stress tests” could remove some of the anxiety regarding the bloc’s financial system. European Union leaders’ promise to reveal test details by the end of July and the relative success of recent eurozone bond auctions has helped push the euro to a three week high against the U.S. dollar and took equities higher as well. The FTSE, DAX and CAC were up for the second week gaining 1.7 percent, 2.8 percent and 3.7 percent respectively. The enthusiasm early in the week ebbed away as the week progressed. And on Friday, trading was lackluster as it wound down for the week. The day was devoid of important economic data and attention was easily distracted by ongoing World Cup matches. Tensions eased as investors decided that the publication of eurozone bank “stress tests” could remove some of the anxiety regarding the bloc’s financial system. European Union leaders’ promise to reveal test details by the end of July and the relative success of recent eurozone bond auctions has helped push the euro to a three week high against the U.S. dollar and took equities higher as well.
Economic data were mixed with key sentiment indexes feeling the brunt of the ongoing worries of the sovereign debt crisis. Fears over Spanish sovereign debt undermined sentiment in the region. The premium demanded by investors to hold Spanish rather than German government debt reached a record. Analysts say that although the country is far from insolvency, debt roll-over risk remains an issue.
The FTSE was up for seven consecutive sessions but slipped just prior to the close on Friday. BP was again the main focus point and, along with the banking sector, was largely responsible for propping up the FTSE. BP agreed to set up a $20 billion clean-up fund to deal with its disastrous leak in the Mexican Gulf, and also said it would be suspending its dividend. Although the news was not good for funds holding BP stock, the shares were sought out by new investors who figured the bad news was now fairly well priced in.
On Thursday, banks were mostly higher after Chancellor George Osborne announced that the financial industry’s regulatory body is to be merged with the Bank of England. Mr Osborne said the Financial Services Authority would be scrapped and that the Bank would be given wider powers. The chancellor also announced the creation of a Financial Policy Committee, which, among other duties, will investigate whether the investment banking and retail banking businesses of financial institutions should be split.
Swiss National Bank leaves policy interest rate on hold
 As widely anticipated the Swiss National Bank decided to leave its target corridor for 3 month CHF LIBOR unchanged at zero to 0.75 percent at Thursday’s quarterly Monetary Policy Assessment. The Bank also indicated that it would continue to aim specifically at the 0.25 percent level. As widely anticipated the Swiss National Bank decided to leave its target corridor for 3 month CHF LIBOR unchanged at zero to 0.75 percent at Thursday’s quarterly Monetary Policy Assessment. The Bank also indicated that it would continue to aim specifically at the 0.25 percent level.
The official forecast for 2010 real GDP growth has been increased from 1.5 percent last time to 2.0 percent, reflecting the surprisingly quick turnaround in the national economy seen since the middle of 2009. And the expected inflation profile has also been raised, but only marginally. The annual change in the CPI is now projected to average 0.9 percent this year and 1.0 percent in 2011. Inflation in 2012 is unrevised at 2.2 percent. With an inflation target ceiling of 2 percent, the latest projections suggest little pressure on the SNB to increase interest rates any time soon.
Importantly, the SNB declined to repeat its previous commitment to prevent excessive CHF appreciation against the euro. Having been actively selling its currency against the euro for much of the year, the monetary authorities now seem prepared to accommodate renewed appreciation irrespective of the implications for lost competitiveness. The shift would appear to reflect both the recovery in domestic demand and the fact that losses in competitiveness are to a degree being offset by a more general pick-up in global growth.
Still, the latest economic scenario put forward by the monetary authorities is surrounded by uncertainties and the SNB is at pains to point out that downside risks have increased since March, not least due to the fresh tensions in financial markets created by the eurozone debt crisis and their potential implications for the Swiss franc. Thus, while the SNB has signaled that it will not stand in the way of modest further currency gains, should appreciation become a deflationary threat, intervention would be firmly back on the table.
 Equity indexes were up last week with the exception of the Shanghai Composite which declined both Thursday and Friday — the only two days that the market was open. For the past seven weeks, the index has alternated between negative and positive results. With almost six months of 2010 gone, the index is down 23.3 percent. Equity indexes were up last week with the exception of the Shanghai Composite which declined both Thursday and Friday — the only two days that the market was open. For the past seven weeks, the index has alternated between negative and positive results. With almost six months of 2010 gone, the index is down 23.3 percent.
After three positive days, trading was mixed among major markets on Thursday and Friday. On Friday, while the markets in China, India, Japan, Singapore and Taiwan ended in negative territory on profit taking, the markets in Australia, Hong Kong, Indonesia and South Korea ended in modestly positive territory. Most traders preferred to stay away from the markets in a light trading day adopting a cautious approach ahead of major economic events, including the FOMC meeting next week.
Minutes of the Bank of Japan’s monetary policy board meeting of May 20th and May 21st revealed that members reiterated that the bank will continue extremely easy monetary policy for the time being. The MPB voted unanimously to hold its uncollateralized overnight call rate at the record low of 0.10 percent where it has remained since December 2008. The bank also announced that it will offer one year loans to commercial banks to encourage lending and pull the country out of deflation. The board members emphasized that the new lending policy is temporary and it must not affect the bank's interest rate policy. The true indicator of economic recovery will be a self-sustaining rebound in domestic demand.
The Reserve Bank of Australia released the minutes of its June 1st meeting. They revealed that officials felt the nation's economy was growing and the employment picture was solid. The board decided to leave its official cash rate unchanged at 4.50 percent. "Most indicators suggested that the economy was continuing to expand and employment growth had been solid," the minutes said. Policy board members noted that the economic picture could still be subject to a changing economic picture overseas. While the international environment facing the Australian economy had become more uncertain, the outlook remained positive in the medium term. The minutes also said, “While recent data for prices and wages suggested that the disinflationary forces in the economy were not quite as strong as previously expected, global events could also have implications for the inflation outlook in the medium term.”
Bank of Japan
 As expected, the Bank of Japan kept their key interest rate at 0.1 percent where it has been since December 2008. The policy board also announced the terms under which the central bank will fund up to ¥3 trillion to commercial banks to lend to growth sectors. Eligible banks will be able to roll over 1 year loans three times. Each bank can borrow ¥150 billion under the new program. Banks must apply for new loans by March 2012. The BoJ will be starting the new lending facility by the end of August. The Bank said that the economy is showing moderate signs of recovery. As expected, the Bank of Japan kept their key interest rate at 0.1 percent where it has been since December 2008. The policy board also announced the terms under which the central bank will fund up to ¥3 trillion to commercial banks to lend to growth sectors. Eligible banks will be able to roll over 1 year loans three times. Each bank can borrow ¥150 billion under the new program. Banks must apply for new loans by March 2012. The BoJ will be starting the new lending facility by the end of August. The Bank said that the economy is showing moderate signs of recovery.
Finance Minister Yoshihiko Noda said he would not force an inflation target on the Bank of Japan, marking a contrast to his predecessor and now prime minister, Naoto Kan, who has called such a policy ‘attractive’. Mr Noda told reporters that he shared Mr Kan’s image of stable price levels of a little more than 1 percent but said it was his personal gauge and it would not be imposed on the Bank of Japan. The central bank is opposed to an inflation target, arguing that its existing ‘understanding’ that inflation should be zero to 2 percent over the medium to long term means it can respond better to risks such as financial bubbles.
 The euro was up last week, buoyed by easing concerns over the eurozone financial system and a rebound in investor risk appetite. Worries over Spain’s finances were heightened early in the week on reports, which were subsequently denied by the European Commission, that the country was to ask the International Monetary Fund, the EU and the U.S. Treasury for financial assistance. But concerns over Spain’s ability to service its debt eased after the country raised €3.48 billion in the bond market Thursday. A decision by eurozone officials to reveal the results of stress tests on European banks also helped soothe worries over the health of the region’s financial system. This, in turn, helped support a rally in risk appetite that drove a rebound in global equity markets over the week. The firmer tone of the single currency also belied disappointing economic news from Germany. Investor confidence there sank to its lowest level for more than a year, according the ZEW, prompting analysts to suggest that concerns over peripheral debt are damaging sentiment towards core eurozone economies. The euro was up last week, buoyed by easing concerns over the eurozone financial system and a rebound in investor risk appetite. Worries over Spain’s finances were heightened early in the week on reports, which were subsequently denied by the European Commission, that the country was to ask the International Monetary Fund, the EU and the U.S. Treasury for financial assistance. But concerns over Spain’s ability to service its debt eased after the country raised €3.48 billion in the bond market Thursday. A decision by eurozone officials to reveal the results of stress tests on European banks also helped soothe worries over the health of the region’s financial system. This, in turn, helped support a rally in risk appetite that drove a rebound in global equity markets over the week. The firmer tone of the single currency also belied disappointing economic news from Germany. Investor confidence there sank to its lowest level for more than a year, according the ZEW, prompting analysts to suggest that concerns over peripheral debt are damaging sentiment towards core eurozone economies.
The Swiss franc climbed to a record high against the euro after the Swiss National Bank on Thursday dropped its pledge to fight excessive appreciation of its currency and moved towards an exit from its ultra-loose monetary policy stance.
Selected currencies — weekly results
|
|
2009 |
2010 |
% Change |
|
|
Dec 31 |
June 11 |
June 18 |
Week |
2010 |
| U.S. $ per currency |
|
|
|
|
|
|
| Australia |
A$ |
0.898 |
0.850 |
0.870 |
2.3% |
-3.1% |
| New Zealand |
NZ$ |
0.727 |
0.691 |
0.707 |
2.3% |
-2.8% |
| Canada |
C$ |
0.955 |
0.967 |
0.979 |
1.3% |
2.5% |
| Eurozone |
euro (€) |
1.433 |
1.210 |
1.237 |
2.3% |
-13.7% |
| UK |
pound sterling (£) |
1.617 |
1.453 |
1.482 |
2.0% |
-8.3% |
|
|
|
|
|
|
|
| Currency per U.S. $ |
|
|
|
|
|
|
| China |
yuan |
6.827 |
6.833 |
6.826 |
0.1% |
0.0% |
| Hong Kong |
HK$* |
7.753 |
7.790 |
7.782 |
0.1% |
-0.4% |
| India |
rupee |
46.525 |
46.845 |
46.174 |
1.5% |
0.8% |
| Japan |
yen |
93.125 |
91.678 |
90.742 |
1.0% |
2.6% |
| Malaysia |
ringgit |
3.427 |
3.285 |
3.251 |
1.0% |
5.4% |
| Singapore |
Singapore $ |
1.405 |
1.402 |
1.387 |
1.1% |
1.3% |
| South Korea |
won |
1164.000 |
1246.100 |
1202.650 |
3.6% |
-3.2% |
| Taiwan |
Taiwan $ |
31.985 |
32.370 |
32.149 |
0.7% |
-0.5% |
| Thailand |
baht |
33.400 |
32.450 |
32.400 |
0.2% |
3.1% |
| Switzerland |
Swiss franc |
1.035 |
1.150 |
1.109 |
3.7% |
-6.7% |
| *Pegged to U.S. dollar |
|
|
|
|
|
|
| Source: Bloomberg |
|
|
|
|
|
|
 April seasonally adjusted merchandise trade surplus widened out to €1.4 billion from a revised flat reading in March. Unadjusted, the trade surplus weighed in at €1.8 billion or €0.8 billion down on its year ago level. The composition of the seasonally adjusted improvement will also disappoint being a reflection of weakness in both sides of the balance sheet. Nominal exports dropped 2.4 percent on the month, only to be outpaced by a 3.5 percent decline in imports. Still, annual growth in both remains firmly positive with exports up 18.0 percent and imports up 19.0 percent. A disproportionate share of the April monthly gain could be attributed to Germany which saw its surplus expand from €6.5 billion to €7.1 billion. France also contributed with a €0.5 billion increase in its surplus albeit to a lowly €1.0 billion. Both Italy and Spain remained solidly in the red for the third month in a row. April seasonally adjusted merchandise trade surplus widened out to €1.4 billion from a revised flat reading in March. Unadjusted, the trade surplus weighed in at €1.8 billion or €0.8 billion down on its year ago level. The composition of the seasonally adjusted improvement will also disappoint being a reflection of weakness in both sides of the balance sheet. Nominal exports dropped 2.4 percent on the month, only to be outpaced by a 3.5 percent decline in imports. Still, annual growth in both remains firmly positive with exports up 18.0 percent and imports up 19.0 percent. A disproportionate share of the April monthly gain could be attributed to Germany which saw its surplus expand from €6.5 billion to €7.1 billion. France also contributed with a €0.5 billion increase in its surplus albeit to a lowly €1.0 billion. Both Italy and Spain remained solidly in the red for the third month in a row.
 April industrial production was up 0.8 percent and 9.5 percent on the year. The April advance followed an upwardly revised 1.5 percent increase in March. April production largely reflected a 2.2 percent monthly surge in the intermediates sector. Capital goods (1.1 percent) also saw a solid gain but there were declines in both durable (0.1 percent) and nondurable (1.2 percent) consumer goods. Activity in the energy sector contracted 0.9 percent. Regionally the performances were very mixed. While Germany (0.8 percent), Italy (1.0 percent), Malta (1.4 percent) and Finland (1.3 percent) all recorded further monthly increases, all other reporting states posted declines. There were particularly large drops in Greece (3.4 percent), Ireland (10.9 percent) and Portugal (4.4 percent). April industrial production was up 0.8 percent and 9.5 percent on the year. The April advance followed an upwardly revised 1.5 percent increase in March. April production largely reflected a 2.2 percent monthly surge in the intermediates sector. Capital goods (1.1 percent) also saw a solid gain but there were declines in both durable (0.1 percent) and nondurable (1.2 percent) consumer goods. Activity in the energy sector contracted 0.9 percent. Regionally the performances were very mixed. While Germany (0.8 percent), Italy (1.0 percent), Malta (1.4 percent) and Finland (1.3 percent) all recorded further monthly increases, all other reporting states posted declines. There were particularly large drops in Greece (3.4 percent), Ireland (10.9 percent) and Portugal (4.4 percent).
 May harmonized index of consumer prices edged up 0.1 percent and was up 1.6 percent when compared with last year and at its fastest pace since December 2008. However, the core HICP excluding food, drink, tobacco & petroleum was up 0.8 percent on the year, unchanged from its April level. Omitting just unprocessed food and petroleum, prices were up 0.9 percent and without seasonal food and petroleum prices gained 0.8 percent on the year. Housing prices were up 2.0 percent while health prices were up 0.8 percent on the year. Transport prices were up 5.5 percent but communications prices dropped 1.1 percent on the year. Energy prices were up 9.2 percent on the year. May harmonized index of consumer prices edged up 0.1 percent and was up 1.6 percent when compared with last year and at its fastest pace since December 2008. However, the core HICP excluding food, drink, tobacco & petroleum was up 0.8 percent on the year, unchanged from its April level. Omitting just unprocessed food and petroleum, prices were up 0.9 percent and without seasonal food and petroleum prices gained 0.8 percent on the year. Housing prices were up 2.0 percent while health prices were up 0.8 percent on the year. Transport prices were up 5.5 percent but communications prices dropped 1.1 percent on the year. Energy prices were up 9.2 percent on the year.
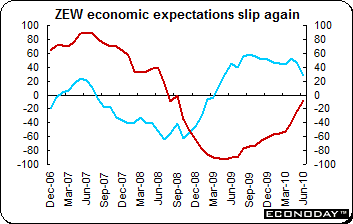 June ZEW survey was mixed — while the assessment of current conditions increased a solid 13.7 points to minus 7.9, its 13th consecutive monthly increase, expectations slumped a hefty 17.1 points to 28.7. This was the steepest monthly drop since October 2008 and the eighth monthly decline in the last nine months. Expectations are now at the weakest level since April 2009 and reflect the impact of the eurozone debt crisis and concerns about the potential effects of fiscal tightening. ZEW suggested that the planned fiscal cuts should be defined now but their implementation delayed until 2011. June ZEW survey was mixed — while the assessment of current conditions increased a solid 13.7 points to minus 7.9, its 13th consecutive monthly increase, expectations slumped a hefty 17.1 points to 28.7. This was the steepest monthly drop since October 2008 and the eighth monthly decline in the last nine months. Expectations are now at the weakest level since April 2009 and reflect the impact of the eurozone debt crisis and concerns about the potential effects of fiscal tightening. ZEW suggested that the planned fiscal cuts should be defined now but their implementation delayed until 2011.
 May producer prices were up 0.3 percent and 0.9 percent when compared with last year. Excluding energy, the PPI was up 0.6 percent and 1.8 percent on the year. Energy prices declined 0.3 percent on the month. The headline advance reflected a 1.1 percent gain in the price of basics, compounded by a 0.5 percent increase in the cost of consumer goods. By contrast capital goods prices were unchanged on the month. On the year, basics are now up 4.7 percent, well ahead of consumer goods (0.1 percent) and capital goods (minus 0.3 percent). May producer prices were up 0.3 percent and 0.9 percent when compared with last year. Excluding energy, the PPI was up 0.6 percent and 1.8 percent on the year. Energy prices declined 0.3 percent on the month. The headline advance reflected a 1.1 percent gain in the price of basics, compounded by a 0.5 percent increase in the cost of consumer goods. By contrast capital goods prices were unchanged on the month. On the year, basics are now up 4.7 percent, well ahead of consumer goods (0.1 percent) and capital goods (minus 0.3 percent).
 April seasonally adjusted merchandise trade deficit was €1.26 billion, down from March’s €1.69 billion drop and the smallest deficit since January. The modest improvement reflected a 1.1 percent monthly increase in exports combined with a 0.1 percent decline in imports. Unadjusted, exports were up 15.2 percent on the year, somewhat ahead of the 12.5 percent annual pace posted by imports. Within their overall 12-month advance, energy exports surged 79.3 percent thanks to higher prices, while intermediates were up 19.5 percent. Overseas purchases of consumer goods were up 10.9 percent on the back of an 11.4 percent gain in nondurables while exports of capital goods advanced 8.8 percent. Annual import growth was also supported by the energy sector which saw a 19.0 percent increase although this was only slightly faster than an 18.6 percent rise in intermediates. Capital goods imports rose 9.2 percent on the year but, reflecting the sluggishness of household spending, consumer goods were up a relatively gentle 6.4 percent. April seasonally adjusted merchandise trade deficit was €1.26 billion, down from March’s €1.69 billion drop and the smallest deficit since January. The modest improvement reflected a 1.1 percent monthly increase in exports combined with a 0.1 percent decline in imports. Unadjusted, exports were up 15.2 percent on the year, somewhat ahead of the 12.5 percent annual pace posted by imports. Within their overall 12-month advance, energy exports surged 79.3 percent thanks to higher prices, while intermediates were up 19.5 percent. Overseas purchases of consumer goods were up 10.9 percent on the back of an 11.4 percent gain in nondurables while exports of capital goods advanced 8.8 percent. Annual import growth was also supported by the energy sector which saw a 19.0 percent increase although this was only slightly faster than an 18.6 percent rise in intermediates. Capital goods imports rose 9.2 percent on the year but, reflecting the sluggishness of household spending, consumer goods were up a relatively gentle 6.4 percent.
 May consumer price index was up 0.2 percent and 3.4 percent when compared with last year. Core CPI was up 0.3 percent to stand 2.9 percent higher on the year. Prices were boosted on the month by a seasonal 0.3 percent increase in the cost of clothing & footwear. This combined with a 1.2 percent gain in charges for furniture & household equipment (but after a 1.6 percent slide in April) and a 0.7 percent advance in the price of transport (which itself was boosted by higher petrol prices). Prices edged down 0.1 percent for food & drink and were down 0.2 percent for alcohol & tobacco. Communication and recreation & culture prices edged down 0.2 percent and 0.1 percent respectively. The main contributor to the easing in annual inflation was a slower increase in food & drink prices. The main upward push came from housing & household services. May consumer price index was up 0.2 percent and 3.4 percent when compared with last year. Core CPI was up 0.3 percent to stand 2.9 percent higher on the year. Prices were boosted on the month by a seasonal 0.3 percent increase in the cost of clothing & footwear. This combined with a 1.2 percent gain in charges for furniture & household equipment (but after a 1.6 percent slide in April) and a 0.7 percent advance in the price of transport (which itself was boosted by higher petrol prices). Prices edged down 0.1 percent for food & drink and were down 0.2 percent for alcohol & tobacco. Communication and recreation & culture prices edged down 0.2 percent and 0.1 percent respectively. The main contributor to the easing in annual inflation was a slower increase in food & drink prices. The main upward push came from housing & household services.
 May claimant count joblessness sank a sizeable 30,900 which, after revisions, constituted its third consecutive monthly drop in excess of 30,000 and its fourth decline in a row. The unemployment rate on this measure now stands at 4.6 percent, down from April’s 4.7 percent and some 0.4 percentage points below the recent 5.0 percent peak in January. However, the ILO jobless measure for the three months to April climbed another 23,000. The ILO jobless rate was 7.9 percent, down from 8 percent in the previous three months. Headline average earnings growth in the three months to April was 4.2 percent. May claimant count joblessness sank a sizeable 30,900 which, after revisions, constituted its third consecutive monthly drop in excess of 30,000 and its fourth decline in a row. The unemployment rate on this measure now stands at 4.6 percent, down from April’s 4.7 percent and some 0.4 percentage points below the recent 5.0 percent peak in January. However, the ILO jobless measure for the three months to April climbed another 23,000. The ILO jobless rate was 7.9 percent, down from 8 percent in the previous three months. Headline average earnings growth in the three months to April was 4.2 percent.
 May retail sales were up 0.6 percent and 2.2 percent when compared with last year. Excluding auto fuel, sales advanced 0.5 percent and climbed 3.4 percent on the year. Food store sales jumped 1.0 percent and accounted for all of the increase in the total. Overall non-food sales were unchanged on the month. However, within the sector, solid monthly gains were posted in household goods (1.7 percent), non-store retailing (1.8 percent), predominantly fuel (2.1 percent) and at non-specialized stores (1.2 percent). The increases were offset by declines in clothing & footwear (1.3 percent) and in the other stores category (0.8 percent). May retail sales were up 0.6 percent and 2.2 percent when compared with last year. Excluding auto fuel, sales advanced 0.5 percent and climbed 3.4 percent on the year. Food store sales jumped 1.0 percent and accounted for all of the increase in the total. Overall non-food sales were unchanged on the month. However, within the sector, solid monthly gains were posted in household goods (1.7 percent), non-store retailing (1.8 percent), predominantly fuel (2.1 percent) and at non-specialized stores (1.2 percent). The increases were offset by declines in clothing & footwear (1.3 percent) and in the other stores category (0.8 percent).
 April tertiary index rebounded 2.1 percent after sinking 2.75 percent in March. On the year, the index was up 1.3 percent. The monthly increase was the first in three months. The annual increase was the third in a row. Information & communications were up 9.4 percent while wholesale & retail trade gained 3.6 percent. Real estate & goods rental & leasing was up 0.4 percent. On the down side were living related & personal services & amusement services (down 1.7 percent), scientific research, professional & technical services (down 1.5 percent) and transport & postal activities (down 0.7 percent). Other decliners were miscellaneous services, finance & insurance, learning support, medical, health care & welfare and compound services. April tertiary index rebounded 2.1 percent after sinking 2.75 percent in March. On the year, the index was up 1.3 percent. The monthly increase was the first in three months. The annual increase was the third in a row. Information & communications were up 9.4 percent while wholesale & retail trade gained 3.6 percent. Real estate & goods rental & leasing was up 0.4 percent. On the down side were living related & personal services & amusement services (down 1.7 percent), scientific research, professional & technical services (down 1.5 percent) and transport & postal activities (down 0.7 percent). Other decliners were miscellaneous services, finance & insurance, learning support, medical, health care & welfare and compound services.
 April manufacturing sales advanced 0.2 percent and were up 10.5 percent on the year. Monthly sales increases by primary metal and petroleum & coal product manufacturers were largely offset by a decline in the food industry. Manufacturing sales have risen in eight of the past 10 months and have been trending upward since the low reached in May 2009. Constant dollar manufacturing sales edged down 0.1 percent in April following seven consecutive months of increases. Sales gains were reported in 11 of 21 industries, representing 67.8 percent of total sales. For the month, higher prices (up 3.3 percent) were largely responsible for boosting primary metals sales 3.6 percent, marking the eighth increase in 10 months. Petroleum & coal product manufacturers posted a sales increase of 2.1 percent, partly attributable to some refineries returning to full production and a 0.7 percent increase in petroleum prices. In the transportation equipment sector, which posted a 0.7 percent increase overall, the aerospace product & parts industry was up 7.1 percent but motor vehicle industry sales declined 1.0 percent. The food product industry dropped 2.1 percent, offsetting some of April's gains. Unfilled orders were down for the second consecutive month, sinking 0.2 percent. Excluding the aerospace product & parts industry, unfilled orders increased 0.9 percent. New orders increased 0.3 percent. April manufacturing sales advanced 0.2 percent and were up 10.5 percent on the year. Monthly sales increases by primary metal and petroleum & coal product manufacturers were largely offset by a decline in the food industry. Manufacturing sales have risen in eight of the past 10 months and have been trending upward since the low reached in May 2009. Constant dollar manufacturing sales edged down 0.1 percent in April following seven consecutive months of increases. Sales gains were reported in 11 of 21 industries, representing 67.8 percent of total sales. For the month, higher prices (up 3.3 percent) were largely responsible for boosting primary metals sales 3.6 percent, marking the eighth increase in 10 months. Petroleum & coal product manufacturers posted a sales increase of 2.1 percent, partly attributable to some refineries returning to full production and a 0.7 percent increase in petroleum prices. In the transportation equipment sector, which posted a 0.7 percent increase overall, the aerospace product & parts industry was up 7.1 percent but motor vehicle industry sales declined 1.0 percent. The food product industry dropped 2.1 percent, offsetting some of April's gains. Unfilled orders were down for the second consecutive month, sinking 0.2 percent. Excluding the aerospace product & parts industry, unfilled orders increased 0.9 percent. New orders increased 0.3 percent.
Economic data were mixed last week with sentiment showing signs of weakening thanks to the ongoing European fiscal problems. U.S. data disappointed — housing starts reflected the end to the government’s housing incentive plan and unsurprisingly dropped like a rock while jobless claims continue to show little positive momentum. Equities were up however, except in Shanghai.
Data outside the U.S. will be light this week. The main focus will be on the FOMC announcement Wednesday afternoon (local time) and several key U.S. economic indicators. And the Group of Eight meeting begins at week’s end in Muskoka, Ontario, Canada.
| Central Bank activities |
|
| June 22,23 |
United States |
FOMC Meeting |
| June 23 |
UK |
Bank of England Meeting Minutes |
|
|
|
| Other events |
|
|
| June 25 to June 27 |
Canada |
Group of Eight Summit |
|
|
|
| The following indicators will be released this week... |
| Europe |
|
|
| June 22 |
Germany |
Ifo Business Survey (June) |
| June 23 |
EMU |
Manufacturing PMI (June flash) |
| June 24 |
France |
Consumption of Manufactured Goods (May) |
| June 25 |
France |
Gross Domestic Product (Q1.10 final) |
|
|
|
| Asia/Pacific |
|
|
| June 24 |
Japan |
Merchandise Trade Balance (May) |
| June 25 |
Japan |
Consumer Price Index (May, June) |
|
|
|
| Americas |
|
|
| June 22 |
Canada |
Consumer Price Index (May) |
|
United States |
Existing Home Sales (May) |
| June 23 |
Canada |
Retail Sales (April) |
|
United States |
New Home Sales (May) |
| June 24 |
United States |
Initial Unemployment Claims (week ending prior Saturday) |
|
|
Durable Goods Orders (May) |
| June 25 |
United States |
Gross Domestic Product (Q1.10 third estimate) |
|
|
Consumer Sentiment (June, final) |
Anne D Picker is the author of International Economic Indicators and Central Banks.
|
