It was a rather tumultuous week to put it mildly! The calm supposedly engendered by the EMU Pact of just a few short weeks ago disappeared and equities plunged while currencies gyrated and some sank. Worries about global growth sent investors to the door. And events during the week did little to calm traders and investors. Most indexes sank below long term marks with 2010 gains wiped out and than some.
It seems only yesterday that those in surplus countries were wondering how much longer the U.S. dollar would serve as the world’s reserve currency. Now it is Europe and the euro that is being questioned in light of the fiscal blight pervading the eurozone. The dollar along with gold is providing a safe haven as they always have. And while doubters have always questioned whether one could run a monetary union without a political union as well, naysayers are having a field day questioning the EMU’s longevity. Rumors last week were rife, pointing to various supposed fractures that would break up the zone.
Fears of a disorderly regulatory crackdown on banks and financial markets triggered a crisis of confidence among investors that sent share prices reeling in a global flight to safety. Global shares tumbled in the wake of Germany’s unilateral action putting in place a partial ban on naked short selling without consulting other EMU members. Naked short selling is the practice of selling securities such as shares and bonds that are not owned or borrowed.
And uncertainty also appeared as the U.S. Senate continued to debate — but ultimately passed a bill that reformulates the legal umbrella for the finance industry. Add into that the beginning of an unlikely political alliance to govern the UK, and you have the makings of a very uncertain political environment. And questions on how the European mess will impact world growth stirred uncertainty — and investors hate uncertainty. Although economic data were for the most part ignored, a spate of slightly weaker than expected results only escalated growth concerns and helped push Treasuries higher and German bond prices to a record. And in Greece there were protests over wage cuts.
On the week, all equity indexes followed here declined. Losses ranged from 0.4 percent for the SET which was closed due to political strife Wednesday through Friday to 6.9 percent for the Taiex.
|
|
2009 |
2010 |
% Change |
|
Index |
Dec 31 |
May 14 |
May 21 |
Week |
2010 |
| Asia |
|
|
|
|
|
|
| Australia |
All Ordinaries |
4882.7 |
4643.0 |
4325.8 |
-6.8% |
-11.4% |
| Japan |
Nikkei 225 |
10546.4 |
10462.5 |
9784.5 |
-6.5% |
-7.2% |
|
Topix |
907.6 |
936.5 |
879.7 |
-6.1% |
-3.1% |
| Hong Kong |
Hang Seng |
21872.5 |
20145.4 |
19545.8 |
-3.0% |
-10.6% |
| S. Korea |
Kospi |
1682.8 |
1695.6 |
1600.2 |
-5.6% |
-4.9% |
| Singapore |
STI |
2897.6 |
2855.2 |
2701.2 |
-5.4% |
-6.8% |
| China |
Shanghai Composite |
3277.1 |
2696.6 |
2583.5 |
-4.2% |
-21.2% |
|
|
|
|
|
|
|
| India |
Sensex 30 |
17464.8 |
16994.6 |
16445.6 |
-3.2% |
-5.8% |
| Indonesia |
Jakarta Composite |
2534.4 |
2858.4 |
2623.2 |
-8.2% |
3.5% |
| Malaysia |
KLCI |
1272.8 |
1339.3 |
1285.7 |
-4.0% |
1.0% |
| Philippines |
PSEi |
3052.7 |
3330.4 |
3179.4 |
-4.5% |
4.1% |
| Taiwan |
Taiex |
8188.1 |
7772.1 |
7237.7 |
-6.9% |
-11.6% |
| Thailand |
SET* |
734.5 |
768.8 |
765.5 |
-0.4% |
4.2% |
|
|
|
|
|
|
|
| Europe |
|
|
|
|
|
|
| UK |
FTSE 100 |
5412.9 |
5262.9 |
5062.9 |
-3.8% |
-6.5% |
| France |
CAC |
3936.3 |
3560.4 |
3430.7 |
-3.6% |
-12.8% |
| Germany |
XETRA DAX |
5957.4 |
6056.7 |
5829.3 |
-3.8% |
-2.2% |
|
|
|
|
|
|
|
| North America |
|
|
|
|
|
|
| United States |
Dow |
10428.1 |
10620.2 |
10193.4 |
-4.0% |
-2.3% |
|
NASDAQ |
2269.2 |
2346.9 |
2229.0 |
-5.0% |
-1.8% |
|
S&P 500 |
1115.1 |
1135.7 |
1087.7 |
-4.2% |
-2.5% |
| Canada |
S&P/TSX Comp. |
11746.1 |
12015.0 |
11521.4 |
-4.1% |
-1.9% |
| Mexico |
Bolsa |
32120.5 |
31812.7 |
30629.2 |
-3.7% |
-4.6% |
| *The SET was closed Wednesday through Friday due to political strife. |
|
|
|
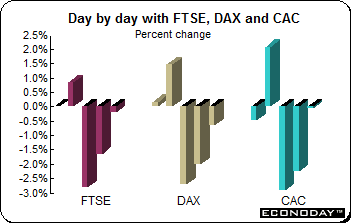 As to be expected, the FTSE, CAC and DAX sank last week. The FTSE dropped below the 5,000 point level in intraday trading Friday for the first time since November, but managed to close above it as stocks began to recover. However, the index was down sharply on the week. Sentiment continued to droop thanks to the ongoing eurozone debt crisis but began to recover somewhat after the German parliament voted to allow the government to push through its contribution to the €750 billion bailout. As to be expected, the FTSE, CAC and DAX sank last week. The FTSE dropped below the 5,000 point level in intraday trading Friday for the first time since November, but managed to close above it as stocks began to recover. However, the index was down sharply on the week. Sentiment continued to droop thanks to the ongoing eurozone debt crisis but began to recover somewhat after the German parliament voted to allow the government to push through its contribution to the €750 billion bailout.
Both the DAX and CAC also improved Friday after being battered by growing concerns about the region's debt crisis. Investors were worried whether the eurozone debt crisis will be successfully resolved especially after they saw policy makers divided on the issue as exemplified by Germany's unilateral decision earlier this week to ban naked short selling. On the week, the FTSE and DAX both sank 3.8 percent while the CAC dropped 3.6 percent. In 2010, they are down 6.5 percent, 2.2 percent and 12.8 percent respectively.
Investors were unnerved by Germany’s decision to ban naked short selling. The move stoked concerns that further regulations would be adopted across Europe, drying up liquidity in equity markets. The German regulator BaFin temporarily banned naked short selling of a number of German financial instruments in a move that was aimed at bolstering confidence in Europe’s financial system. The result was anything but. The move failed to reassure investors and BaFin’s decision was greeted negatively by global financial markets.
Europe’s leaders scrambled to restore unity in the wake of the German move which was introduced with no warning to other European nations. Global stock markets plunged while the euro tumbled to fresh four year lows against the dollar. Chancellor Merkel told parliament that the eurozone crisis was the greatest test for the European Union since its creation. But officials in EU capitals made little effort to disguise their surprise and irritation at the German move. Most saw the step as motivated by domestic political pressures.
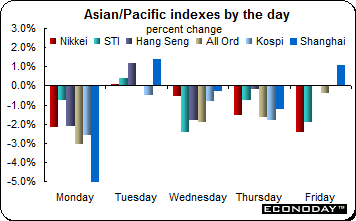 Equities plunged on the week as risk aversion gripped investors. The fiscal difficulties in Europe combined with concerns over China’s monetary tightening sent investors running for the hills. Declines ranged from a modest 0.4 percent in Thailand (however the market there was closed from Wednesday due to political unrest) and dropped 3.2 percent for the Sensex to 6.9 percent for the Taiex. Equities plunged on the week as risk aversion gripped investors. The fiscal difficulties in Europe combined with concerns over China’s monetary tightening sent investors running for the hills. Declines ranged from a modest 0.4 percent in Thailand (however the market there was closed from Wednesday due to political unrest) and dropped 3.2 percent for the Sensex to 6.9 percent for the Taiex.
In Japan, the Nikkei fell below 10,000 for the first time since February 10. When the week was done, the index had lost 6.5 percent while the Topix swooned by 6.1 percent. The former is down 7.2 percent so far in 2010 while the Topix is down a more moderate 3.1 percent. Stocks of companies that export products to Europe were among the hardest hit especially in the precision equipment and electronics sectors.
At midweek, markets across Asia plunged sharply and ended at multi-month lows on Wednesday as traders expressed fears about the impact that Germany's ban on naked short selling will have on global markets. The sharp decline in commodity and oil prices coupled with a weaker euro, which was trading at a four year low, also impacted market sentiment. Concerns about the European currency weighed on the markets thanks to rumors of a possible split in the European Union.
The Reserve Bank of Australia released minutes for the May 4 meeting at which the board raised interest rates to 4.5 percent. The minutes appear to indicate that interest rates will be on hold for the present time. Board members noted that even though the global recovery continued to be uneven, the overall pace of global growth this year is likely to be at least average. And Asia is expanding strongly which is important for Australia. There have been further sharp increases in commodity prices and it is likely that Australia’s terms of trade this year will recover to the high levels reached in 2008. This would provide a large boost to nominal income. The indication that rates could be on hold going forward sent the Australian dollar plunging against its U.S. counterpart and other currencies.
Bank of Japan
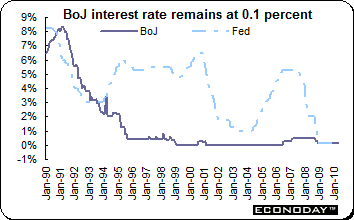 The Bank of Japan, as universally expected, kept its policy interest rate at 0.1 percent. Solid first quarter GDP growth emphasized the BoJ’s positive economic assessment. However, at the same time, the BoJ announced details of a scheme to encourage commercial banks to lend to riskier companies in growth industries. The Bank said it would offer one-year, 0.1 percent loans to eligible banks. It wants to encourage lending to companies in industries such as health and the environment. The policy marks an almost unprecedented move into industrial policy by a central bank. In essence, the BoJ will offer cheap finance to commercial banks that are willing to take on more risk, but it will not take any credit risk itself. That may limit the effectiveness of its move. It should be noted that the Bank will not accept the risky loans as collateral and commercial banks will still have to put up high-quality assets such as government bonds in order to borrow the cheap funds. It has also made clear that the policy is not a quantitative easing measure that will expand its balance sheet. The Bank of Japan, as universally expected, kept its policy interest rate at 0.1 percent. Solid first quarter GDP growth emphasized the BoJ’s positive economic assessment. However, at the same time, the BoJ announced details of a scheme to encourage commercial banks to lend to riskier companies in growth industries. The Bank said it would offer one-year, 0.1 percent loans to eligible banks. It wants to encourage lending to companies in industries such as health and the environment. The policy marks an almost unprecedented move into industrial policy by a central bank. In essence, the BoJ will offer cheap finance to commercial banks that are willing to take on more risk, but it will not take any credit risk itself. That may limit the effectiveness of its move. It should be noted that the Bank will not accept the risky loans as collateral and commercial banks will still have to put up high-quality assets such as government bonds in order to borrow the cheap funds. It has also made clear that the policy is not a quantitative easing measure that will expand its balance sheet.
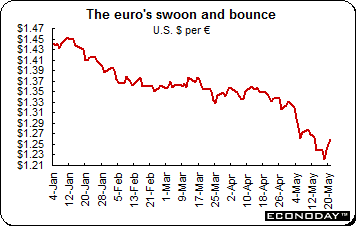 It’s hard to believe a currency that at one point during the week was at a four year low against the dollar would end with a weekly 1.6 percent gain. While the actual scope of Germany's short selling ban is very limited, its impact was far wider than intended. The selloff illustrated the breakdown of market confidence and a fear that Germany’s move might only be the first of many. The whole episode gave investors another reason to be leery. Why should they buy eurozone assets when its biggest governments cannot be trusted not to move the goalposts without notice and without sufficient rationale' The euro rallied at the end of the week as investors unwound carry trades as they fled from risk by selling euro loans. There are many in the eurozone — especially exporters — who are quite pleased to see the euro decline. Simply, a lower euro improves export and profit prospects for eurozone exporters. It’s hard to believe a currency that at one point during the week was at a four year low against the dollar would end with a weekly 1.6 percent gain. While the actual scope of Germany's short selling ban is very limited, its impact was far wider than intended. The selloff illustrated the breakdown of market confidence and a fear that Germany’s move might only be the first of many. The whole episode gave investors another reason to be leery. Why should they buy eurozone assets when its biggest governments cannot be trusted not to move the goalposts without notice and without sufficient rationale' The euro rallied at the end of the week as investors unwound carry trades as they fled from risk by selling euro loans. There are many in the eurozone — especially exporters — who are quite pleased to see the euro decline. Simply, a lower euro improves export and profit prospects for eurozone exporters.
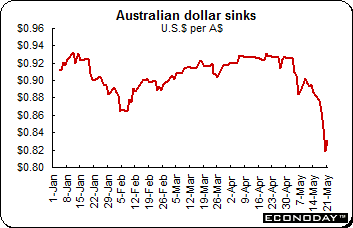 The Australian dollar is now bearing the brunt of a shift in strategy. The Australian dollar is considered a barometer of global risk appetite and growth given the country’s exposure to Chinese demand for resources. Now it seems traders are scrambling to close long Aussie positions and the currency is sinking. Its plunge reflects the quick change in mood as Europe's debt problems and China's monetary tightening plans damp optimism about the health of the world's economy. The recent drop in commodity prices also hurts mineral-rich Australia. The currency plunged over 6.1 percent on the week and is down about 7.4 percent in 2010. The Australian dollar is now bearing the brunt of a shift in strategy. The Australian dollar is considered a barometer of global risk appetite and growth given the country’s exposure to Chinese demand for resources. Now it seems traders are scrambling to close long Aussie positions and the currency is sinking. Its plunge reflects the quick change in mood as Europe's debt problems and China's monetary tightening plans damp optimism about the health of the world's economy. The recent drop in commodity prices also hurts mineral-rich Australia. The currency plunged over 6.1 percent on the week and is down about 7.4 percent in 2010.
Selected currencies — weekly results
|
|
2009 |
2010 |
% Change |
|
|
Dec 31 |
May 14 |
May 21 |
Week |
2010 |
| U.S. $ per currency |
|
|
|
|
|
|
| Australia |
A$ |
0.898 |
0.886 |
0.832 |
-6.1% |
-7.4% |
| New Zealand |
NZ$ |
0.727 |
0.707 |
0.679 |
-4.0% |
-6.6% |
| Canada |
C$ |
0.955 |
0.969 |
0.944 |
-2.6% |
-1.2% |
| Eurozone |
euro (€) |
1.433 |
1.239 |
1.258 |
1.6% |
-12.2% |
| UK |
pound sterling (£) |
1.617 |
1.454 |
1.449 |
-0.4% |
-10.4% |
|
|
|
|
|
|
|
| Currency per U.S. $ |
|
|
|
|
|
|
| China |
yuan |
6.827 |
6.827 |
6.828 |
0.0% |
0.0% |
| Hong Kong |
HK$* |
7.753 |
7.786 |
7.804 |
-0.2% |
-0.6% |
| India |
rupee |
46.525 |
45.205 |
46.924 |
-3.7% |
-0.9% |
| Japan |
yen |
93.125 |
92.340 |
89.985 |
2.6% |
3.5% |
| Malaysia |
ringgit |
3.427 |
3.193 |
3.321 |
-3.9% |
3.2% |
| Singapore |
Singapore $ |
1.405 |
1.387 |
1.407 |
-1.4% |
-0.1% |
| South Korea |
won |
1164.000 |
1130.925 |
1228.500 |
-7.9% |
-5.3% |
| Taiwan |
Taiwan $ |
31.985 |
31.653 |
32.128 |
-1.5% |
-0.4% |
| Thailand |
baht |
33.400 |
32.380 |
32.400 |
-0.1% |
3.1% |
| Switzerland |
Swiss franc |
1.035 |
1.131 |
1.149 |
-1.5% |
-9.9% |
| *Pegged to U.S. dollar |
|
|
|
|
|
|
| Source: Bloomberg |
|
|
|
|
|
|
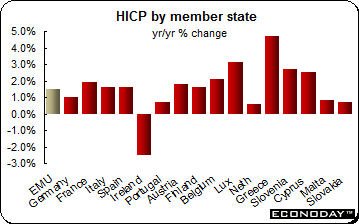 April harmonized index of consumer prices was up 0.5 percent and 1.5 percent when compared with last year. Excluding food, drink, tobacco and petrol, annual inflation dropped 0.2 percentage points to just 0.8 percent. Omitting just unprocessed foods and petrol the rate also dropped 0.2 percentage points to an even lower 0.7 percent. Without seasonal foods and petrol the rate edged 0.1 percentage points lower to 0.7 percent. The main upward pressure on the annual rate came from energy where the 12-month rate jumped nearly 2 percentage points to 9.1 percent. However, other areas to see inflation rise were limited to housing (1.7 percent from 0.5 percent), food (minus 0.2 percent from minus 0.6 percent) and clothing (0.3 percent from minus 0.1 percent). Meantime prices decelerated in a number of sectors, notably recreation (minus 1.0 percent from 0.2 percent), communications (minus 0.6 percent from minus 0.3 percent) and hotels & restaurants (1.0 percent from 1.2 percent). April harmonized index of consumer prices was up 0.5 percent and 1.5 percent when compared with last year. Excluding food, drink, tobacco and petrol, annual inflation dropped 0.2 percentage points to just 0.8 percent. Omitting just unprocessed foods and petrol the rate also dropped 0.2 percentage points to an even lower 0.7 percent. Without seasonal foods and petrol the rate edged 0.1 percentage points lower to 0.7 percent. The main upward pressure on the annual rate came from energy where the 12-month rate jumped nearly 2 percentage points to 9.1 percent. However, other areas to see inflation rise were limited to housing (1.7 percent from 0.5 percent), food (minus 0.2 percent from minus 0.6 percent) and clothing (0.3 percent from minus 0.1 percent). Meantime prices decelerated in a number of sectors, notably recreation (minus 1.0 percent from 0.2 percent), communications (minus 0.6 percent from minus 0.3 percent) and hotels & restaurants (1.0 percent from 1.2 percent).
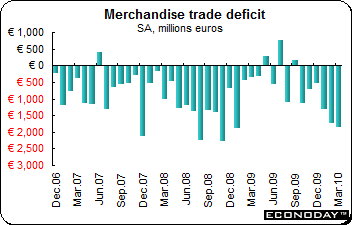
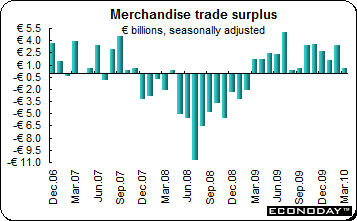 March seasonally adjusted merchandise trade surplus narrowed sharply to €0.6 billion from a slightly larger revised €3.4 billion in February. The deterioration in the bottom line masked sizeable gains in both sides of the balance sheet. Nominal exports jumped 7.5 percent on the month and now stand 22.0 percent higher on the year. However, imports performed even more strongly with a 10.3 percent monthly advance that boosted their annual growth rate to 20.0 percent. The slide in the surplus was in part attributable to a smaller contribution from Germany where the national surplus declined from €8.2 billion to €6.5 billion. However, this still compared very favorably with a much smaller surplus in France (€0.6 billion) and with deficits in both Italy (€1.9 billion) and Spain (€3.7 billion). March seasonally adjusted merchandise trade surplus narrowed sharply to €0.6 billion from a slightly larger revised €3.4 billion in February. The deterioration in the bottom line masked sizeable gains in both sides of the balance sheet. Nominal exports jumped 7.5 percent on the month and now stand 22.0 percent higher on the year. However, imports performed even more strongly with a 10.3 percent monthly advance that boosted their annual growth rate to 20.0 percent. The slide in the surplus was in part attributable to a smaller contribution from Germany where the national surplus declined from €8.2 billion to €6.5 billion. However, this still compared very favorably with a much smaller surplus in France (€0.6 billion) and with deficits in both Italy (€1.9 billion) and Spain (€3.7 billion).
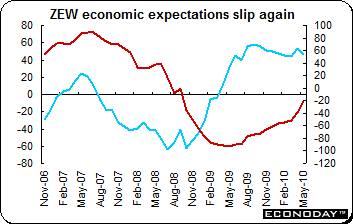 May ZEW current conditions index increased by more than 17 points to a reading of minus 21.6. This was its 12th successive monthly gain. On the downside, expectations declined by more than expected, yielding 7.2 points to 45.8. Expectations have now weakened in seven of the last eight months. ZEW ascribed the worsening in the expectations index to uncertainty over the budget deficit and in particular to worries about the potential cost of the Greek bailout. May ZEW current conditions index increased by more than 17 points to a reading of minus 21.6. This was its 12th successive monthly gain. On the downside, expectations declined by more than expected, yielding 7.2 points to 45.8. Expectations have now weakened in seven of the last eight months. ZEW ascribed the worsening in the expectations index to uncertainty over the budget deficit and in particular to worries about the potential cost of the Greek bailout.
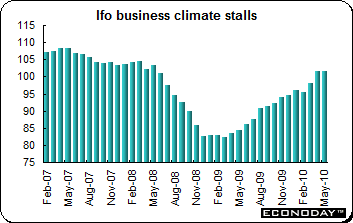 May Ifo business sentiment was essentially unchanged this at 101.5 from 101.6 in April. Broadly stable sentiment in May was a reflection of only small changes in its two component parts. The current conditions index edged up 0.1 point to 99.4 and extended, albeit only just, the unbroken series of monthly gains seen since its recovery began last year. By contrast, expectations declined, but only by 0.3 points and a 103.7 level still constituted its second highest reading since the start of its revival. Amongst the major sectors swings in confidence were a little more marked. Manufacturing saw a 2.6 point gain to 10.1 but retail dropped a sharp 4.4 points to minus 8.1 and wholesale was down 2.5 points to 2.6. Meantime, sentiment in services was steady at 15.0 but construction sector morale lost 5 points to minus 20.4. May Ifo business sentiment was essentially unchanged this at 101.5 from 101.6 in April. Broadly stable sentiment in May was a reflection of only small changes in its two component parts. The current conditions index edged up 0.1 point to 99.4 and extended, albeit only just, the unbroken series of monthly gains seen since its recovery began last year. By contrast, expectations declined, but only by 0.3 points and a 103.7 level still constituted its second highest reading since the start of its revival. Amongst the major sectors swings in confidence were a little more marked. Manufacturing saw a 2.6 point gain to 10.1 but retail dropped a sharp 4.4 points to minus 8.1 and wholesale was down 2.5 points to 2.6. Meantime, sentiment in services was steady at 15.0 but construction sector morale lost 5 points to minus 20.4.
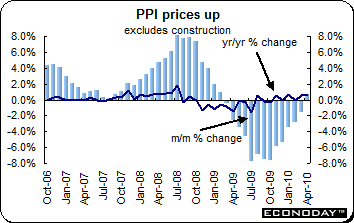 April producer prices were up 0.8 percent on the month and 0.6 percent on the year. Excluding construction, the PPI was up 0.6 percent and 0.7 percent on the year. The annual reading was its first positive reading since February 2009. Only part of the April acceleration could be attributed to energy where prices jumped 1.4 percent on the month. The core index was up a firm 0.6 percent, boosting its 12-month rate from 0.2 percent to 1.0 percent. Basic goods prices were up 1.4 percent on the month and 3.0 percent on the year. Consumer and capital goods sector prices were flat on the month but both were down on the year. April producer prices were up 0.8 percent on the month and 0.6 percent on the year. Excluding construction, the PPI was up 0.6 percent and 0.7 percent on the year. The annual reading was its first positive reading since February 2009. Only part of the April acceleration could be attributed to energy where prices jumped 1.4 percent on the month. The core index was up a firm 0.6 percent, boosting its 12-month rate from 0.2 percent to 1.0 percent. Basic goods prices were up 1.4 percent on the month and 3.0 percent on the year. Consumer and capital goods sector prices were flat on the month but both were down on the year.
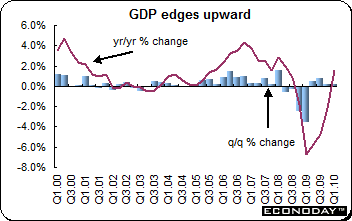 First quarter gross domestic product expanded a sluggish 0.2 percent on the quarter and 1.6 percent on the year after a 0.2 percent rise and 2.2 percent decline respectively in the fourth quarter of 2009. The economy has now grown for four successive quarters but the level of total output in the period just ended was still more than 5 percent below its most recent peak in the first quarter of 2008. Quarterly growth was more than fully accounted for by a surge in business inventories. This added 1.3 percentage points to the bottom line having subtracted 1.1 percentage points at the end of 2009. Disappointingly, private consumption dropped 0.8 percent — its third consecutive decline — while capital expenditure dropped 1.6 percent and construction investment slumped 3.8 percent. The only chink of light in an otherwise depressed private sector was a 1.6 percent rebound in equipment investment following a 1.5 percent drop in the fourth quarter. Total domestic demand was up 1.4 percent, but only courtesy of the jump in stocks. Both exports (2.6 percent) and imports (6.1 percent) were robust but with the latter easily outperforming the former, net exports subtracted 1.1 percentage points from growth having added 1.6 percentage points last time. First quarter gross domestic product expanded a sluggish 0.2 percent on the quarter and 1.6 percent on the year after a 0.2 percent rise and 2.2 percent decline respectively in the fourth quarter of 2009. The economy has now grown for four successive quarters but the level of total output in the period just ended was still more than 5 percent below its most recent peak in the first quarter of 2008. Quarterly growth was more than fully accounted for by a surge in business inventories. This added 1.3 percentage points to the bottom line having subtracted 1.1 percentage points at the end of 2009. Disappointingly, private consumption dropped 0.8 percent — its third consecutive decline — while capital expenditure dropped 1.6 percent and construction investment slumped 3.8 percent. The only chink of light in an otherwise depressed private sector was a 1.6 percent rebound in equipment investment following a 1.5 percent drop in the fourth quarter. Total domestic demand was up 1.4 percent, but only courtesy of the jump in stocks. Both exports (2.6 percent) and imports (6.1 percent) were robust but with the latter easily outperforming the former, net exports subtracted 1.1 percentage points from growth having added 1.6 percentage points last time.
 March seasonally adjusted merchandise trade deficit widened to €1.87 billion from a slightly larger revised deficit of €1.73 billion in February. The modest deterioration reflected an expansion in both sides of the balance sheet. Nominal exports were up 2.2 percent on the month, their fifth consecutive monthly rise, while imports climbed a marginally stronger 2.6 percent, their eighth straight monthly gain. Within a 17.1 percent annual growth rate for exports, consumer goods were up 12.3 percent, capital goods were up 14.6 percent and intermediates gained 17.2 percent. Energy exports soared 96.8 percent but only accounted for a little more than 2 percentage points of the total increase. Imports were 22.6 percent higher on the year with intermediates (up 33.9 percent) again particularly robust. Capital goods imports advanced an annual 13.0 percent while consumer goods were up 14.4 percent. Energy expanded 30.3 percent. March seasonally adjusted merchandise trade deficit widened to €1.87 billion from a slightly larger revised deficit of €1.73 billion in February. The modest deterioration reflected an expansion in both sides of the balance sheet. Nominal exports were up 2.2 percent on the month, their fifth consecutive monthly rise, while imports climbed a marginally stronger 2.6 percent, their eighth straight monthly gain. Within a 17.1 percent annual growth rate for exports, consumer goods were up 12.3 percent, capital goods were up 14.6 percent and intermediates gained 17.2 percent. Energy exports soared 96.8 percent but only accounted for a little more than 2 percentage points of the total increase. Imports were 22.6 percent higher on the year with intermediates (up 33.9 percent) again particularly robust. Capital goods imports advanced an annual 13.0 percent while consumer goods were up 14.4 percent. Energy expanded 30.3 percent.
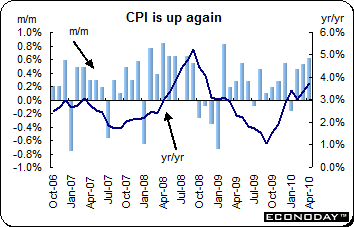 April consumer prices were up 0.6 percent on the month and 3.7 percent when compared with last year. The other two main measures of inflation also accelerated sharply. Both the RPI and RPIX posted 1.0 percent monthly gains, lifting the annual rate of the former from 4.4 percent to 5.3 percent and of the latter from 4.8 percent to 5.4 percent. Core CPI was up 0.4 percent and 3.1 percent on the year and a new series high. The largest positive impact on the overall 12-month rate came from clothing & footwear. Here deflation fell from 2.6 percent in March to just 0.6 percent due to a combination of a weak base and the boost to prices that invariably accompanies the introduction of new seasonal lines. Other sizeable contributions came from food & drink and alcohol & tobacco and miscellaneous goods & services. However inflation rates declined in furniture & household goods (2.5 percent from 3.1 percent), recreation & culture (0.0 percent from 0.3 percent) and transport (11.0 percent from 11.3 percent). April consumer prices were up 0.6 percent on the month and 3.7 percent when compared with last year. The other two main measures of inflation also accelerated sharply. Both the RPI and RPIX posted 1.0 percent monthly gains, lifting the annual rate of the former from 4.4 percent to 5.3 percent and of the latter from 4.8 percent to 5.4 percent. Core CPI was up 0.4 percent and 3.1 percent on the year and a new series high. The largest positive impact on the overall 12-month rate came from clothing & footwear. Here deflation fell from 2.6 percent in March to just 0.6 percent due to a combination of a weak base and the boost to prices that invariably accompanies the introduction of new seasonal lines. Other sizeable contributions came from food & drink and alcohol & tobacco and miscellaneous goods & services. However inflation rates declined in furniture & household goods (2.5 percent from 3.1 percent), recreation & culture (0.0 percent from 0.3 percent) and transport (11.0 percent from 11.3 percent).
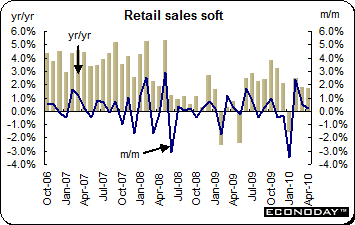 April retail sales were up 0.2 percent and were up 1.7 percent on the year. Excluding fuel, sales edged up just 0.1 percent on the month but were 3.0 percent above their year-ago level. Non-specialized and clothing & footwear stores purchases were up 2.2 percent and 2.0 percent on the month respectively. However, non-store retailing dropped 2.0 percent and there were significant declines too in household goods (1.7 percent) and in the other stores category (0.5 percent). Food sales were unchanged from March but total non-food purchases advanced 0.5 percent. April retail sales were up 0.2 percent and were up 1.7 percent on the year. Excluding fuel, sales edged up just 0.1 percent on the month but were 3.0 percent above their year-ago level. Non-specialized and clothing & footwear stores purchases were up 2.2 percent and 2.0 percent on the month respectively. However, non-store retailing dropped 2.0 percent and there were significant declines too in household goods (1.7 percent) and in the other stores category (0.5 percent). Food sales were unchanged from March but total non-food purchases advanced 0.5 percent.
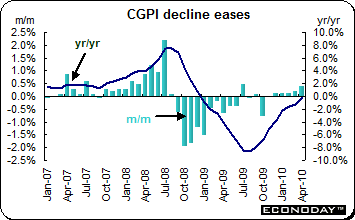 Corporate goods price index was up for the fifth month, gaining 0.4 percent. On the year, the CGPI was down 0.2 percent after sinking a revised 1.3 percent in March. Both petroleum & coal products and nonferrous metal prices gains contributed to the monthly increase and the reduced decline in the annual change. Petroleum & coal prices were up 5.1 percent on the month and 28.3 percent on the year. Nonferrous metals prices were up 4.8 percent and 24.3 percent on the year. Iron & steel also contributed to the monthly price gain, climbing 2.5 percent. However, on the year, prices are down 7.4 percent. Corporate goods price index was up for the fifth month, gaining 0.4 percent. On the year, the CGPI was down 0.2 percent after sinking a revised 1.3 percent in March. Both petroleum & coal products and nonferrous metal prices gains contributed to the monthly increase and the reduced decline in the annual change. Petroleum & coal prices were up 5.1 percent on the month and 28.3 percent on the year. Nonferrous metals prices were up 4.8 percent and 24.3 percent on the year. Iron & steel also contributed to the monthly price gain, climbing 2.5 percent. However, on the year, prices are down 7.4 percent.
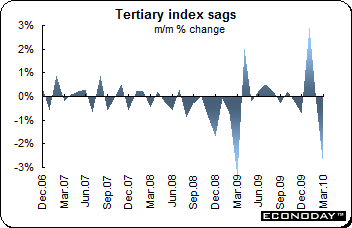 March tertiary industry activity plunged by 3.0 percent following a revised February drop of 0.3 percent. March’s swoon is much larger than anticipated by analysts who had expected a monthly drop of 0.3 percent. On the year, the index was up 1.2 percent for the second consecutive increase. Information & communications slumped 8.4 percent on the month while wholesale & retail trade sank 4.3 percent. Scientific research, professional & technical services dropped 3.2 percent. Other categories that declined on the month included finance & insurance, medical, health care & welfare, electricity, gas, heat supply & water and learning support. Miscellaneous services were on the month as were transport & postal activities, living related & personal services & amusement services, real estate & goods rental and compound services. March tertiary industry activity plunged by 3.0 percent following a revised February drop of 0.3 percent. March’s swoon is much larger than anticipated by analysts who had expected a monthly drop of 0.3 percent. On the year, the index was up 1.2 percent for the second consecutive increase. Information & communications slumped 8.4 percent on the month while wholesale & retail trade sank 4.3 percent. Scientific research, professional & technical services dropped 3.2 percent. Other categories that declined on the month included finance & insurance, medical, health care & welfare, electricity, gas, heat supply & water and learning support. Miscellaneous services were on the month as were transport & postal activities, living related & personal services & amusement services, real estate & goods rental and compound services.
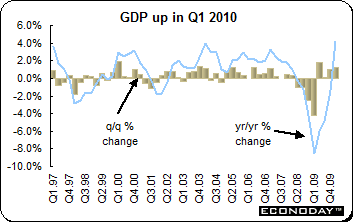 First quarter preliminary gross domestic product was up 1.2 percent on the quarter and 4.2 percent when compared with the same quarter a year ago. GDP growth was 4.9 percent on an annualized basis. Domestic demand was up 0.6 percent on the quarter thanks to an improving employment outlook, steadier incomes and a rush to make use of the government econ rewards program before it ended in April (it has since been extended). Within domestic demand, private consumption was up 0.3 percent. Private non-residential investment was up 1 percent on the quarter. Domestic demand contributed 0.6 percent to growth while net exports contributed 0.7 percent. Net exports were up thanks to the recovering global economy, especially in emerging countries, while private consumption was spurred by government policy measures. First quarter preliminary gross domestic product was up 1.2 percent on the quarter and 4.2 percent when compared with the same quarter a year ago. GDP growth was 4.9 percent on an annualized basis. Domestic demand was up 0.6 percent on the quarter thanks to an improving employment outlook, steadier incomes and a rush to make use of the government econ rewards program before it ended in April (it has since been extended). Within domestic demand, private consumption was up 0.3 percent. Private non-residential investment was up 1 percent on the quarter. Domestic demand contributed 0.6 percent to growth while net exports contributed 0.7 percent. Net exports were up thanks to the recovering global economy, especially in emerging countries, while private consumption was spurred by government policy measures.
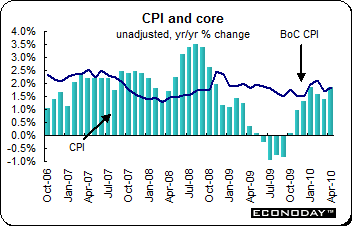 April consumer price index was up 0.3 percent and up 1.8 percent when compared with last year. Excluding food and energy the CPI was up 0.4 percent on the month and 1.2 percent on the year. The Bank of Canada's preferred index climbed 0.3 percent from March and 1.9 percent from a year ago. Energy prices were up 9.8 percent on April 2009 after a 5.8 percent increase in the year to March. Seasonally adjusted consumer prices edged up 0.1 percent on the month. Within this there were particularly marked increases in shelter (up 0.6 percent), clothing & footwear (up 1.3 percent) and health and personal care (up 0.6 percent). However, advances in most other areas were relatively mild and food prices actually fell 0.1 percent. April consumer price index was up 0.3 percent and up 1.8 percent when compared with last year. Excluding food and energy the CPI was up 0.4 percent on the month and 1.2 percent on the year. The Bank of Canada's preferred index climbed 0.3 percent from March and 1.9 percent from a year ago. Energy prices were up 9.8 percent on April 2009 after a 5.8 percent increase in the year to March. Seasonally adjusted consumer prices edged up 0.1 percent on the month. Within this there were particularly marked increases in shelter (up 0.6 percent), clothing & footwear (up 1.3 percent) and health and personal care (up 0.6 percent). However, advances in most other areas were relatively mild and food prices actually fell 0.1 percent.
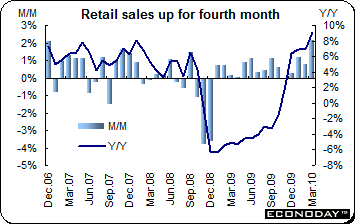 March retail sales jumped 2.1 percent and were up 9.1 percent on the year. Significantly the surge in nominal sales was more than matched in volumes which jumped fully 2.2 percent from their mid-quarter level. Purchases were up on the month in eight of the eleven sub-sectors. Among these, autos fared especially well with a 3.6 percent advance led by a 3.5 percent increase at new car dealers. Excluding this category total cash sales were up a very solid 1.7 percent on the month and 7.5 percent on the year. Gas station sales rose 2.3 percent from February. Other areas enjoying an especially good month were building materials & outdoor equipment (6.6 percent), health & personal care (2.4 percent), clothing (4.4 percent) and sporting goods, music & books (3.1 percent). The only sub-sectors to see a decline in demand were furniture & home furnishings (0.9 percent), food & beverages (0.1 percent) and miscellaneous stores (1.1 percent). March retail sales jumped 2.1 percent and were up 9.1 percent on the year. Significantly the surge in nominal sales was more than matched in volumes which jumped fully 2.2 percent from their mid-quarter level. Purchases were up on the month in eight of the eleven sub-sectors. Among these, autos fared especially well with a 3.6 percent advance led by a 3.5 percent increase at new car dealers. Excluding this category total cash sales were up a very solid 1.7 percent on the month and 7.5 percent on the year. Gas station sales rose 2.3 percent from February. Other areas enjoying an especially good month were building materials & outdoor equipment (6.6 percent), health & personal care (2.4 percent), clothing (4.4 percent) and sporting goods, music & books (3.1 percent). The only sub-sectors to see a decline in demand were furniture & home furnishings (0.9 percent), food & beverages (0.1 percent) and miscellaneous stores (1.1 percent).
Equities sank last week as investors sold in the wake of unsettling news from Europe along with continued policy tightening in China. The euro plunged to a four year low but managed to reverse course and climb at week’s end. Economic data were mixed with several indicators not meeting analysts’ expectations.
On the economic front, the upcoming week will be quiet except in Japan where the end of month data deluge is due. And perhaps a modicum of calm will return to the financial markets now that the German parliament has approved the country’s contribution to the rescue pact and the U.S. financial legislation has passed the Senate. Now the regulatory unknowns that addled investors are known — until next time.
| The following indicators will be released this week... |
| Europe |
|
|
| May 25 |
UK |
Gross Domestic Product (Q1.2010 revised) |
| May 26 |
France |
Consumption of Manufactured Goods (April) |
|
|
|
| Asia/Pacific |
|
|
| May 24 |
Japan |
All Sector Activity Index (March) |
| May 27 |
Japan |
Merchandise Trade Balance (April) |
| May 28 |
Japan |
Consumer Price Index (April, May) |
|
|
Unemployment Rate (April) |
|
|
Household Spending (April) |
|
|
Retail Sales (April) |
|
|
|
Anne D Picker is the author of International Economic Indicators and Central Banks.
|
