|
Simply Economics will be taking next week off
Simply Economics will return on Thursday, December 31, 2009
Merry Christmas and Happy New Year
from all of us at Econoday!
Each week, you expect to have to dig below the headline number for one or two indicators to see what is really going on. But this past week, more indicators than usual required much closer examination—with indicators ranging from the manufacturing sector to housing to inflation. In turn, it was a volatile week for the financial markets as equities, bonds, and oil prices swung significantly. Quadruple witching this past Friday added to the fun.
Equities were mixed this past week with Blue Chips down and techs and small caps up. The week got off to a nice start as Abu Dhabi pledged $10 billion to support Dubai World’s Nakheel real-estate unit and Exxon announced its plan to purchase XTO Energy Inc. Stocks reversed course on Tuesday as Citicorp planned to sell shares to pay back bailout funds from the government. JP Morgan Chase also announced higher delinquency rates on credit cards. Economic indicator news came into play as a spike in headline PPI inflation and a jump in industrial production led some traders to believe that the Fed will tighten sooner than had been expected.
A jump in housing starts supported a mostly up Wednesday.  Thursday, it was a battle of dueling economic and company news. Better-than-expected gains in the Philly Fed index and leading economic indicators were overwhelmed by a worse-than-expected jobless claims report and a disappointing outlook from FedEx. Thursday, it was a battle of dueling economic and company news. Better-than-expected gains in the Philly Fed index and leading economic indicators were overwhelmed by a worse-than-expected jobless claims report and a disappointing outlook from FedEx.
Finally, on Friday quadruple witching led to a last minute jump in equities at close. Quadruple witching takes place when contracts expire for stock market index futures, market index options, stock options and stock futures.
Equities were mixed this past week. The Dow was down 1.4 percent; the S&P 500, down 0.4 percent; the Nasdaq, up 1.0 percent; and the Russell 2000, up 1.7 percent.
For the year-to-date, major indexes are up as follows: the Dow, up 17.7 percent; the S&P 500, up 22.1 percent; the Nasdaq, up 40.2 percent; and the Russell 2000, up 22.2 percent.
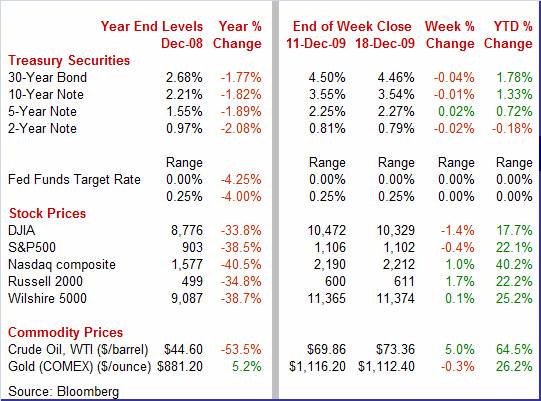
Weekly percent change column reflects percent changes for all components except interest rates. Interest rate changes are reflected in simple differences.
 Treasury yields were little changed and mixed for the week despite moderate volatility within the week. Treasury yields were little changed and mixed for the week despite moderate volatility within the week.
The first widespread move in yields was on Tuesday as a stronger-than-expected PPI report bumped up yields despite a soft Empire State manufacturing report. There was little reaction to the as-expected Fed FOMC announcement for no rate change.
But rates headed the other direction on Thursday and in a big way. Initial jobless claims were unexpectedly negative, rising instead of falling as the consensus projected. A sharp drop in equities led to flight to safety in Treasuries. Friday, reversal of flight to safety bumped rates up somewhat as stocks rose and worries over Greek fiscal problems eased.
For this past week Treasury rates were mixed as follows: 3-month T-bill, up 2 basis points; the 2-year note, down 2 basis points; the 5-year note, up 2 basis points; the 7-year note, up 1 basis point; the 10-year bond, down 1 basis point; and the 30-year bond, down 4 basis points.
 Oil prices were up significantly for the week despite a surge in the dollar over the same period. Key factors were inventories, an Iranian incursion into Iraqi territory, and a weather forecast. Oil prices were up significantly for the week despite a surge in the dollar over the same period. Key factors were inventories, an Iranian incursion into Iraqi territory, and a weather forecast.
 Late Monday, a 10-day National Weather Service forecast late Monday called for below-normal temperatures in much of the eastern United States. The Northeast is a heavy consumer of heating oil. Tuesday’s strong industrial production report along with OPEC boosting its forecast for oil demand for 2010 helped lift the spot price for West Texas Intermediate. A sizeable drop in crude inventories on Wednesday pushed up crude prices to near $73 per barrel. A jump in the dollar bumped crude back down on Thursday as the dollar hit a three-month high against the euro. Late Monday, a 10-day National Weather Service forecast late Monday called for below-normal temperatures in much of the eastern United States. The Northeast is a heavy consumer of heating oil. Tuesday’s strong industrial production report along with OPEC boosting its forecast for oil demand for 2010 helped lift the spot price for West Texas Intermediate. A sizeable drop in crude inventories on Wednesday pushed up crude prices to near $73 per barrel. A jump in the dollar bumped crude back down on Thursday as the dollar hit a three-month high against the euro.
After close on Thursday, news that an Iraqi oil field had been surrounded by Iranian soldiers caused crude to spike. But on Friday, a run up in the dollar during most of the day helped crude prices come off earlier highs.
 Net for the week, spot prices for West Texas Intermediate rose $3.50 per barrel to settle at $73.36. Net for the week, spot prices for West Texas Intermediate rose $3.50 per barrel to settle at $73.36.
Many traders have been focusing on the net decline in oil prices since November for oil’s impact on inflation. However, the real impact on inflation numbers will come from how the seasonally adjusted gasoline and heating oil prices affect the PPI, CPI, and PCE price index. And it is seasonally adjusted oil prices that are more correlated with these inflation measures than the not-seasonally-adjusted crude oil prices.
Econoday has begun seasonally adjusted monthly spot oil prices with the traditional methodology—the Census Bureau’s X-11 technique. This chart shows seasonally adjusted and not-seasonally adjusted numbers on a monthly average basis. For December, the data are based on a daily average for the month to date. Seasonally adjusted, the December average thus far is up 3.1 percent over November, following a 6.1 percent boost that month. This suggests that oil’s impact on inflation numbers is still on the upside—though pass through of oil costs to final measures of inflation vary significantly on a monthly basis.
This past week was a net positive for the economy. However, one certainly had to peel one or two layers into the data to see the underlying picture for more reports than usual. Or at least one had to do a little averaging over recent reports to net out volatility. There were plenty of question marks about data on the manufacturing sector, housing, and inflation.
 A key point for the manufacturing sector last week was that November numbers were very strong but inklings for December from manufacturing surveys were decidedly mixed. We start with the November industrial production report. A key point for the manufacturing sector last week was that November numbers were very strong but inklings for December from manufacturing surveys were decidedly mixed. We start with the November industrial production report.
Overall industrial production in November ramped up 0.8 percent, following a revised no change figure for October. The manufacturing component was particularly strong, spiking 1.1 percent, following a revised 0.2 percent dip in October. Utilities output declined 1.8 percent in November while mining output rebounded 2.1 percent.
 Within manufacturing, durables jumped 1.0 percent while nondurables were up a sharp 1.1 percent in November. The latest gains were broad based in both major components. Autos did help boost durables as assemblies of motor vehicles rose by 200,000 units in November to 7.2 million units annualized. Within manufacturing, durables jumped 1.0 percent while nondurables were up a sharp 1.1 percent in November. The latest gains were broad based in both major components. Autos did help boost durables as assemblies of motor vehicles rose by 200,000 units in November to 7.2 million units annualized.
While changes in auto production have caused some recent volatility in manufacturing output, the underlying trend is good. Manufacturing excluding motor vehicles has risen in four of the last five months, including a 1.1 percent jump in November after a 0.2 percent dip the month before.
Manufacturers are gradually putting more machinery to work as the overall capacity utilization rate rose to 71.3 percent from 70.6 percent in October. This is moderate progress from the recession low and historical low of 68.3 percent set in June of this year. Still, utilization is going to have to rise much more before there are inflation pressures from supply constraints overall.
This past week, the Empire State and Philly Fed manufacturing surveys painted very different pictures for their respective regions. Traders were rattled early Tuesday morning with the release of the New York Fed’s  Empire State manufacturing index for December which plunged to 2.55 from far stronger rates of growth in November and October with readings of 23.51 and 34.57, respectively. December’s figure was barely above the breakeven level of zero. Empire State manufacturing index for December which plunged to 2.55 from far stronger rates of growth in November and October with readings of 23.51 and 34.57, respectively. December’s figure was barely above the breakeven level of zero.
The December report put into doubt the strength of the recovery in manufacturing as weakness was broad based. The new orders index dropped to 2.20 from November's 16.66 while indexes for shipments, employment, the workweek, and unfilled orders also declined.
The later in the morning (Tuesday) release of the strong national industrial production report reminded markets that regional numbers do not always correlate with nation numbers. But the fact that the Empire report was more current still left doubts about the strength of the manufacturing sector. A little relief came with Thursday’s Philly Fed report.
Philadelphia's headline index headed in the opposite direction from Empire’s for December, rising rose more than 3-1/2 points to 20.4 indicating strong month-to-month acceleration in the region's manufacturing sector. New orders did slow a bit in the Philadelphia report, but at 6.5 still showed significant month-to-month growth for December. Unfilled orders, at zero, showed no month-to-month change in what is a big improvement from a recession's run of declines. Inventory draw slowed in the month to minus 7.4 compared to minus 31.8 just two months ago. The prospect of rising backlogs and the approaching shift to a build for inventories are positives going forward.
Net, the Empire State and Philly Fed reports indicate continued moderate growth for manufacturing.
 Housing starts looked good for November—but were not as strong once you took into account relative component gains and October weakness. Construction companies picked up the pace of groundbreaking for new homes as housing starts in November rebounded 8.9 percent, following a revised 10.1 percent plummet in October. The November pace of 0.574 million units annualized was down 12.4 percent on a year-ago basis. Housing starts looked good for November—but were not as strong once you took into account relative component gains and October weakness. Construction companies picked up the pace of groundbreaking for new homes as housing starts in November rebounded 8.9 percent, following a revised 10.1 percent plummet in October. The November pace of 0.574 million units annualized was down 12.4 percent on a year-ago basis.
However, most of November’s increase was largely a comeback and then some in multifamily starts—a volatile component. The latest comeback was led by a 67.3 percent rebound in multifamily starts, following a sharp 29.5 percent plunge in October. Meanwhile the single-family component edged up a merger 2.1 percent after a 7.1 percent fall the month before.
A key point about the single-family component is that homebuilders have had a lot of uncertainty about whether there would be a drop off in demand if homebuyer tax credits were allowed to expire this past November 30 as originally planned. These tax credits have been extended to April 2010 and expanded beyond just first-time homebuyers—meaning we may see more growth in the single-family component in coming months, albeit still moderate growth. The multifamily component is still weighed down by high vacancy rates for apartments and condos.
 This past week’s inflation data required a lot of picking apart to get a better handle on underlying trends. Not only did energy costs create some notable volatility, but also some series within the core for both the PPI and CPI. This past week’s inflation data required a lot of picking apart to get a better handle on underlying trends. Not only did energy costs create some notable volatility, but also some series within the core for both the PPI and CPI.
Energy costs jacked up the headline PPI for November but the core also rose significantly. The overall PPI jumped 1.8 percent in November after gaining 0.3 percent in October. The November gain was led by a 6.9 percent spike in energy and a 0.5 percent gain for food. At the core level, the PPI rebounded 0.5 percent after a huge 0.6 percent drop in October.
Turning to some component detail, the November jump in energy prices was led by gasoline which spurted up 14.2 percent after rising 1.9 percent the month before.
The core rate was boosted heavily by a 4.2 percent rebound in prices for light trucks, following a 5.2 percent drop in October. Also, tobacco products surged 2.2 percent in November after no change the month before.
 The details for the PPI indicate that the strong numbers for November are not so worrisome. Oil prices have since come down during December—although on a seasonally adjusted basis, there are up but at a slower pace. The jump in the core partly or mostly reflected getting back to near-term trend after October’s sharp drop. The core rebound was mainly for a comeback in prices for light trucks along with higher prices cigarettes. The details for the PPI indicate that the strong numbers for November are not so worrisome. Oil prices have since come down during December—although on a seasonally adjusted basis, there are up but at a slower pace. The jump in the core partly or mostly reflected getting back to near-term trend after October’s sharp drop. The core rebound was mainly for a comeback in prices for light trucks along with higher prices cigarettes.
For the overall PPI, the year-on-year rate increased to up 2.7 percent from minus 1.9 percent in October (seasonally adjusted). The core rate year-ago pace firmed to up 1.2 percent from up 0.7 percent the previous month. On a not seasonally adjusted basis for November, the year-ago gain for the headline PPI was 2.4 percent while the core was up 1.2 percent.
 As with the PPI, energy costs led to a jump in the headline CPI figure. But the big difference for the CPI was a flat core number. Overall consumer price inflation jumped 0.4 percent in November after gaining 0.3 percent the month before. Core CPI inflation eased to 0.0 percent (no change) after a 0.2 percent increase in October. As with the PPI, energy costs led to a jump in the headline CPI figure. But the big difference for the CPI was a flat core number. Overall consumer price inflation jumped 0.4 percent in November after gaining 0.3 percent the month before. Core CPI inflation eased to 0.0 percent (no change) after a 0.2 percent increase in October.
 The headline number was boosted mainly by a 4.1 percent surge in energy costs after a 1.5 percent gain in October. Gasoline was up 6.4 percent, following a 1.6 percent gain the month before. Food price inflation was soft in November with a 0.1 percent rise—the same as in October. The headline number was boosted mainly by a 4.1 percent surge in energy costs after a 1.5 percent gain in October. Gasoline was up 6.4 percent, following a 1.6 percent gain the month before. Food price inflation was soft in November with a 0.1 percent rise—the same as in October.
The core CPI was kept weak by services components not found in the PPI—notably some shelter components. Within the core, declines in shelter indexes offset increases in costs for new and used motor vehicles, medical care, airline fares, and tobacco. Shelter costs declined 0.2 percent in the latest month, led by a 1.5 percent drop in lodging away from home. Hotels—including resorts—continued to engage in heavy discounting. Owners’ equivalent rent dipped 0.1 percent. High unemployment is keeping rent soft in general.
Year-on-year, headline inflation increased to plus 1.9 percent (seasonally adjusted) from minus 0.2 percent in October. The core rate was unchanged in November at up 1.7 percent. On an unadjusted year-ago basis, the headline number was up 1.8 percent in November while the core was up 1.7 percent.
Inflation is still high at the headline level but it is not as severe as indicated by the PPI for November. A flat reading for the CPI core suggests that a sluggish economy is keeping underlying inflation tame for now. However, there is a notable caveat being missed by traders and even inflation hawks. Oil prices have come down only on a not seasonally adjusted basis—and less than is typical for December. That is, seasonally adjusted oil prices are up in December thus far and will continue upward pressure on headline inflation though likely not as much as in November.
 The recovery is likely to continue and skip a double dip, according to The Conference Board's index of leading economic indicators. This index rose a strong 0.9 percent in November, following a 0.3 percent boost the month before. The recovery is likely to continue and skip a double dip, according to The Conference Board's index of leading economic indicators. This index rose a strong 0.9 percent in November, following a 0.3 percent boost the month before.
The latest increase was led by the yield curve component which had a 0.33 percentage point contribution, followed by initial unemployment claims, 0.26 percentage points, and the average workweek for manufacturing, 0.19 percentage points. Also making positive contributions were building permits, stock prices, and money supply. Signals for economic weakness were very mild including slightly faster delivery times (fewer demand bottlenecks) and a mild step back for consumer confidence.
The coincident indicator is picking up steam, at plus 0.2 percent compared to October's zero reading to indicate mild economic acceleration in the ongoing quarter. Revisions to the coincident index have been upward and continue to suggest that the recession likely ended in June of this year.
The Fed ended the year with policy rates where they started the year—with the fed funds target rate at a range of zero to 0.25 percent. Furthermore, the Fed kept its language for keeping the target low for some time. Importantly, the FOMC meeting statement also gave a modest upgrade on the economy, indicating that the Fed’s easy monetary policy has been working.
"The Committee will maintain the target range for the federal funds rate at 0 to 1/4 percent and continues to anticipate that economic conditions, including low rates of resource utilization, subdued inflation trends, and stable inflation expectations, are likely to warrant exceptionally low levels of the federal funds rate for an extended period."
 It was not dramatic, but the Fed again has upgraded its view of the economy—notably that the labor market is not worsening as much as it has. The Fed expects economic activity to remain weak “for a time.” It was not dramatic, but the Fed again has upgraded its view of the economy—notably that the labor market is not worsening as much as it has. The Fed expects economic activity to remain weak “for a time.”
"Information received since the Federal Open Market Committee met in November suggests that economic activity has continued to pick up and that the deterioration in the labor market is abating."
The Fed only minimally addressed inflation concerns, leaving commentary little changed from the last FOMC, with expectations of low inflation ahead for now.
“With substantial resource slack likely to continue to dampen cost pressures and with longer-term inflation expectations stable, the Committee expects that inflation will remain subdued for some time.”
Apparently, the Fed sees the latest inflation numbers as blips—especially since the core CPI for November came in flat—though the Fed offered no comments on this. The FOMC would have reviewed this morning’s CPI report prior to voting on the statement.
The FOMC did not change its plans for ending its balance sheet expansion by the end of the first quarter of 2010. Overall, the Fed has left monetary policy unchanged. The remaining question is when the unwinding begins. The Fed has not addressed that question officially outside of the language that the fed funds rate will remain low for an extended period. But the balance sheet could and likely will start shrinking sooner.
The recovery is still on track with moderate growth in housing and manufacturing continuing. Inflation was mixed in November but still subdued at the core level after discounting monthly volatility.
The holiday shortened trading week gets a burst of market moving indicators beginning with closing the books on third quarter GDP on Tuesday. The personal income report is a key reading on the consumer on Wednesday and Thursday’s durables report may help clarify last week’s mixed news on manufacturing. Of course, the existing and new home sales reports this week will garner quite a bit of market attention.
GDP for the second estimate for the third quarter growth was revised downward to an annualized 2.8 percent from the initial estimate of 3.5 percent. The third quarter increase, however, appears to have ended the recession which faded with a 0.7 percent dip in the second quarter. With the third estimate for the third quarter, the components facing potentially notable revisions are inventories and net exports. Turning to inflation, the GDPI price index was nudged down to a 0.5 percent annualized pace for the third quarter from the initial estimate of 0.8 percent.
Real GDP Consensus Forecast for third estimate Q3 09: +2.7 percent annual rate
Range: +2.5 to +2.9 percent annual rate
GDP price index Consensus Forecast for third estimate Q3 09: +0.5 percent annual rate
Range: +0.5 to +0.5 percent annual rate
Existing home sales for October came in at a much higher-than-expected annual rate of 6.10 million, up a record 10.1 percent. October’s pace was driven by the expected November expiration of first-time buyer credits. Supply on the market fell to 7.0 months versus 8.0 months in September and 10.2 months a year ago. Though the credits have been extended until April and expanded beyond first-time buyers, November sales are likely to come off the October surge.
Existing home sales Consensus Forecast for November 09: 6.25 million-unit rate
Range: 5.20 to 6.34 million-unit rate
Personal income in October edged up 0.2 percent, matching a 0.2 percent rise in September. The important wages and salaries component, however, was flat after a 0.1 percent dip in September. Personal consumption expenditures jumped 0.7 percent after a 0.6 percent drop in September. The rebound reflected a comeback in auto sales after the post-clunkers drop off in September. Headline PCE price inflation rose to 0.3 percent from a 0.1 percent rise in September. Core PCE inflation edged up to 0.2 percent in October from 0.1 percent the month before. Looking ahead, we should get some improvement in personal income—or rather at least in wages & salaries as aggregate payroll earnings rebounded 0.7 percent in November. PCEs growth should be healthy as retails sales excluding autos were up 1.2 percent for November and unit new motor vehicles sales advanced 4.5 percent. PCE inflation numbers should be mixed, closely tracking November’s headline and core inflation numbers of up 0.4 percent and flat, respectively.
Personal income Consensus Forecast for November 09: +0.5 percent
Range: +0.3 to +0.7 percent
Personal consumption expenditures Consensus Forecast for November 09: +0.6 percent
Range: +0.4 to +0.9 percent
Core PCE price index Consensus Forecast for November 09: +0.1 percent
Range: +0.0 to +0.1 percent
The Reuter's/University of Michigan's Consumer sentiment index for mid-month December jumped to 73.4 from 67.4 for the November final estimate. The latest gain was led by a spurt in the current economic conditions index—to 79.1 from 68.8 in November. The expectations index improved, but only slightly—to 69.7 from 66.5 the prior month. Inflation expectations for one year out dipped 6 tenths to 2.1 percent and for five years out declined 4 tenths to 2.6 percent.
Consumer sentiment Consensus Forecast for final December 09: 73.5
Range: 72.0 to 74.0
New home sales jumped 6.2 percent in October to a much higher-than-expected annual rate of 430,000. Supply was very low, the result of improving sales. Only 239,000 new homes were on the market in October in what was the lowest number going all the way back to 1971. Supply at the current sales rate fell to 6.7 months, compared to September's 7.4 months and compared with 11.1 months a year ago.
New home sales Consensus Forecast for November 09: 440 thousand-unit annual rate
Range: 415 thousand to 460 thousand-unit annual rate
Durable goods orders in October fell 0.6 percent, after a revised 2.2 percent rebound in September. Excluding the transportation component, new durables orders fell 1.3 percent, following a revised 2.1 percent jump in September. New orders for nondefense capital goods rose a revised 0.7 percent in October but excluding aircraft, they fell 3.4 percent. Looking ahead, we may see a rebound in many components of overall durables orders as the ISM new orders index for the month improved to 60.3 from 58.5 in October.
New orders for durable goods Consensus Forecast for November 09: +0.5 percent
Range: -1.0 percent to +1.5 percent
Initial jobless claims rose 7,000 in the December 12 week to 480,000. The four-week average, especially important to watch during the calendar and seasonal effects of the holidays, was down 5,250 to the lowest level since September last year at 467,500.
Jobless Claims Consensus Forecast for 12/19/09: 470,000
Range: 450,000 to 475,000
NYSE Early Close – 1:00 p.m. ET
SIFMA Recommended Early Close – 2:00 p.m. ET
U.S. Holiday: Christmas Day
All Markets Closed
R. Mark Rogers is the author of The Complete Idiot’s Guide to Economic Indicators, Penguin Books, October 2009.
Econoday Senior Writer Mark Pender contributed to this article.
|
