|
The economic news was mixed this past week while earnings probably were net positive above expectations. Although there were caveats with much of the economic news, equity traders preferred to see the glass as half full rather than half empty.
 Most equity indexes this past week posted their first gain in three weeks based on earnings that were better than expected more often than not and on mixed economic news that markets saw as net positive. However, there were significant weak spots in the economic news. Most equity indexes this past week posted their first gain in three weeks based on earnings that were better than expected more often than not and on mixed economic news that markets saw as net positive. However, there were significant weak spots in the economic news.
The economic news was wide ranging. A number of economic reports boosted stocks, starting with a healthy rise in the ISM manufacturing index for October. Housing numbers were unexpectedly strong with a spike in pending home sales for September and a sizeable gain in construction outlays for the same month. The consumer data were healthy—at least from the spending perspective. Motor vehicle sales rebounded in October and chain store sales were stronger than expected.
There was no shortage of labor market data with mixed impact on equities. At mid-week, the ADP report showed an easing in employment decline, boosting equities. But a larger-than-expected drop in initial jobless claims helped stocks surge on Thursday. That day’s jump in equities also was supported by a near record surge in third quarter productivity—which suggests higher corporate profits in the near term. Friday’s employment situation report had surprising impact on equities—very little net impact despite a four-tenths jump in the unemployment rate to 10.2 percent for October. Even though October’s payroll loss was somewhat larger than anticipated, significant upward revisions to August and September payrolls were seen by equities traders as a sign that the payroll jobs situation net was better than forecast. The jump in the unemployment rate was seen as a lagging indicator and the payroll numbers as more representative of the current strength of the economy.
The Fed came and went with its highly anticipated no change in policy at mid-week, but the FOMC statement’s caveats on the economy suggested that the Fed will wait longer to raise rates, which boosted equities temporarily Wednesday afternoon. But later in the day, a House bill to limit credit-card rates raised concern about bank earnings and led to a giveback in equity gains—especially for financials.
Company news and politics did come into play during the week. Ford beat expectations on the latest quarter’s profits. Billionaire investor Warren Buffet announced a planned buyout of railroad Burlington Northern Santa Fe. Costco and Gap reported better-than-expected sales. After Tuesday’s elections, health insurers benefitted from speculation that Democrats’ health-care reform has been undermined by Republican gubernatorial victories in New Jersey and Virginia.
But there were caveats—especially in the economic news. Motor vehicles sales may not be sustainable nor chain stores sales with rising unemployment. Home sales are not likely to see continued sizeable gains. Nonresidential and public sector construction appear to be on downtrends. And the nonmanufacturing sectors of the economy appear to be flat overall. Net, there were positives but again a key question is whether equities have again gotten ahead of the economy.
Equities were up this past week. The Dow was up 3.2 percent; the S&P 500, up 3.2 percent; the Nasdaq, up 3.3 percent; and the Russell 2000, up 3.1 percent.
For the year-to-date, major indexes are up as follows: the Dow, up 14.2 percent; the S&P 500, up 18.4 percent; the Nasdaq, up 34.0 percent; and the Russell 2000, up 16.2 percent.
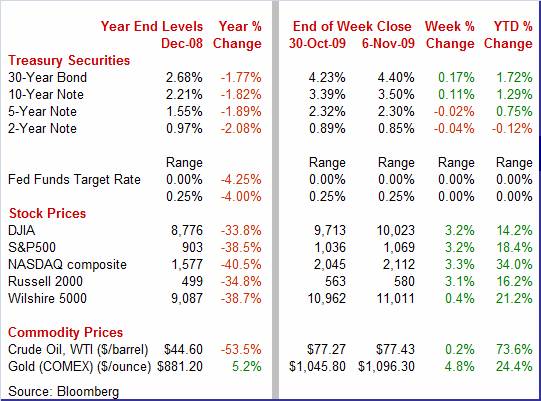
Weekly percent change column reflects percent changes for all components except interest rates. Interest rate changes are reflected in simple differences.
 Treasury yields were mixed this past week with longer maturities firming and shorter notes seeing rates slipping. Most of the firming in longer yields was during the first three days of the week. Stronger-than-expected economic news was behind the rate increases—including for ISM manufacturing, construction outlays, pending home sales, motor vehicle sales, and ADP employment. Treasury yields were mixed this past week with longer maturities firming and shorter notes seeing rates slipping. Most of the firming in longer yields was during the first three days of the week. Stronger-than-expected economic news was behind the rate increases—including for ISM manufacturing, construction outlays, pending home sales, motor vehicle sales, and ADP employment.
At week end, in contrast to equities traders, bond traders paid more attention to the spike in the unemployment rate, boosting prices for Treasuries and easing yields.
But the elephant in the room is that the Treasury announced that this coming week it will sell record amounts of 3-year notes, 10-year bonds, and 30-year bonds--$40 billion, $25 billion, and $16 billion, respectively. These supplies are certainly weighing on prices.
For this past week Treasury rates were mixed as follows: 3-month T-bill, unchanged; the 2-year note, down 4 basis points; the 5-year note, down 2 basis points; the 7-year note, up 3 basis points; the 10-year bond, up 11 basis points; and the 30-year bond, up 17 basis points.
 Crude oil prices netted little change this past week. But there was some interesting intraweek movement. Commodities markets—including oil—appeared to be more in tune with billionaire investor Warren Buffet’s announcement this past Tuesday of a planned purchase of Burlington Northern Santa Fe. The move was seen as his vote of confidence in the global economy and in demand for commodities in general. Spot prices for West Texas Intermediate rose on Wednesday as crude inventories unexpectedly dipped. On Friday, oil traders were in line with bond traders on the employment situation report—seeing the spike in the unemployment rate as more indicative of sluggishness in the economy. In turn, crude prices dipped. Crude oil prices netted little change this past week. But there was some interesting intraweek movement. Commodities markets—including oil—appeared to be more in tune with billionaire investor Warren Buffet’s announcement this past Tuesday of a planned purchase of Burlington Northern Santa Fe. The move was seen as his vote of confidence in the global economy and in demand for commodities in general. Spot prices for West Texas Intermediate rose on Wednesday as crude inventories unexpectedly dipped. On Friday, oil traders were in line with bond traders on the employment situation report—seeing the spike in the unemployment rate as more indicative of sluggishness in the economy. In turn, crude prices dipped.
Net for the week, spot prices for West Texas Intermediate were little changed, edging up 16 cents per barrel to settle at $77.43.
 Nonetheless, spot crude has been on an uptrend since early this year. Current prices are about 115 percent higher the lows earlier this year. Nonetheless, spot crude has been on an uptrend since early this year. Current prices are about 115 percent higher the lows earlier this year.
The big news for the week was the unemployment rate breaking over the double-digit mark, raising concerns about the health of the consumer sector. But manufacturing continued its moderate uptrend, providing support for economic growth. Meanwhile, the Fed has been keeping the liquidity spigots wide open—for added insurance that the recovery does not slip back into recession.
 The two surveys within the employment situation report pointed somewhat in different directions as to whether the jobs recession is easing. But, net, news still was not pretty. While the unemployment rate topped double digits, there also was evidence that job losses are slowing. First, nonfarm payroll employment in October declined 190,000, following a revised decrease of 219,000 in September and a revised contraction of 154,000 in August. September and August revisions were up 91,000 net for the two months (the net declines were smaller). Basically, the payroll survey is showing that job losses are still on a slowing trend but certainly are not in positive territory yet. The two surveys within the employment situation report pointed somewhat in different directions as to whether the jobs recession is easing. But, net, news still was not pretty. While the unemployment rate topped double digits, there also was evidence that job losses are slowing. First, nonfarm payroll employment in October declined 190,000, following a revised decrease of 219,000 in September and a revised contraction of 154,000 in August. September and August revisions were up 91,000 net for the two months (the net declines were smaller). Basically, the payroll survey is showing that job losses are still on a slowing trend but certainly are not in positive territory yet.
Payroll losses were widespread in both goods-producing and service-providing sectors. Goods-producing jobs contracted 129,000 in October, following a 114,000 decline the month before. Construction jobs fell 62,000 while manufacturing decreased 61,000 and mining dipped 5,000.
Service-providing job losses, however, slowed to a 61,000 drop from a 105,000 fall in September. The largest decline in services was a 66,000 decrease in trade & transportation, including a 40,000 fall in retail.
The one notable positive in the payroll survey portion of the employment situation was a 34,000 gain in temp help. This category is often seen as a leading indicator of hiring intentions by businesses. With incremental gains in August and September, this component has risen three months in a row.
 The household survey results were far more disappointing than the payroll numbers. The ranks of the unemployed continued to rise as the civilian unemployment rate worsened to 10.2 percent from 9.8 percent in September. The October rate is the highest since the same rate for April 1983.
By other measures of labor market underutilization, the jobs picture is even worse. If you include marginally attached workers (such as workers who want jobs now but have given up the job search due to continued lack of success in finding a job) plus part-time workers who want a full-time job but work part time for economic reasons, the under-employment rate spiked to 17.5 percent in October from 17.0 percent the month before. This indicates that it is going to take quite some time for the labor market to return to pre-recession strength.
The bottom line is that the labor market is still in recession even though overall economic growth is positive. The jump in unemployment is going to keep consumers cautious and economic growth sluggish. On the release, bond yields eased and stock futures dipped.
 Worst fears of sales being robbed from the future by cash-for-clunkers did not materialize. Yes, motor vehicle sales surged in August and plunged in September. But consumers were out buying vehicles in October, at a 10.5 million annualized unit rate for combined domestic-made and import models, compared to 9.2 million in September. While the October pace was still sharply below the 14.1 million sold in September, the important news is that it is notably above the roughly 9.2 to 9.7 million unit pace earlier in the year before clunkers was in effect. Certainly, the clunkers program did take some sales away from future months—but not as much as feared. Discounting recent sales volatility, sales appear to be on a modest uptrend. Worst fears of sales being robbed from the future by cash-for-clunkers did not materialize. Yes, motor vehicle sales surged in August and plunged in September. But consumers were out buying vehicles in October, at a 10.5 million annualized unit rate for combined domestic-made and import models, compared to 9.2 million in September. While the October pace was still sharply below the 14.1 million sold in September, the important news is that it is notably above the roughly 9.2 to 9.7 million unit pace earlier in the year before clunkers was in effect. Certainly, the clunkers program did take some sales away from future months—but not as much as feared. Discounting recent sales volatility, sales appear to be on a modest uptrend.
Domestics actually rebounded more than imports, rising 17.2 percent to 7.8 million units. Sales of imports gained 4.1 percent to a 2.7 million units.
 Manufacturing took the lead in the recovery over the summer and, according to the ISM manufacturing report, continued to add gradually to momentum in the autumn. The ISM manufacturing composite index jumped more than 3 points in October to 55.7. This is the strongest for this index in more than three years. Manufacturing took the lead in the recovery over the summer and, according to the ISM manufacturing report, continued to add gradually to momentum in the autumn. The ISM manufacturing composite index jumped more than 3 points in October to 55.7. This is the strongest for this index in more than three years.
Showing the most improvement of components of the composite was the production index which advanced over 7-1/2 points to 63.3. But the employment index also was a standout. This index rose almost 7 points to 53.1. This spurt put the manufacturing component in positive territory, indicating that manufacturers are starting to hire to keep up with production.
The inventory index also posted a gain—to 46.9 from 42.5 in September. The level is still in negative territory, indicating inventories are still decreasing but at a slower rate of decline. The supplier delivery index, however, slipped to 56.9 from 58.0 in September. The major leading indicator in the report, new orders, remained well above breakeven but eased from 60.8 in September to 58.5 in October—that is, growth in new orders was not as strong in the prior month. Overall, manufacturing has improved and has grown in recent months, but the new orders index suggests that gains may be uneven in the next few months.
Price increases were steady in the month, showing little change at 65.0 compared to 63.5 in September.
 While manufacturing is leading the economy, other sectors are net flat. The ISM's non-manufacturing index showed little change in month-to-month activity, coming in at 50.6 in October, down slightly from 50.9 the month before. Both numbers suggest barely positive growth for the non-manufacturing economy. While manufacturing is leading the economy, other sectors are net flat. The ISM's non-manufacturing index showed little change in month-to-month activity, coming in at 50.6 in October, down slightly from 50.9 the month before. Both numbers suggest barely positive growth for the non-manufacturing economy.
Of the four components in the composite, the new orders index posted the strongest gain (though still modest), up 1.4 points to 55.6. Business activity and supplier deliveries firmed slightly and further into positive territory while the employment index slipped further into negative territory. While the prospects for production are up based on orders, the forward momentum is not yet translating into hiring in the nonmanufacturing sector.
 The latest construction spending report corroborated recent trends in this sector—housing is gradually rebounding while nonresidential and public outlays are contracting. Overall construction spending advanced 0.8 percent in September after slipping a downwardly revised 0.1 percent in August. However, the decrease in August is now significantly lower than the original estimate of a 0.8 percent gain. The boost in spending in September was led by a 3.8 percent surge in private residential outlays. Private nonresidential declined 1.8 percent and public outlays decreased 0.1 percent in the latest month. Basically, gains in housing are being partially and heavily offset by other sectors—all the more reason improvement in housing is needed. The latest construction spending report corroborated recent trends in this sector—housing is gradually rebounding while nonresidential and public outlays are contracting. Overall construction spending advanced 0.8 percent in September after slipping a downwardly revised 0.1 percent in August. However, the decrease in August is now significantly lower than the original estimate of a 0.8 percent gain. The boost in spending in September was led by a 3.8 percent surge in private residential outlays. Private nonresidential declined 1.8 percent and public outlays decreased 0.1 percent in the latest month. Basically, gains in housing are being partially and heavily offset by other sectors—all the more reason improvement in housing is needed.
 Housing appears to be picking up momentum, according to the latest pending home sales—but much of it is likely a temporary effect of the coming expiration of the current program of tax credits for first-time homebuyers. Pending home sales shot 6.1 percent higher in September to an index level of 110.1. The gain, which follows a 6.4 percent surge in August, lifted the index to 36.9 percent above the low hit in January. This index has risen a record eight months in a row. Housing appears to be picking up momentum, according to the latest pending home sales—but much of it is likely a temporary effect of the coming expiration of the current program of tax credits for first-time homebuyers. Pending home sales shot 6.1 percent higher in September to an index level of 110.1. The gain, which follows a 6.4 percent surge in August, lifted the index to 36.9 percent above the low hit in January. This index has risen a record eight months in a row.
The latest surge in pending home sales was led by a monthly 10.2 percent boost in the West Census region, followed by the Midwest gaining 8.1 percent and the South rising 4.9 percent. Sales in the Northeast slipped 2.0 percent.
Almost certainly, the overall surge for September was due to a rush by first-time homebuyer to take advantage of tax credits that are available only if the sale closes by November 30. More recently, Congress has passed legislation that extends the tax credit for home purchases and expands it beyond first-time buyers. This legislation was signed by President Obama this past Friday and likely will help home sales improve. But we probably have seen the largest gains with the recent numbers boosted by fears of not getting sales closed in time. Also, the number of first-time homebuyers has dwindled, leaving less potential for further strong increases in sales. Extending the credit to existing homeowners will help but not as much as with the initial program—especially since existing homeowners are saddled with the burden of selling their own home to make another purchase. First-time buyers don’t have that hurdle.
 To no one's surprise, the Fed kept its policy rates unchanged at this past week’s FOMC meeting. The latest FOMC statement was slightly more positive about the current economy than the late September announcement. With caveats about weak spots in the economy, the Fed said that the economic conditions "are likely to warrant exceptionally low levels of the federal funds rate for an extended period." The Fed still plans to expand its purchases of mortgage-backed securities but at a slowing pace. The Fed has completed its purchases of longer-term Treasuries and expects to conclude its purchases of mortgage-backed securities and agency debt by the end of the first quarter of 2010. To no one's surprise, the Fed kept its policy rates unchanged at this past week’s FOMC meeting. The latest FOMC statement was slightly more positive about the current economy than the late September announcement. With caveats about weak spots in the economy, the Fed said that the economic conditions "are likely to warrant exceptionally low levels of the federal funds rate for an extended period." The Fed still plans to expand its purchases of mortgage-backed securities but at a slowing pace. The Fed has completed its purchases of longer-term Treasuries and expects to conclude its purchases of mortgage-backed securities and agency debt by the end of the first quarter of 2010.
The language in the latest FOMC announcement was slightly more optimistic than last time but there are still several red flags noted. The Fed sees overall economic activity as having improved.
 "Information received since the Federal Open Market Committee met in September suggests that economic activity has continued to pick up. Conditions in financial markets were roughly unchanged, on balance, over the intermeeting period. Activity in the housing sector has increased over recent months." "Information received since the Federal Open Market Committee met in September suggests that economic activity has continued to pick up. Conditions in financial markets were roughly unchanged, on balance, over the intermeeting period. Activity in the housing sector has increased over recent months."
While housing has improved, the consumer sector is still suspect and business investment is slipping.
"Household spending appears to be expanding but remains constrained by ongoing job losses, sluggish income growth, lower housing wealth, and tight credit. Businesses are still cutting back on fixed investment and staffing, though at a slower pace; they continue to make progress in bringing inventory stocks into better alignment with sales."
Despite noted current improvement, the Fed anticipates that "economic activity is likely to remain weak for a time." The Fed anticipates a very slow recovery-and one in which the consumer sector is sluggish.
Due to "substantial resource slack," the FOMC sees inflation remaining "subdued for some time."
Both due to soft inflation expectations and the Fed continually pushing out the horizon in which Fed target rates will remain low, traders in the fed funds futures market also have bumped out when they expect the Fed to start tightening. Back in August, traders were expecting a 1.0 percent fed funds rate as early as May 2010. Now, they do not anticipate a 1.0 percent rate before the end of 2010.
The consumer sector, with help from government tax credits, has been a little more resilient than expected. Government subsidies also have helped housing to begin the process of recovery. But a continued weak labor market raises question marks about how much the consumer sector can contribute to economic growth in coming quarters. Yes, manufacturing has been a plus for the economy, but further healthy gains probably are to come from boosts in exports and/or business investment with the latter not that likely for now.
International trade highlights a lean week for economic data. Higher oil prices are bound to impact both the trade deficit and import prices Friday. Export growth will get heightened attention as analysts gauge the recovery's momentum.
U.S. Holiday: Veterans Day, Stocks and Futures Markets Open
Initial jobless claims declined 20,000 in the October 31 week to 512,000. The pace of layoffs has been on a downtrend as the four-week average was down for the ninth straight week, 3,000 lower at 523,750. Continuing claims are also declining but here the change is likely a negative, due largely to the expiration of benefits. Continuing claims, in data for the October 24 week, fell 68,000 to 5.886 million for the seventh decline in a row.
Jobless Claims Consensus Forecast for 11/7/09: 512,000
Range: 495,000 to 525,000
The U.S. Treasury monthly budget report showed an atypical September deficit totaling $46.6 billion putting the fiscal full-year gap at $1.42 trillion, more than three times the prior year's gap of $454.8 billion. Looking ahead, the month of October typically shows a deficit for the month. Over the past 10 years, the average deficit for the month of October has been $61.7 billion and $89.3 billion over the past 5 years.
Treasury Statement Consensus Forecast for Oct 09: -$150.0 billion
Range: -$180.0 billion to -$115.0 billion.
The U.S. international trade gap narrowed in August as oil imports slipped. The overall U.S. trade gap narrowed to $30.7 billion from a $31.9 billion shortfall in July. In the latest month, exports improved by 0.2 percent while imports declined 0.6 percent. The shrinking of the trade deficit was due to a narrower petroleum shortfall which came in at $16.5 billion compared to $17.8 billion the previous month.
International trade balance Consensus Forecast for September 09: -$32.5 billion
Range: -$34.1 billion to -$29.5 billion
The Reuter's/University of Michigan's Consumer sentiment index for October rose 1.2 points from mid-month to 70.6 but was still down from September’s level of 73.5. Weakness in October was primarily in the expectations index which fell to 68.6 from 73.5 in September. The current conditions index actually edged up to 73.7 in October from 73.4 the prior month.
Consumer sentiment Consensus Forecast for preliminary Nov 09: 71.0
Range: 69.0 to 72.0
R. Mark Rogers is the author of The Complete Idiot’s Guide to Economic Indicators, Penguin Books.
Econoday Senior Writer Mark Pender contributed to this article.
|
