|
Investors were in a perpetual state of edgy vigilance last week as they waited for four central bank announcements and the U.S. employment report. All but the Reserve Bank of Australia indicated that rates would remain low for the foreseeable future. The RBA continued its new cycle of rate increases while the Bank of England raised its asset purchase ceiling to £200 billion and the European Central Bank hinted that they might end their extraordinary measures at the end of the year. And the Federal Reserve laid out its criteria on which their guidance for keeping rates low for an “extended period” is based. The three are low rates of resource utilization (read high unemployment), subdued inflation trends and stable inflation expectations.
U.S. employment dropped more than expected by analysts and the unemployment rate jumped by more than anticipated Friday initially sending the dollar up in value against most major currencies and U.S. and European equities down while gold climbed to a new record high. While the U.S. and several countries in Europe have returned to growth, resources remain underemployed. Inflation is not an issue thanks to weak demand.
All indexes followed here with the exception of the All Ordinaries, Kospi, Nikkei and Topix were up last week. Gains ranged from a low of 0.3 percent (STI) to 5.6 percent (Shanghai Composite).
|
|
2008 |
2009 |
% Change |
|
Index |
Dec 31 |
Oct 30 |
Nov 6 |
Week |
Year |
| Asia |
|
|
|
|
|
|
| Australia |
All Ordinaries |
3659.3 |
4646.9 |
4604.4 |
-0.9% |
25.8% |
| Japan |
Nikkei 225 |
8859.6 |
10034.7 |
9789.4 |
-2.4% |
10.5% |
|
Topix |
859.2 |
894.7 |
874.0 |
-2.3% |
1.7% |
| Hong Kong |
Hang Seng |
14387.5 |
21752.9 |
21829.7 |
0.4% |
51.7% |
| S. Korea |
Kospi |
1124.5 |
1580.7 |
1572.5 |
-0.5% |
39.8% |
| Singapore |
STI |
1761.6 |
2651.1 |
2658.2 |
0.3% |
50.9% |
| China |
Shanghai Composite |
1820.8 |
2995.9 |
3164.0 |
5.6% |
73.8% |
|
|
|
|
|
|
|
| India |
Sensex 30 |
9647.3 |
15896.3 |
16158.3 |
1.6% |
67.5% |
| Indonesia |
Jakarta Composite |
1355.4 |
2367.7 |
2395.1 |
1.2% |
76.7% |
| Malaysia |
KLCI |
876.8 |
1243.2 |
1260.8 |
1.4% |
43.8% |
| Philippines |
PSEi |
1872.9 |
2908.5 |
2931.5 |
0.8% |
56.5% |
| Taiwan |
Taiex |
4591.2 |
7340.1 |
7463.1 |
1.7% |
62.6% |
| Thailand |
SET |
450.0 |
685.2 |
698.6 |
2.0% |
55.3% |
|
|
|
|
|
|
|
| Europe |
|
|
|
|
|
|
| UK |
FTSE 100 |
4434.2 |
5044.55 |
5142.72 |
1.9% |
16.0% |
| France |
CAC |
3218.0 |
3607.69 |
3707.29 |
2.8% |
15.2% |
| Germany |
XETRA DAX |
4810.2 |
5414.96 |
5488.25 |
1.4% |
14.1% |
|
|
|
|
|
|
|
| North America |
|
|
|
|
|
|
| United States |
Dow |
8776.4 |
9712.7 |
10023.42 |
3.2% |
14.2% |
|
NASDAQ |
1577.0 |
2045.1 |
2112.44 |
3.3% |
34.0% |
|
S&P 500 |
903.3 |
1036.2 |
1069.30 |
3.2% |
18.4% |
| Canada |
S&P/TSX Comp. |
8987.7 |
10910.8 |
11250.42 |
3.1% |
25.2% |
| Mexico |
Bolsa |
22380.3 |
28485.4 |
29868.62 |
4.3% |
33.5% |
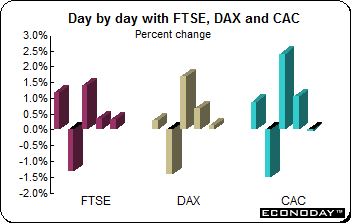 The FTSE, CAC and DAX were up on the week, but not before gyrating between plus and minus on Friday after the U.S. employment situation report. The FTSE and DAX were up four of five days while the CAC was up three. On Friday, all three indexes bounced in concert with U.S. indexes as investors responded to yet another disappointing employment situation report. However, both the FTSE and DAX managed to eke out gains when trading ended for the week as investors were mollified by the prospect that central banks would maintain accommodative policies to support the markets. The FTSE, CAC and DAX were up on the week, but not before gyrating between plus and minus on Friday after the U.S. employment situation report. The FTSE and DAX were up four of five days while the CAC was up three. On Friday, all three indexes bounced in concert with U.S. indexes as investors responded to yet another disappointing employment situation report. However, both the FTSE and DAX managed to eke out gains when trading ended for the week as investors were mollified by the prospect that central banks would maintain accommodative policies to support the markets.
Central bank decisions were front and center with the FOMC announcement on Wednesday after markets here had closed and on Thursday when the Bank of England and European Central Bank made their decisions known within 45 minutes of each other. There was little to surprise investors here. Stocks were boosted by better than expected earnings and encouraging economic news on Thursday.
On the week, the FTSE was up 1.9 percent for its best weekly gain in a month, the DAX gained 1.4 percent while the CAC soared by 2.8 percent. For 2009, the three are up 16.0 percent, 14.1 percent and 15.2 percent respectively.
Bank of England increases asset purchases
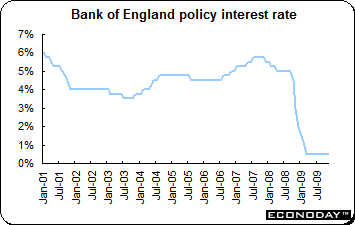 The Bank of England, as universally expected, left its key interest rate at 0.5 percent where it has been since March 5. However, the big question was whether the monetary policy committee would extend its quantitative easing program at this meeting — it was judged to be a close call in light of conflicting economic data. In the end, the Bank added another Stg25 billion of asset purchases bringing the program to a total of Stg200 billion. The initial March Stg75 billion asset purchase program was increased to Stg125 billion in May and again in August to Stg175 billion. All prior asset purchases had been completed before last week’s meeting. The new Stg25 billion of purchases will be spread over a two week period. The Bank of England, as universally expected, left its key interest rate at 0.5 percent where it has been since March 5. However, the big question was whether the monetary policy committee would extend its quantitative easing program at this meeting — it was judged to be a close call in light of conflicting economic data. In the end, the Bank added another Stg25 billion of asset purchases bringing the program to a total of Stg200 billion. The initial March Stg75 billion asset purchase program was increased to Stg125 billion in May and again in August to Stg175 billion. All prior asset purchases had been completed before last week’s meeting. The new Stg25 billion of purchases will be spread over a two week period.
There were two main reasons that analysts were inclined to believe that the Bank was more likely to extend QE —surprisingly weak money supply data and the unexpected contraction in third quarter GDP. The UK is now the world's largest economy to remain in recession after shocking virtually everyone with a decline in the third quarter. However, according to the MPC, a number of spending and confidence indicators suggest that a pickup in economic activity may be imminent. Loose monetary and fiscal policies continue to offer the prospect of substantial stimulus to growth while the weak currency should improve the competitiveness of UK producers. The Bank publishes its quarterly Inflation Report this Wednesday.
ECB hints at end of unconventional easing
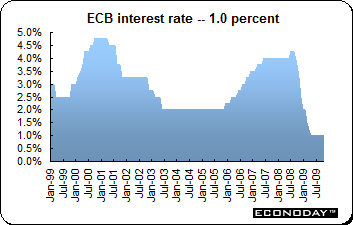 As expected the European Central Bank governing council left its key interest rate unchanged at 1 percent, where it has been since May. It also said that it would leave the deposit rate at 0.25 percent and the marginal lending rate at 1.75 percent. Data and survey evidence released since the last meeting appear to support a brighter view of the economy and have reinforced expectations that the EMU emerged from recession in the third quarter (we will find out on November 13). But the ECB appears to be intent on maintaining a wait and see approach given the ongoing fragility of the situation. Many analysts expect that the ECB will begin to exit its unconventional policy first with a rate increase sometime in the second half of 2010. As expected the European Central Bank governing council left its key interest rate unchanged at 1 percent, where it has been since May. It also said that it would leave the deposit rate at 0.25 percent and the marginal lending rate at 1.75 percent. Data and survey evidence released since the last meeting appear to support a brighter view of the economy and have reinforced expectations that the EMU emerged from recession in the third quarter (we will find out on November 13). But the ECB appears to be intent on maintaining a wait and see approach given the ongoing fragility of the situation. Many analysts expect that the ECB will begin to exit its unconventional policy first with a rate increase sometime in the second half of 2010.
However the ECB is preparing to take decisions in December on the future of the emergency liquidity operations it launched after last year’s collapse of Lehman Brothers. Although the ECB believes economic growth will remain weak and sees inflation pressures as subdued, it views financial markets as having returned to more normal conditions — and fears banks may have become overly dependent on its emergency measures. Central to its “enhanced credit support” strategy has been offers of unlimited one-year loans to banks.
At his post-meeting press conference ECB President Jean Claude Trichet signaled that the offer of unlimited emergency one-year liquidity planned for December could possibly be the last. Allowing one-year lending to expire after the operation scheduled for December 16 would be a step toward weaning banks off the funds which have pushed money market rates to record lows and helped rekindle credit flows. Asked whether the ECB was ready to drop these operations, Trichet noted that financial markets were not expecting the ECB to announce more one-year operations next year. He said that he would say nothing to dispel market sentiment. He said that the decision will be taken by the governing council at the December meeting. Trichet stressed that the ECB's liquidity steps — including lending banks unlimited funds at fixed rates — would be phased out in a gradual but timely way, but would not continue at the same extent as in the past.
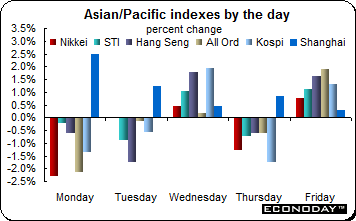 Most Asian/Pacific equity indexes followed here were up last week with the exception of the Nikkei, Topix, Kospi and All Ordinaries. The indexes once again are following those in the U.S. However, the Reserve Bank of Australia’s sharp upward revision in its economic growth forecast gave stocks there a boost on Friday, but not enough to wipe out the All Ordinaries’ losses incurred earlier in the week — it was down 0.9 percent on the week. And Thursday’s better-than-expected U.S. jobless claims and productivity reports appear to have eased some concerns about the pace of global economic recovery. Asian markets are closed before the release of Friday’s employment report. Both the Nikkei and Topix were the big losers, down 2.4 percent and 2.3 percent respectively. The Kospi was down 0.5 percent. Gains ranged from 5.6 percent for the Shanghai Composite to 0.3 percent for the STI. The Shanghai index benefitted from reports about a proposed Disney theme park in Shanghai. Most Asian/Pacific equity indexes followed here were up last week with the exception of the Nikkei, Topix, Kospi and All Ordinaries. The indexes once again are following those in the U.S. However, the Reserve Bank of Australia’s sharp upward revision in its economic growth forecast gave stocks there a boost on Friday, but not enough to wipe out the All Ordinaries’ losses incurred earlier in the week — it was down 0.9 percent on the week. And Thursday’s better-than-expected U.S. jobless claims and productivity reports appear to have eased some concerns about the pace of global economic recovery. Asian markets are closed before the release of Friday’s employment report. Both the Nikkei and Topix were the big losers, down 2.4 percent and 2.3 percent respectively. The Kospi was down 0.5 percent. Gains ranged from 5.6 percent for the Shanghai Composite to 0.3 percent for the STI. The Shanghai index benefitted from reports about a proposed Disney theme park in Shanghai.
Indonesian stocks were up after Bank Indonesia kept interest rates at a record low of 6.5 percent and signaled that it was in no hurry to begin tightening. The Bank appears to think that consumer price gains going forward would be in its inflation target range of 3 percent to 5 percent. But analysts expect that the country’s recovery will remain strong in 2010 and that inflation will rise more rapidly than anticipated.
Reserve Bank of Australia
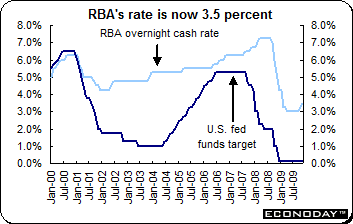 As expected, the Reserve Bank of Australia increased its benchmark interest rate for the second consecutive month by 25 basis points to 3.5 percent as the economy continues to strengthen. The RBA was the first central bank in the Group of 20 countries to increase rates. The only other countries to increase rates thus far are Israel and Norway. India moved to tighten monetary policy by increasing commercial bank capital requirements but left its repo rate unchanged at 4.75 percent. As expected, the Reserve Bank of Australia increased its benchmark interest rate for the second consecutive month by 25 basis points to 3.5 percent as the economy continues to strengthen. The RBA was the first central bank in the Group of 20 countries to increase rates. The only other countries to increase rates thus far are Israel and Norway. India moved to tighten monetary policy by increasing commercial bank capital requirements but left its repo rate unchanged at 4.75 percent.
Aggressive government cash handouts, firm consumer confidence and firm house prices have helped to prevent recession in the country which recorded only one quarter of contraction. Chinese demand for the country’s resources also helped keep the economy afloat. And the Australian dollar’s gain of about 29 percent in 2009 is helping contain domestic inflationary pressures. Asset prices are rising as illustrated by housing prices which jumped 4.2 percent in the quarter ending in September. The All Ordinaries is up about 26 percent in 2009.
The RBA has an inflation target range between 2 percent and 3 percent. Third quarter CPI was up a relatively benign 1.3 percent on the year. In its statement, the Bank noted that growth would likely be near trend in the coming year. The statement also said that the rising exchange rate was hurting the trade sector. The RBA will be publishing its revised growth estimates later this week.
In raising rates, the RBA said the global economy had resumed growth and the recovery looked set to continue next year but that the expansion was expected to be modest in the major countries. However, prospects for Australia’s Asian trading partners are noticeably better. The two rate increases would boost the “sustainability” of economic growth and “keep inflation consistent with the target over the years ahead”.
In the quarterly economic statement, the RBA sounded optimistic about the country’s recovery saying that both business investment and export growth are expected to be strong given that they are underpinned by an ongoing expansion in the resources sector and a bounce back in Asian economies and especially China. While raising its growth forecast, the Bank also hinted that more interest rate increases are in its future. According to the RBA forecast, gross domestic product is expected to expand by 1.75 percent in year average terms by the end of calendar 2009, compared to its August forecast of only 0.5 percent. Growth is expected to rise to 2.25 percent over the year to the end of June 2010 and to 3.25 percent by the end of 2010. Previously it was looking for growth of 1 percent and 2.25 percent respectively. The RBA thinks inflation is likely to moderate over the year ahead as the lagged effects of the recent economic slowdown and the appreciation of the Australian dollar exchange rate, which has made imported goods cheaper, works through the economy.
 The dollar bounced around on Friday thanks to expectations and then the reality of the employment report. However, the dollar was once again pushed lower on the week because of earlier positive data relaxing the need for a safe haven. Traders were perhaps more conservative during the week as they awaited the outcomes of the various central bank policy meetings that were held during the week. The dollar bounced around on Friday thanks to expectations and then the reality of the employment report. However, the dollar was once again pushed lower on the week because of earlier positive data relaxing the need for a safe haven. Traders were perhaps more conservative during the week as they awaited the outcomes of the various central bank policy meetings that were held during the week.
On Tuesday, the dollar hit a one month high against the euro as equities sank, giving rise to haven demand. This reversed on Wednesday as the dollar dropped the most against the euro in two months after the FOMC reiterated its pledge to keep borrowing costs near zero. The Fed restated its intention to keep interest rates ”exceptionally low” for “an extended period” as long as inflation expectations are stable and unemployment fails to decline. Analysts opined that by leaving the extended period reference in its statement, it could lead to further weakness for the dollar.
Investors have been jittery as they contemplate the sustainability of the recent rally in risky assets including high-yielding currencies given the potential withdrawal of monetary accommodation by central banks.
On the week, the dollar was down against all currencies tracked here including the euro, pound sterling and the Canadian and Australian dollars.
Selected currencies — weekly results
|
|
2008 |
2009 |
% change |
|
|
Dec 31 |
Oct 30 |
Nov 6 |
Week |
2009 |
| U.S. $ per currency |
|
|
|
|
|
|
| Australia |
A$ |
0.711 |
0.900 |
0.918 |
2.0% |
29.1% |
| New Zealand |
NZ$ |
0.587 |
0.717 |
0.725 |
1.1% |
23.4% |
| Canada |
C$ |
0.822 |
0.924 |
0.930 |
0.6% |
13.2% |
| Eurozone |
euro (€) |
1.397 |
1.471 |
1.485 |
0.9% |
6.3% |
| UK |
pound sterling (£) |
1.459 |
1.641 |
1.661 |
1.2% |
13.9% |
|
|
|
|
|
|
|
| Currency per U.S. $ |
|
|
|
|
|
|
| China |
yuan |
6.826 |
6.828 |
6.827 |
0.0% |
0.0% |
| Hong Kong |
HK$* |
7.750 |
7.750 |
7.750 |
0.0% |
0.0% |
| India |
rupee |
48.675 |
46.975 |
46.815 |
0.3% |
4.0% |
| Japan |
yen |
90.740 |
89.987 |
89.936 |
0.1% |
0.9% |
| Malaysia |
ringgit |
3.453 |
3.413 |
3.400 |
0.4% |
1.5% |
| Singapore |
Singapore $ |
1.433 |
1.402 |
1.393 |
0.6% |
2.9% |
| South Korea |
won |
1259.550 |
1182.050 |
1167.450 |
1.3% |
7.9% |
| Taiwan |
Taiwan $ |
32.820 |
32.525 |
32.499 |
0.1% |
1.0% |
| Thailand |
baht |
34.753 |
33.440 |
33.350 |
0.3% |
4.2% |
| Switzerland |
Swiss franc |
1.066 |
1.026 |
1.017 |
0.8% |
4.8% |
| *Pegged to U.S. dollar |
|
|
|
|
|
|
| Source: Bloomberg |
|
|
|
|
|
|
 October Markit purchasing managers index climbed to 50.7 from 49.3 in the previous month and above the key 50 growth threshold. The improvement reflected the third consecutive increase in manufacturing output which posted its fastest growth rate in nearly two years. Orders similarly performed well and produced their best reading since August 2007. In a surprise given the rise of the Euro, export orders produced their largest gain since January 2008. At the same time, the ratio of new orders to finished goods inventories hit nearly a 10-year high. This suggests that with stock levels so low, output will have to rise further over coming months to meet demand already in the pipeline. Despite signs of a pick-up in real demand, price pressures remain very subdued. Heavy discounting was once again prominent last month although prices charged fell at their slowest pace in some 10 months. October Markit purchasing managers index climbed to 50.7 from 49.3 in the previous month and above the key 50 growth threshold. The improvement reflected the third consecutive increase in manufacturing output which posted its fastest growth rate in nearly two years. Orders similarly performed well and produced their best reading since August 2007. In a surprise given the rise of the Euro, export orders produced their largest gain since January 2008. At the same time, the ratio of new orders to finished goods inventories hit nearly a 10-year high. This suggests that with stock levels so low, output will have to rise further over coming months to meet demand already in the pipeline. Despite signs of a pick-up in real demand, price pressures remain very subdued. Heavy discounting was once again prominent last month although prices charged fell at their slowest pace in some 10 months.
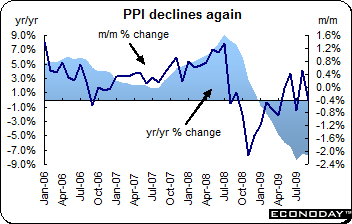 September producer prices (excluding construction) dropped 0.4 percent and sank 7.7 percent when compared with the same month a year ago. Weakness was mainly the result of a fresh drop in energy costs which were down 1.9 percent from August and 17.6 percent from a year ago. There was also a modest 0.1 percent decline in the price of capital goods, durable consumer goods and nondurable consumer goods. The only major sector where prices did not decline was intermediates which posted a 0.2 percent gain. As a result, core prices were unchanged on the month and 4.3 percent lower on the year. All of the larger EMU states saw their respective PPI's fall on the month. Germany (0.5 percent) was the weakest ahead of Spain (0.4 percent), and France and Italy (both 0.3 percent). September producer prices (excluding construction) dropped 0.4 percent and sank 7.7 percent when compared with the same month a year ago. Weakness was mainly the result of a fresh drop in energy costs which were down 1.9 percent from August and 17.6 percent from a year ago. There was also a modest 0.1 percent decline in the price of capital goods, durable consumer goods and nondurable consumer goods. The only major sector where prices did not decline was intermediates which posted a 0.2 percent gain. As a result, core prices were unchanged on the month and 4.3 percent lower on the year. All of the larger EMU states saw their respective PPI's fall on the month. Germany (0.5 percent) was the weakest ahead of Spain (0.4 percent), and France and Italy (both 0.3 percent).
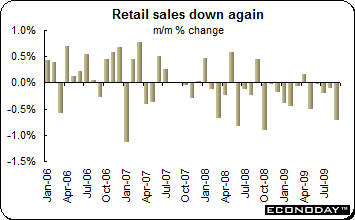 September retail sales slumped 0.7 percent and sank 3.6 percent below their year ago level. For the third quarter, sales dropped a very disappointing 0.7 percent following a 0.3 percent slide in the previous period. The latest decline means that purchases have contracted for five consecutive. The September drop was led by the food sector where volumes fell 0.9 percent after a 0.7 percent increase last time. Non-food sales were off 0.6 percent, compounding the 0.2 percent and 0.4 percent drops seen in July and August respectively. Among those states supplying data, weakness was relatively widespread. Volumes slid 0.5 percent in Germany, 1.0 percent in Spain, 2.0 percent in Portugal and 1.2 percent in Slovenia. Austria (up 2.5 percent) and Slovakia (up 1.1 percent) were the only EMU members to record substantive increases. September retail sales slumped 0.7 percent and sank 3.6 percent below their year ago level. For the third quarter, sales dropped a very disappointing 0.7 percent following a 0.3 percent slide in the previous period. The latest decline means that purchases have contracted for five consecutive. The September drop was led by the food sector where volumes fell 0.9 percent after a 0.7 percent increase last time. Non-food sales were off 0.6 percent, compounding the 0.2 percent and 0.4 percent drops seen in July and August respectively. Among those states supplying data, weakness was relatively widespread. Volumes slid 0.5 percent in Germany, 1.0 percent in Spain, 2.0 percent in Portugal and 1.2 percent in Slovenia. Austria (up 2.5 percent) and Slovakia (up 1.1 percent) were the only EMU members to record substantive increases.
 September manufacturing orders were up 0.9 percent but remained 13.1 percent below the same month a year ago. Export orders jumped 3.7 percent while domestic orders dropped 2.3 percent. Within domestic orders, both basic goods (up 2.1 percent) and consumer goods (up 6.2 percent) advanced strongly but their gains were more than offset by a 7.9 percent slump in capital goods. Overseas demand was led by a 6.0 percent monthly increase from other EMU states. Orders for consumer goods surged 14.2 percent while consumer goods jumped 12.7 percent. Orders from outside the EMU were up 2.2 percent. September manufacturing orders were up 0.9 percent but remained 13.1 percent below the same month a year ago. Export orders jumped 3.7 percent while domestic orders dropped 2.3 percent. Within domestic orders, both basic goods (up 2.1 percent) and consumer goods (up 6.2 percent) advanced strongly but their gains were more than offset by a 7.9 percent slump in capital goods. Overseas demand was led by a 6.0 percent monthly increase from other EMU states. Orders for consumer goods surged 14.2 percent while consumer goods jumped 12.7 percent. Orders from outside the EMU were up 2.2 percent.
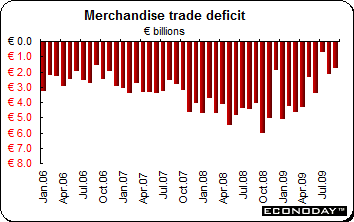 September merchandise trade deficit narrowed sharply to €1.8 billion from a smaller revised August shortfall of €2.2 billion. Apart from July (€718 billion), the latest gap was the smallest seen since September 2006. The improvement in September helped to narrow the cumulative red ink over the first three quarters of the year to €28.8 billion from €40.6 billion during the same period of 2008. In September, exports were up 2.2 percent monthly while imports were up a more modest 0.7 percent. September merchandise trade deficit narrowed sharply to €1.8 billion from a smaller revised August shortfall of €2.2 billion. Apart from July (€718 billion), the latest gap was the smallest seen since September 2006. The improvement in September helped to narrow the cumulative red ink over the first three quarters of the year to €28.8 billion from €40.6 billion during the same period of 2008. In September, exports were up 2.2 percent monthly while imports were up a more modest 0.7 percent.
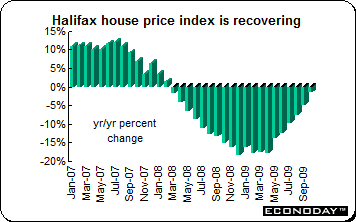 October Halifax house price index was up 1.2 percent. This was the fourth consecutive monthly climb. However, the three month moving average was up 2.9 percent when compared with the previous three month but was down 4.7 percent when compared with the same months a year ago. The moving average continues to steadily improve after reaching its nadir in April when the moving average was down 17.7 percent. According to Halifax, housing supply has been scarce but "there are some indications that more people are deciding to put their homes on the market, encouraged by the recent improvement in market conditions." October Halifax house price index was up 1.2 percent. This was the fourth consecutive monthly climb. However, the three month moving average was up 2.9 percent when compared with the previous three month but was down 4.7 percent when compared with the same months a year ago. The moving average continues to steadily improve after reaching its nadir in April when the moving average was down 17.7 percent. According to Halifax, housing supply has been scarce but "there are some indications that more people are deciding to put their homes on the market, encouraged by the recent improvement in market conditions."
 September industrial production was up 1.6 percent after sinking 2.6 percent in August. Industrial output was down 10.3 percent on the year and contracted 0.8 percent in the third quarter. Manufacturing output jumped a solid 1.7 percent (but remained 9.3 percent below a year ago) while production in the more erratic oil & gas sector was up 1.7 percent matching the increase in mining & quarrying. The only decline was in utilities (down 0.3 percent). Overall durable goods production climbed a sharp 5.4 percent on the month while nondurables were up 1.0 percent. Manufacturing gains were quite broad-based with 10 of the 13 sub-sectors raising output over August. Especially strong increases were posted in electrical & optical equipment (8.0 percent), transportation equipment (3.0 percent) and in the other sector category (4.2 percent). At the same time the most significant monthly decline was seen in machinery & equipment (1.0 percent). September industrial production was up 1.6 percent after sinking 2.6 percent in August. Industrial output was down 10.3 percent on the year and contracted 0.8 percent in the third quarter. Manufacturing output jumped a solid 1.7 percent (but remained 9.3 percent below a year ago) while production in the more erratic oil & gas sector was up 1.7 percent matching the increase in mining & quarrying. The only decline was in utilities (down 0.3 percent). Overall durable goods production climbed a sharp 5.4 percent on the month while nondurables were up 1.0 percent. Manufacturing gains were quite broad-based with 10 of the 13 sub-sectors raising output over August. Especially strong increases were posted in electrical & optical equipment (8.0 percent), transportation equipment (3.0 percent) and in the other sector category (4.2 percent). At the same time the most significant monthly decline was seen in machinery & equipment (1.0 percent).
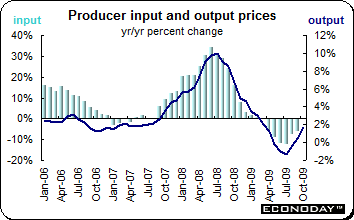 October producer output prices edged up 0.2 percent and were up 1.7 percent when compared with last year. Core output prices excluding food, drink, tobacco & gasoline were up 0.3 percent and 2.0 percent on the year. The largest contribution to the monthly change in the headline index came from the electrical & optical sector prices which spiked 1.4 percent. Other increases were seen in transport (0.6 percent), petroleum products (0.5 percent), tobacco & alcohol (0.5 percent) and paper (0.4 percent). The only monthly price declines were recorded in food (0.3 percent) and chemical products (0.4 percent). Producer input prices jumped by 2.6 percent and edged up 0.1 percent on the year. The main drivers to the jump were crude oil & fuel which posted monthly gains of 6.8 percent and 4.4 percent respectively. However, there were also significant increases in all of the import sectors including chemicals (1.7 percent), parts & equipment (1.5 percent), food materials (1.4 percent) and metals (1.4 percent). Other home produced materials prices were up just 0.4 percent. October producer output prices edged up 0.2 percent and were up 1.7 percent when compared with last year. Core output prices excluding food, drink, tobacco & gasoline were up 0.3 percent and 2.0 percent on the year. The largest contribution to the monthly change in the headline index came from the electrical & optical sector prices which spiked 1.4 percent. Other increases were seen in transport (0.6 percent), petroleum products (0.5 percent), tobacco & alcohol (0.5 percent) and paper (0.4 percent). The only monthly price declines were recorded in food (0.3 percent) and chemical products (0.4 percent). Producer input prices jumped by 2.6 percent and edged up 0.1 percent on the year. The main drivers to the jump were crude oil & fuel which posted monthly gains of 6.8 percent and 4.4 percent respectively. However, there were also significant increases in all of the import sectors including chemicals (1.7 percent), parts & equipment (1.5 percent), food materials (1.4 percent) and metals (1.4 percent). Other home produced materials prices were up just 0.4 percent.
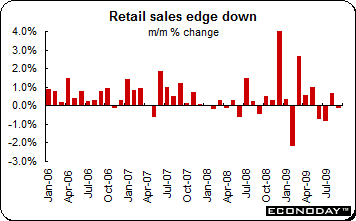 September retail sales dropped 0.2 percent on the month. On the year, sales were up 6.0 percent. Sales were down 2.9 percent for department stores while clothing, footwear & other personal accessory retailing was down 0.8 percent. Household goods dropped 0.7 percent on the month. However, Australians are still enjoying eating out with sales rising by 1 percent for cafes, restaurants & takeaway food services. The government had boosted spending during the crisis with handouts to consumers. Clearly, the impact of those handouts is waning and as a result sales are slipping. Retail turnover in volume terms fell 0.4 percent for the September 2009 quarter, compared with an increase of 1.9 percent in the June Quarter. September retail sales dropped 0.2 percent on the month. On the year, sales were up 6.0 percent. Sales were down 2.9 percent for department stores while clothing, footwear & other personal accessory retailing was down 0.8 percent. Household goods dropped 0.7 percent on the month. However, Australians are still enjoying eating out with sales rising by 1 percent for cafes, restaurants & takeaway food services. The government had boosted spending during the crisis with handouts to consumers. Clearly, the impact of those handouts is waning and as a result sales are slipping. Retail turnover in volume terms fell 0.4 percent for the September 2009 quarter, compared with an increase of 1.9 percent in the June Quarter.
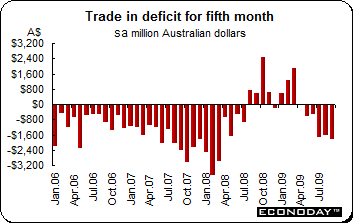 September merchandise trade deficit swelled to A$1,850 million from A$1,524 million in August. Both exports and imports were up on the month. Exports were up 4.6 percent but imports were up more, increasing by 5.2 percent. Non-monetary gold exports were up 64 percent while non-rural goods were up 2 percent and rural goods were down 4 percent. Services exports gained 3.0 percent. Imports of intermediate and other merchandise goods were up 10 percent while non-monetary gold was up 33 percent. Both consumption goods and capital good gained 2 percent while services edged up 1 percent. September merchandise trade deficit swelled to A$1,850 million from A$1,524 million in August. Both exports and imports were up on the month. Exports were up 4.6 percent but imports were up more, increasing by 5.2 percent. Non-monetary gold exports were up 64 percent while non-rural goods were up 2 percent and rural goods were down 4 percent. Services exports gained 3.0 percent. Imports of intermediate and other merchandise goods were up 10 percent while non-monetary gold was up 33 percent. Both consumption goods and capital good gained 2 percent while services edged up 1 percent.
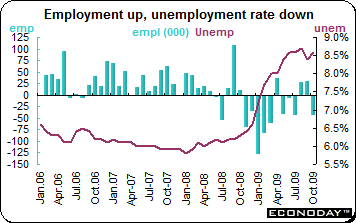 October employment dropped a hefty 43,200 while the unemployment rate jumped to 8.6 percent from 8.4 percent in September. The employment decline was due to a 59,700 job drop in part time employment while full time employment actually was up 16,500. Payrolls suffered most in services which saw a 37,000 drop led by a 30,800 decline in retail. The only other decline of any real note was in the other services area (19,900) although there were minor dips in business, building & other support services (6,800), information, culture & recreation (6,400) and finance, insurance, real estate & leasing (3,100). However, there was a sizeable gain in transportation & warehousing (22,200) and smaller advances in education services (8,100) and health care & social assistance (8,300). The goods producing sector saw its payroll contract by 6,300 within which manufacturing contracted by 8,200. Natural resources were down 11,300 but construction once again benefitted from the recovery in housing with an 11,200 advance. The number of unemployed was up by 37,700 to 1,587,400. The participation rate edged 0.1 percentage points lower to 67.0 percent while the employment rate dropped twice as much to 61.2 percent. October employment dropped a hefty 43,200 while the unemployment rate jumped to 8.6 percent from 8.4 percent in September. The employment decline was due to a 59,700 job drop in part time employment while full time employment actually was up 16,500. Payrolls suffered most in services which saw a 37,000 drop led by a 30,800 decline in retail. The only other decline of any real note was in the other services area (19,900) although there were minor dips in business, building & other support services (6,800), information, culture & recreation (6,400) and finance, insurance, real estate & leasing (3,100). However, there was a sizeable gain in transportation & warehousing (22,200) and smaller advances in education services (8,100) and health care & social assistance (8,300). The goods producing sector saw its payroll contract by 6,300 within which manufacturing contracted by 8,200. Natural resources were down 11,300 but construction once again benefitted from the recovery in housing with an 11,200 advance. The number of unemployed was up by 37,700 to 1,587,400. The participation rate edged 0.1 percentage points lower to 67.0 percent while the employment rate dropped twice as much to 61.2 percent.
Investors were vigilant last week as four central banks met and delivered their policy decisions and gave their (very cautious) opinions on the state of their various economies. Only the Reserve Bank of Australia was bullish enough to increase their interest rate for the second month.
This week offers the long awaited view of third quarter gross domestic product growth across the eurozone. And in the UK, analysts will get a look at the Bank of England’s November Inflation Report and get a chance to second guess the Bank based on their forecasts. The latest labor force data will also be available on Wednesday. And employment data will also be available for Australia on Thursday (local time).
| Central Bank activities |
|
| November 11 |
UK |
Bank of England Quarterly Inflation Report |
|
|
|
| The following indicators will be released this week... |
| Europe |
|
|
| November 9 |
Germany |
Merchandise Trade (September) |
|
|
Industrial Production (September) |
| November 10 |
Germany |
ZEW Survey (November) |
|
France |
Industrial Production (September) |
|
Italy |
Industrial Production (September) |
|
UK |
Merchandise Trade (September) |
| November 11 |
UK |
Labour Market Report (October) |
| November 12 |
EMU |
Industrial Production (September) |
| November 13 |
EMU |
Gross Domestic Product (Q3.09 flash) |
|
Germany |
Gross Domestic Product (Q3.09 flash) |
|
France |
Gross Domestic Product (Q3.09 flash) |
|
Italy |
Gross Domestic Product (Q3.09 flash) |
|
|
|
| Asia/Pacific |
|
|
| November 12 |
Australia |
Employment (October) |
|
Japan |
Corporate Goods Price Index (October) |
|
|
|
| Americas |
|
|
| November 13 |
Canada |
International Trade (September) |
Anne D Picker is the author of International Economic Indicators and Central Banks.
|
