|
Economic data continue to paint a mixed picture — sentiment indexes have taken a step back as consumers pause to reflect while production indexes continue to show the hesitancy of producers to move forward. However there was enough good news to revive some wilting green shoots. In the U.S., improving jobless claims have been distorted by plant closings which took place at times unexpected by the related seasonal adjustments. This week’s earnings reports were also mixed but with several pleasant surprises.
Behind this week’s performance have been encouraging signs that the U.S. financial sector is bouncing back to health after better than expected reports from JPMorgan Chase and Goldman Sachs. However, the good news was partially offset by GE’s earnings report and the dire straits that the financial firm CIT finds itself in. The company lends to small and medium-sized businesses and may face bankruptcy after bail-out talks with government stalled.
Resource stocks, a big component of several of the indexes followed here, recovered from recent steep declines thanks mainly to the slew of positive data from China, one of the world’s biggest consumers of oil and industrial metals. The country said annual gross domestic product had risen to 7.9 percent in the second quarter, up from 6.1 in the first. And June industrial production gained 10.7 percent on the year, its largest increase in nine months.
However, data from Russia was the antithesis of China’s. The Russian economy contracted by 10.1 percent in the first half of this year — its worst decline since the early 1990s. The credit crunch combined with plummeting commodity prices and a gradual rouble devaluation shattered 10 years of rapid growth. However, there are signs that the pace of economic decline is slowing. Industrial production contracted 12.1 percent on the year — the slowest in six months.
|
|
2008 |
2009 |
% Change |
|
Index |
Dec 31 |
Jul 10 |
Jul 17 |
Week |
Year |
| Asia |
|
|
|
|
|
|
| Australia |
All Ordinaries |
3659.3 |
3790.60 |
3992.90 |
5.3% |
9.1% |
| Japan |
Nikkei 225 |
8859.6 |
9287.28 |
9395.32 |
1.2% |
6.0% |
|
Topix |
859.2 |
872.5 |
878.29 |
0.7% |
2.2% |
| Hong Kong |
Hang Seng |
14387.5 |
17708.42 |
18805.66 |
6.2% |
30.7% |
| S. Korea |
Kospi |
1124.5 |
1428.62 |
1440.10 |
0.8% |
28.1% |
| Singapore |
STI |
1761.6 |
2307.98 |
2430.96 |
5.3% |
38.0% |
| China |
Shanghai Composite |
1820.8 |
3113.93 |
3189.74 |
2.4% |
75.2% |
|
|
|
|
|
|
|
| India |
Sensex 30 |
9647.3 |
13504.22 |
14744.92 |
9.2% |
52.8% |
| Indonesia |
Jakarta Composite |
1355.4 |
2063.09 |
2106.35 |
2.1% |
55.4% |
| Malaysia |
KLSE Composite |
876.8 |
1067.76 |
1120.90 |
5.0% |
27.8% |
| Philippines |
PSEi |
1872.9 |
2487.22 |
2553.96 |
2.7% |
36.4% |
| Taiwan |
Taiex |
4591.2 |
6769.86 |
6850.99 |
1.2% |
49.2% |
| Thailand |
SET |
450.0 |
566.03 |
596.11 |
5.3% |
32.5% |
|
|
|
|
|
|
|
| Europe |
|
|
|
|
|
|
| UK |
FTSE 100 |
4434.2 |
4127.17 |
4388.75 |
6.3% |
-1.0% |
| France |
CAC |
3218.0 |
2983.10 |
3218.46 |
7.9% |
0.0% |
| Germany |
XETRA DAX |
4810.2 |
4576.31 |
4978.40 |
8.8% |
3.5% |
|
|
|
|
|
|
|
| North America |
|
|
|
|
|
|
| United States |
Dow |
8776.4 |
8146.52 |
8743.94 |
7.3% |
-0.4% |
|
NASDAQ |
1577.0 |
1756.03 |
1886.61 |
7.4% |
19.6% |
|
S&P 500 |
903.3 |
879.13 |
940.38 |
7.0% |
4.1% |
| Canada |
S&P/TSX Comp. |
8987.7 |
9747.13 |
10369.42 |
6.4% |
15.4% |
| Mexico |
Bolsa |
22380.3 |
23656.26 |
25741.96 |
8.8% |
15.0% |
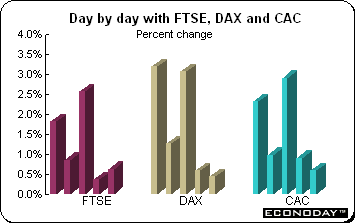 The FTSE, CAC and DAX were up each day last week and in the process, put a sizable dent into the losses that have occurred over the past month. All three indexes recorded impressive gains. The DAX jumped 8.8 percent, the CAC soared by 7.9 percent and the FTSE gained 6.3 percent. Both the DAX and CAC have regained a toehold above their 2008 year end levels. The FTSE remains 1 percent below it. The main boost to equities reflected a combination of better than anticipated earnings in the financial sector (JPMorgan Chase and Goldman Sachs) along with U.S. housing starts data and Chinese GDP. And technology stocks were lifted by Intel and IBM second quarter results as well. The FTSE, CAC and DAX were up each day last week and in the process, put a sizable dent into the losses that have occurred over the past month. All three indexes recorded impressive gains. The DAX jumped 8.8 percent, the CAC soared by 7.9 percent and the FTSE gained 6.3 percent. Both the DAX and CAC have regained a toehold above their 2008 year end levels. The FTSE remains 1 percent below it. The main boost to equities reflected a combination of better than anticipated earnings in the financial sector (JPMorgan Chase and Goldman Sachs) along with U.S. housing starts data and Chinese GDP. And technology stocks were lifted by Intel and IBM second quarter results as well.
There was little economic news this week in Europe. German investor sentiment unexpectedly eroded in July. The ZEW index of investor expectations retreated — however, this move must be put into perspective. The index had gained for eight consecutive months and had pushed the index reading up about 100 points. The current conditions reading inched up but remains at a very low level. However in the UK, consumer prices, which had been sticky, finally declined below the Bank of England’s 2 percent inflation target while unemployment continued to rise.
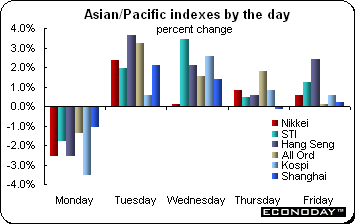 All Asian/Pacific equity indexes were up last week with commodity and shipping stocks advancing broadly on hopes of an economic recovery. Only Indonesian stocks ended the week on a sour note after deadly bomb blasts at two luxury Jakarta hotels. Losses were pared during the day as investors remained optimistic about the country's economic and political prospects. All Asian/Pacific equity indexes were up last week with commodity and shipping stocks advancing broadly on hopes of an economic recovery. Only Indonesian stocks ended the week on a sour note after deadly bomb blasts at two luxury Jakarta hotels. Losses were pared during the day as investors remained optimistic about the country's economic and political prospects.
The Sensex and Hang Seng were the week’s best performers gaining 9.2 percent and 6.2 percent respectively. However, both the All Ordinaries and SET were not far behind, increasing 5.3 percent on the week. Analysts said that the positive tone in these markets probably reflected anticipated earnings growth next year. The Shanghai Composite gained 2.4 percent on the week in the wake of strong economic data and closed at its highest level for 13 months. Many analysts worry about a bubble in the stock market — the index is up 75.2 percent in 2009 after sinking 65.4 percent in 2008.
China’s growth accelerates
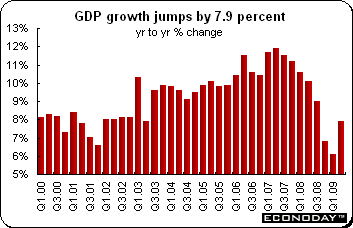 Second quarter gross domestic product growth accelerated to an annual rate of 7.9 percent. Investment, industrial production and retail sales all contributed to the higher output. The speed of the Chinese recovery, without an accompanying boost in demand from North America and Europe, has surprised. But the Chinese government’s mass injection of money into the economy has also pumped air back into the asset price bubbles in the domestic property and stock markets. And the country’s accelerating growth has lifted prices of commodities such as iron ore and copper and in turn, has boosted economic output of raw materials from exporters such as Australia and Brazil. Government incentives for consumption such as car and white goods rebates helped support retail spending, which expanded 15 percent in the first six months of the year. Second quarter gross domestic product growth accelerated to an annual rate of 7.9 percent. Investment, industrial production and retail sales all contributed to the higher output. The speed of the Chinese recovery, without an accompanying boost in demand from North America and Europe, has surprised. But the Chinese government’s mass injection of money into the economy has also pumped air back into the asset price bubbles in the domestic property and stock markets. And the country’s accelerating growth has lifted prices of commodities such as iron ore and copper and in turn, has boosted economic output of raw materials from exporters such as Australia and Brazil. Government incentives for consumption such as car and white goods rebates helped support retail spending, which expanded 15 percent in the first six months of the year.
But some analysts remain skeptical about China’s statistics, questioning whether the government is releasing overly rosy figures and masking serious troubles in the economy. Analysts also point to weak electricity consumption figures and a sharp drop in foreign investment as indications that growth may not be as strong as reported in official data. But many insist there are more signs of strength than of weakness, and that record bank lending is filtering through the economy and helping drive growth.
Bank of Japan extends QE programs
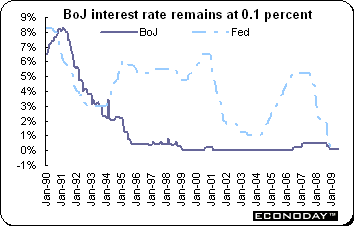 As expected, the Bank of Japan left its key interest rate at 0.1 percent — it has now been at this level since December 2008. In addition to leaving its interest rate unchanged, the BoJ has taken an assortment of unconventional steps against the financial crisis. These include buying corporate bonds, commercial paper and other securities and providing unlimited funds to financial institutions through open-market operations. Policy makers also offered unlimited three-month loans to commercial banks at 0.1 percent in exchange for approved collateral. All of the programs which were scheduled to end on September 30 were extended to December 31, 2009. As expected, the Bank of Japan left its key interest rate at 0.1 percent — it has now been at this level since December 2008. In addition to leaving its interest rate unchanged, the BoJ has taken an assortment of unconventional steps against the financial crisis. These include buying corporate bonds, commercial paper and other securities and providing unlimited funds to financial institutions through open-market operations. Policy makers also offered unlimited three-month loans to commercial banks at 0.1 percent in exchange for approved collateral. All of the programs which were scheduled to end on September 30 were extended to December 31, 2009.
The economy has declined for four consecutive quarters. However, since the end of the first quarter, economic data have improved. For example, industrial production has risen for three months — but output is steeply below that of last year. The worst also seems over for exports although they too are still much below year ago levels. The Bank said that the economy is showing clearer evidence of leveling out and expects recovery in the second half of fiscal year 2009 which ends March 31, 2010.
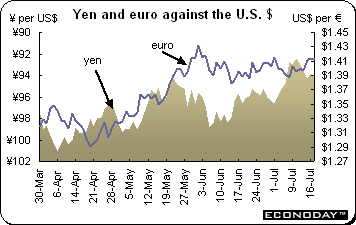 The euro was up against the U.S. dollar but the yen retreated as investors remained cautious but less risk averse. Typically when investors are more open to taking on risk, the yen declines and the euro increases in value against the dollar. Better than expected U.S. corporate earnings and improving economic data boosted investor confidence. Forecast beating second quarter earnings from Goldman Sachs and Intel prompted a sharp rally in global equities. Growing risk appetite fed through to the currency markets, weighing on safe-haven demand for the yen and the dollar, and boosting higher yielding currencies, especially those with commodity links. The euro was up against the U.S. dollar but the yen retreated as investors remained cautious but less risk averse. Typically when investors are more open to taking on risk, the yen declines and the euro increases in value against the dollar. Better than expected U.S. corporate earnings and improving economic data boosted investor confidence. Forecast beating second quarter earnings from Goldman Sachs and Intel prompted a sharp rally in global equities. Growing risk appetite fed through to the currency markets, weighing on safe-haven demand for the yen and the dollar, and boosting higher yielding currencies, especially those with commodity links.
Signs of a pick-up in the global economy, most notably in China, added to investor optimism. Analysts said a string of Chinese economic data releases reaffirmed the country’s economic resilience and validated its fiscal stimulus packages. Chinese growth figures accelerated from an annual rate of 6.1 percent in the first quarter to 7.9 percent in the second. Meanwhile Chinese industrial production gained 10.7 percent in June, the largest increase for nine months.
Falling safe-haven demand hit the U.S. dollar, but the currency faced additional pressure from news that China’s foreign exchange reserves had grown by a record $178.3 billon to $2,130 billion in the second quarter. Analysts said the largest increase in reserves was in May, when the dollar weakened sharply as Treasury yields in the U.S. rose. Fear of a weaker dollar contributed to inflows to China, sparking offsetting intervention by the Chinese authorities to stem strength in the renminbi. Analysts said the pace of accumulation suggested China was having difficulty in diversifying its foreign exchange stockpiles in the short term. It is estimated that the Chinese authorities hold 65 percent to 70 percent of their reserves in dollars, with the rest in other currencies including the euro, pound and yen.
Selected currencies — weekly results
|
|
2008 |
2009 |
% change |
|
|
Dec 31 |
Jul 10 |
Jul 17 |
Week |
2009 |
| U.S. $ per currency |
|
|
|
|
|
|
| Australia |
A$ |
0.711 |
0.779 |
0.801 |
2.9% |
12.7% |
| New Zealand |
NZ$ |
0.587 |
0.627 |
0.643 |
2.6% |
9.5% |
| Canada |
C$ |
0.822 |
0.859 |
0.896 |
4.3% |
9.0% |
| Eurozone |
euro (€) |
1.397 |
1.395 |
1.410 |
1.1% |
0.9% |
| UK |
pound sterling (£) |
1.459 |
1.621 |
1.634 |
0.8% |
12.0% |
|
|
|
|
|
|
|
| Currency per U.S. $ |
|
|
|
|
|
|
| China |
yuan |
6.826 |
6.833 |
6.832 |
0.0% |
-0.1% |
| Hong Kong |
HK$* |
7.750 |
7.750 |
7.750 |
0.0% |
0.0% |
| India |
rupee |
48.675 |
49.005 |
48.735 |
0.6% |
-0.1% |
| Japan |
yen |
90.740 |
92.395 |
94.324 |
-2.0% |
-3.8% |
| Malaysia |
ringgit |
3.453 |
3.578 |
3.573 |
0.1% |
-3.4% |
| Singapore |
Singapore $ |
1.433 |
1.463 |
1.451 |
0.9% |
-1.2% |
| South Korea |
won |
1259.550 |
1282.500 |
1259.300 |
1.8% |
0.0% |
| Taiwan |
Taiwan $ |
32.820 |
33.044 |
32.946 |
0.3% |
-0.4% |
| Thailand |
baht |
34.753 |
34.070 |
34.065 |
0.0% |
2.0% |
| Switzerland |
Swiss franc |
1.066 |
1.085 |
1.077 |
0.7% |
-1.0% |
| *Pegged to U.S. dollar |
|
|
|
|
|
|
| Source: Bloomberg |
|
|
|
|
|
|
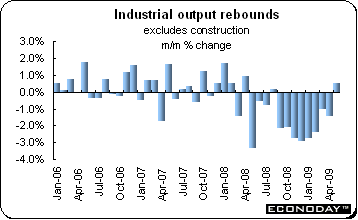 May industrial production (excluding construction) was up 0.5 percent but was still down 17.0 percent on the year. The rebound was led by capital goods which saw activity rise 1.2 percent on the month. Intermediates (0.3 percent) and nondurable consumer goods (0.8 percent) also registered gains while there were declines in both durable consumer goods (2.9 percent) and energy (0.2 percent). Among the larger EMU countries monthly performances varied markedly. Hence, while production jumped in Germany (3.7 percent) and in France (2.6 percent), Italy saw no change and Spain witnessed another hefty decline (2.9 percent). May industrial production (excluding construction) was up 0.5 percent but was still down 17.0 percent on the year. The rebound was led by capital goods which saw activity rise 1.2 percent on the month. Intermediates (0.3 percent) and nondurable consumer goods (0.8 percent) also registered gains while there were declines in both durable consumer goods (2.9 percent) and energy (0.2 percent). Among the larger EMU countries monthly performances varied markedly. Hence, while production jumped in Germany (3.7 percent) and in France (2.6 percent), Italy saw no change and Spain witnessed another hefty decline (2.9 percent).
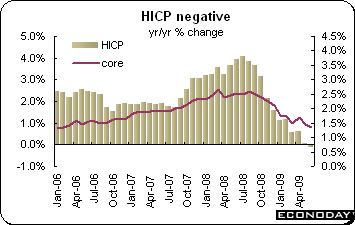 June harmonized index of consumer prices was up 0.2 percent but edged down 0.1 percent on the year — its first ever negative reading and 4.1 percentage points below its July 2008 peak. Excluding food, drink, tobacco & petroleum eased to an increase of 1.4 percent. However, excluding energy & unprocessed food, inflation slipped 0.2 percentage points to just 1.3 percent. By sector the largest annual drop took place in food (0.5 percentage points to minus 0.2 percent) but prices also decelerated significantly in clothing (from 0.7 percent to 0.3 percent) and in hotels & restaurants (2.2 percent to 1.9 percent). The only area where prices accelerated steeply was in alcohol & tobacco (from 3.3 percent to 4.4 percent). June harmonized index of consumer prices was up 0.2 percent but edged down 0.1 percent on the year — its first ever negative reading and 4.1 percentage points below its July 2008 peak. Excluding food, drink, tobacco & petroleum eased to an increase of 1.4 percent. However, excluding energy & unprocessed food, inflation slipped 0.2 percentage points to just 1.3 percent. By sector the largest annual drop took place in food (0.5 percentage points to minus 0.2 percent) but prices also decelerated significantly in clothing (from 0.7 percent to 0.3 percent) and in hotels & restaurants (2.2 percent to 1.9 percent). The only area where prices accelerated steeply was in alcohol & tobacco (from 3.3 percent to 4.4 percent).
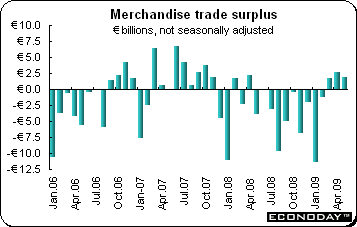 May merchandise trade surplus was €0.8 billion after a revised surplus of €0.7 billion in April. A 2.7 percent decline in exports was virtually offset by a 2.8 percent drop in imports. Imports have dropped in every month in 2009. Most EMU countries once again recorded deficits in May and, if it were not for Germany’s hefty surplus of €4.2 billion, the overall balance would have been negative. The only other surplus of note was recorded by Ireland (€1.1 billion) where especially weak domestic demand has caused imports to contract sharply. The largest individual deficit was posted by the Netherlands (€5.8 billion) which was well ahead of the next biggest, Spain (€2.0 billion). May merchandise trade surplus was €0.8 billion after a revised surplus of €0.7 billion in April. A 2.7 percent decline in exports was virtually offset by a 2.8 percent drop in imports. Imports have dropped in every month in 2009. Most EMU countries once again recorded deficits in May and, if it were not for Germany’s hefty surplus of €4.2 billion, the overall balance would have been negative. The only other surplus of note was recorded by Ireland (€1.1 billion) where especially weak domestic demand has caused imports to contract sharply. The largest individual deficit was posted by the Netherlands (€5.8 billion) which was well ahead of the next biggest, Spain (€2.0 billion).
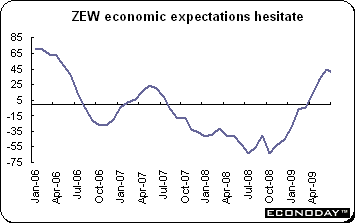 July ZEW current conditions edged up to minus 89.3 from minus 89.7 while expectations dropped to 39.5 from 44.8 in June as analysts appear to be more cautious about economic prospects. The dip in expectations in part reflects concerns over lending to both the consumer and industrial sectors although no credit crunch is seen in Germany. ZEW interprets the outcome to be consistent with a 6 percent fall in real GDP in calendar 2009 and an unchanged level of total output in both third and fourth quarters. July ZEW current conditions edged up to minus 89.3 from minus 89.7 while expectations dropped to 39.5 from 44.8 in June as analysts appear to be more cautious about economic prospects. The dip in expectations in part reflects concerns over lending to both the consumer and industrial sectors although no credit crunch is seen in Germany. ZEW interprets the outcome to be consistent with a 6 percent fall in real GDP in calendar 2009 and an unchanged level of total output in both third and fourth quarters.
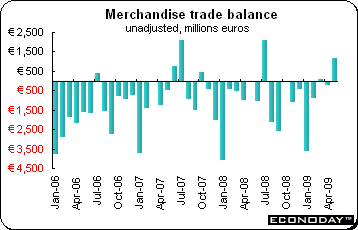 June seasonally adjusted merchandise trade surplus was €0.4 billion — the first surplus in more than a year. It reflected an export gain of 0.5 percent combined with a 1.7 percent drop in imports. However, exports are down 27 percent while imports dropped 25.6 percent when compared with last year. Within total exports, consumer goods were down 20.3 percent from a year ago while capital goods were 24.3 percent weaker and intermediates dropped 32.0 percent. Energy exports slumped 46.7 percent. The picture for imports was little different with hefty annual declines in all major categories led by intermediates (34.9 percent) ahead of energy (30.1 percent) and capital goods (26.0 percent). By contrast consumer goods fell a relatively mild 7.2 percent. June seasonally adjusted merchandise trade surplus was €0.4 billion — the first surplus in more than a year. It reflected an export gain of 0.5 percent combined with a 1.7 percent drop in imports. However, exports are down 27 percent while imports dropped 25.6 percent when compared with last year. Within total exports, consumer goods were down 20.3 percent from a year ago while capital goods were 24.3 percent weaker and intermediates dropped 32.0 percent. Energy exports slumped 46.7 percent. The picture for imports was little different with hefty annual declines in all major categories led by intermediates (34.9 percent) ahead of energy (30.1 percent) and capital goods (26.0 percent). By contrast consumer goods fell a relatively mild 7.2 percent.
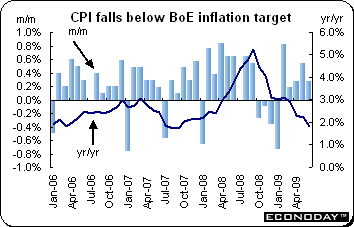 June consumer prices were up 0.3 percent and 1.8 percent when compared with last year and below the Bank of England’s inflation target for the first time since September 2007. The main driving force behind the annual decline was weakness in the food & drinks sector where prices dropped 2.4 percentage points to 5.4 percent. However, there were also marked declines in furniture & household equipment (from 3.2 percent to 1.9 percent), alcohol & tobacco (3.9 percent to 3.3 percent) and in communication (1.3 percent to 0.7 percent). Core CPI edged up 0.2 percent and was up 1.6 percent on the year. June consumer prices were up 0.3 percent and 1.8 percent when compared with last year and below the Bank of England’s inflation target for the first time since September 2007. The main driving force behind the annual decline was weakness in the food & drinks sector where prices dropped 2.4 percentage points to 5.4 percent. However, there were also marked declines in furniture & household equipment (from 3.2 percent to 1.9 percent), alcohol & tobacco (3.9 percent to 3.3 percent) and in communication (1.3 percent to 0.7 percent). Core CPI edged up 0.2 percent and was up 1.6 percent on the year.
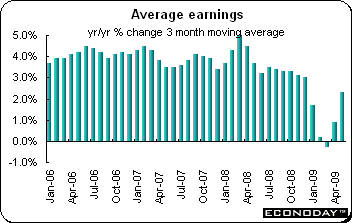 Average earnings for the three months to June to 2.3 percent, up 1.4 percentage points from a marginally faster revised 0.9 percent pace at the start of the quarter. Excluding bonuses however, the headline rate was essentially unchanged at 2.6 percent and in the year to May alone, total earnings rose only 2.2 percent, down sharply from April's 3.4 percent pace. Private earnings growth was up 0.9 percentage points to 1.9 percent but was steady at 3.5 percent in public industries. Manufacturing actually saw a decline (0.8 percent from 1.2 percent) implying that services (2.4 percent from 0.8 percent) accounted for all of the pick-up in the national rate. Average earnings for the three months to June to 2.3 percent, up 1.4 percentage points from a marginally faster revised 0.9 percent pace at the start of the quarter. Excluding bonuses however, the headline rate was essentially unchanged at 2.6 percent and in the year to May alone, total earnings rose only 2.2 percent, down sharply from April's 3.4 percent pace. Private earnings growth was up 0.9 percentage points to 1.9 percent but was steady at 3.5 percent in public industries. Manufacturing actually saw a decline (0.8 percent from 1.2 percent) implying that services (2.4 percent from 0.8 percent) accounted for all of the pick-up in the national rate.
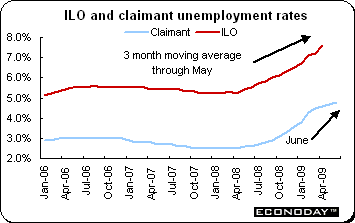 June claimant unemployment was up 23,800 which raised the unemployment rate to 4.8 percent from 4.7 percent in May. The monthly increase in joblessness was the smallest since May last year. The latest increase was the 16th in a row and at 4.8 percent, the unemployment rate is also at its highest level since October 1997. On the ILO measure, joblessness rose a further 281,000 to 2,381,000 in the three months to May. This was the largest increase on record and was accompanied by a steep increase in the jobless rate to 7.6 percent. The jobless rate on this measure now stands at its highest level since the three months to January 1997. June claimant unemployment was up 23,800 which raised the unemployment rate to 4.8 percent from 4.7 percent in May. The monthly increase in joblessness was the smallest since May last year. The latest increase was the 16th in a row and at 4.8 percent, the unemployment rate is also at its highest level since October 1997. On the ILO measure, joblessness rose a further 281,000 to 2,381,000 in the three months to May. This was the largest increase on record and was accompanied by a steep increase in the jobless rate to 7.6 percent. The jobless rate on this measure now stands at its highest level since the three months to January 1997.
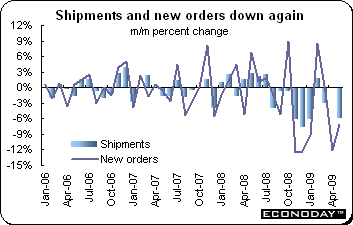 May factory shipments were down 6.0 percent for the third consecutive monthly decline. Shipments were down 27.0 percent on the year. The weakness reflected a hefty decline in volumes which slumped 5.8 percent from April. Dominating the nominal monthly drop was the transportation equipment industry which saw shipments nosedive some 25.7 percent. Excluding this sector, sales were off a more modest 2.1 percent. Motor vehicle sales were down 25.4 percent on the back of several plant shutdowns, and motor vehicle parts fell 22.2 percent thanks to tumbling demand from the assembly plants. At the same time, primary metals declined 9.0 percent. Other marked drops were reported by miscellaneous manufacturers (13.7 percent), machinery manufacturers (6.0 percent), fabricated metal products (3.5 percent) and food (2.9 percent). In total, sales fell in 17 of the 21 reporting industries. The main offset was provided by a 6.2 percent jump in sales in the petroleum & coal industry, but this was mainly a reflection of higher prices. Other elements of the report were equally poor — unfilled orders dropped 6.9 percent on the month while new orders fell an even steeper 7.2 percent. With inventories declining only 2.1 percent, the inventory-sales-ratio was a worryingly high 1.64 months. May factory shipments were down 6.0 percent for the third consecutive monthly decline. Shipments were down 27.0 percent on the year. The weakness reflected a hefty decline in volumes which slumped 5.8 percent from April. Dominating the nominal monthly drop was the transportation equipment industry which saw shipments nosedive some 25.7 percent. Excluding this sector, sales were off a more modest 2.1 percent. Motor vehicle sales were down 25.4 percent on the back of several plant shutdowns, and motor vehicle parts fell 22.2 percent thanks to tumbling demand from the assembly plants. At the same time, primary metals declined 9.0 percent. Other marked drops were reported by miscellaneous manufacturers (13.7 percent), machinery manufacturers (6.0 percent), fabricated metal products (3.5 percent) and food (2.9 percent). In total, sales fell in 17 of the 21 reporting industries. The main offset was provided by a 6.2 percent jump in sales in the petroleum & coal industry, but this was mainly a reflection of higher prices. Other elements of the report were equally poor — unfilled orders dropped 6.9 percent on the month while new orders fell an even steeper 7.2 percent. With inventories declining only 2.1 percent, the inventory-sales-ratio was a worryingly high 1.64 months.
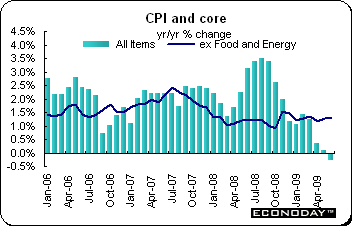 June consumer price index was up 0.3 percent but down 0.3 percent when compared with last year. This is the first time in fifteen years that the annual rate was negative. However, the underlying measures underline the overriding impact of oil price swings on both the monthly (positive) and yearly (negative) CPI growth rates. Excluding just food and energy prices the CPI was unchanged from its May level and up 1.3 percent from a year ago. At same time, the Bank of Canada’s preferred underlying measure which excludes eight volatile items was also flat on the month and 1.9 percent higher than in June 2008. On the month, the gain in the headline CPI in large part reflected a 3.5 percent jump in energy costs, which in turn prompted a 2.3 percent leap in transportation charges. The only other increases of any size were seen in health & personal care (0.6 percent) and in alcohol & tobacco (0.3 percent). Prices were down for shelter (0.1 percent), household operations, furnishings & equipment (0.3 percent) and clothing & footwear (2.8 percent). Over the year, energy prices also led the way with a 19.0 percent drop. Price increases eased for food (5.5 percent from 6.4 percent), shelter (minus 0.8 percent after minus 0.2 percent), household operations etc (2.9 percent after 3.2 percent) and clothing & footwear (minus 1.3 percent after 1.0 percent). However annual inflation accelerated in health & personal care (3.8 percent from 3.2 percent) and alcohol & tobacco (3.1 percent from 3.0 percent). June consumer price index was up 0.3 percent but down 0.3 percent when compared with last year. This is the first time in fifteen years that the annual rate was negative. However, the underlying measures underline the overriding impact of oil price swings on both the monthly (positive) and yearly (negative) CPI growth rates. Excluding just food and energy prices the CPI was unchanged from its May level and up 1.3 percent from a year ago. At same time, the Bank of Canada’s preferred underlying measure which excludes eight volatile items was also flat on the month and 1.9 percent higher than in June 2008. On the month, the gain in the headline CPI in large part reflected a 3.5 percent jump in energy costs, which in turn prompted a 2.3 percent leap in transportation charges. The only other increases of any size were seen in health & personal care (0.6 percent) and in alcohol & tobacco (0.3 percent). Prices were down for shelter (0.1 percent), household operations, furnishings & equipment (0.3 percent) and clothing & footwear (2.8 percent). Over the year, energy prices also led the way with a 19.0 percent drop. Price increases eased for food (5.5 percent from 6.4 percent), shelter (minus 0.8 percent after minus 0.2 percent), household operations etc (2.9 percent after 3.2 percent) and clothing & footwear (minus 1.3 percent after 1.0 percent). However annual inflation accelerated in health & personal care (3.8 percent from 3.2 percent) and alcohol & tobacco (3.1 percent from 3.0 percent).
Investors split their time between monitoring key earnings reports and important new data, especially from the U.S. The Bank of Japan met and announced that it would extend its special facilities until the end of the year. They were originally set to expire at the end of September. Five market moving indicators were released in the U.S. last week — retail sales, industrial production, housing starts and the producer and consumer price indexes. They painted a mixed picture very typical of this stage of the business cycle.
The Bank of Canada announces its policy decision on Tuesday — no change is expected. The Bank’s current interest rate is 0.25 percent. In Germany, investors will pay close attention to the Ifo survey — especially after the weaker than expected ZEW results last week. And in the UK, the first of the major countries’ second quarter GDP data will be released along with retail sales. And in the U.S., Fed chairman Ben Bernanke will spend two days on Capitol Hill giving his semi-annual monetary policy testimony to Senate and House committees.
| Central Bank activities |
|
| July 21 |
Canada |
Bank of Canada Policy Announcement |
|
|
|
| The following indicators will be released this week... |
| Europe |
|
|
| July 20 |
Germany |
Producer Price Index (June) |
| July 22 |
Germany |
Ifo Business Survey (July) |
|
France |
Consumption of Manufactured Goods (June) |
| July 23 |
UK |
Retail Sales (June) |
| July 24 |
UK |
Gross Domestic Product (Q2.09 preliminary) |
|
|
|
| Asia/Pacific |
|
|
| July 20 |
Australia |
Producer Price Index (Q2.09) |
| July 22 |
Japan |
Merchandise Trade Balance (June) |
|
Australia |
Consumer Price Index (Q2.09) |
|
|
|
| Americas |
|
|
| July 22 |
Canada |
Retail Trade (May) |
Anne D Picker is the author of International Economic Indicators and Central Banks.
|
