|
Consumers are being quite cautious with their wallets. And that is no surprise given the run up in the unemployment rate. However, consumers slowly have grown a little more confident about pending improvement in the economy and even spent some coin in the latest retail sales report. Yes, consumers are beginning to be not quite so shell-shocked from the recession and are peeking out of their foxholes—albeit very cautiously.
 It was a mostly up week for equities—and the Dow finally got back into positive territory for the year. Equities got off to a flattish, mixed start on Monday as investors waited to hear whether the Treasury would allow which major banks to repay TARP funds, if any. The biggest moves at the start of the week were in small caps with heavy profit taking after large gains the previous Friday. It was a mostly up week for equities—and the Dow finally got back into positive territory for the year. Equities got off to a flattish, mixed start on Monday as investors waited to hear whether the Treasury would allow which major banks to repay TARP funds, if any. The biggest moves at the start of the week were in small caps with heavy profit taking after large gains the previous Friday.
Equities were lifted for the most part on Tuesday after the Treasury announced it would allow 10 major banks repay TARP monies. Economic news also came into play as wholesale inventories fell more than expected, leading traders to see the need for inventory restocking not far down the road which would give a boost to the economy.
Negative economic news pushed stocks down on Wednesday as the Beige Book was not as positive as hoped for, the international trade report showed another drop in exports, and oil prices topped $71 per barrel. Higher oil prices were seen as slowing down eventual recovery. But equities got a lift again on Thursday from a drop in initial jobless claims and a stronger-than-expected retail sales report.
Overall, most indexes saw modest gains for the week with the biggest exceptions in small caps on profit taking. Despite worries that the latest bull run would retrench, equities mostly have held their gains—and the Dow turned positive for 2009.
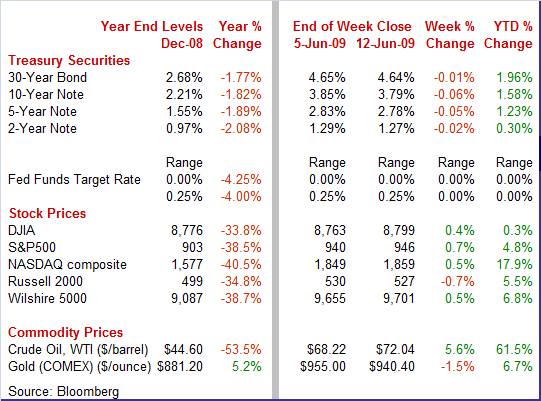
Equities were mixed but mostly up this past week. The Dow was up 0.4 percent; the S&P 500, up 0.7 percent; the Nasdaq, up 0.5 percent; and the Russell 2000, down 0.7 percent.
For the year-to-date, major indexes are up as follows: the Dow, up 0.3 percent; the S&P 500, up 4.8 percent; the Nasdaq, up 17.9 percent; and the Russell 2000, up 5.5 percent.
Weekly percent change column reflects percent changes for all components except interest rates. Interest rate changes are reflected in simple differences.
 Treasury yields were not sure which direction to take, reversing course several times during the week. But rates ended the week down slightly. During the week, rates often did not match the news on economic indicators but more reacted to the latest views on looming supply of Treasuries. Rates firmed at the start of the week on fears Treasury auctions later in the week might not go well. Treasury yields were not sure which direction to take, reversing course several times during the week. But rates ended the week down slightly. During the week, rates often did not match the news on economic indicators but more reacted to the latest views on looming supply of Treasuries. Rates firmed at the start of the week on fears Treasury auctions later in the week might not go well.
Rates eased on Tuesday after the Treasury announced that 10 banks taking TARP monies would be allowed to repay, leading many traders to increasingly see the credit crisis as being largely over. Yields bumped back up on Wednesday despite a less optimistic-than-expected Beige Book. The 10-year T-note auction resulted in yields coming within a hair of 4 percent due to supply worries and due to comments by a Russian central bank official that suggested Russia would reduce its holdings of U.S. dollars.
Rates eased Thursday despite a stronger-than-expected retail sales report. Basically, investors saw the recent run up in rates as attractive with increased demand boosting prices somewhat. Yields slipped a little further on Friday as the gain in consumer sentiment fell short of expectations.
For this past week Treasury rates were down as follows: 3-month T-bill, down 1 basis point; the 2-year note, down 2 basis points; the 5-year note, down 5 basis points; the 7-year note, down 10 basis points; the 10-year bond, down 6 basis points; and the 30-year bond, down 1 basis point.
 Crude oil prices continued to ascend on the belief that recovery worldwide is not far off and that oil will be a good inflation hedge. West Texas Intermediate spot topped $70 per barrel for the first time in seven months this past Tuesday. A drop in inventories sent crude over $71 per barrel at midweek. On Thursday, a jump in retail sales and the International Energy Agency raising its global demand forecast boosted prices to near $73 per barrel. Prices eased slightly on Friday as traders believed that the bulls had gotten a little ahead of themselves. Crude oil prices continued to ascend on the belief that recovery worldwide is not far off and that oil will be a good inflation hedge. West Texas Intermediate spot topped $70 per barrel for the first time in seven months this past Tuesday. A drop in inventories sent crude over $71 per barrel at midweek. On Thursday, a jump in retail sales and the International Energy Agency raising its global demand forecast boosted prices to near $73 per barrel. Prices eased slightly on Friday as traders believed that the bulls had gotten a little ahead of themselves.
Net for the week, spot prices for West Texas Intermediate advanced $3.82 per barrel to settle at $72.04 per barrel.
The good news is that there are signs that the consumer sector is improving. The bad news is that the improvement is very slow—but few have expected any differently. The international trade picture continues to deteriorate—but at a slower pace.
 The headline for May retail sales was excellent by recent standards. But after wading through the detail, the May gain was merely respectable—and by recent measures that is still good. Overall retail sales rebounded 0.5 percent after falling 0.2 percent in April. Excluding motor vehicles, retail sales also made a comeback, gaining 0.5 percent, also following a 0.2 percent drop in April. However, a 3.6 percent jump in gasoline station sales was the primary factor behind the increase. Excluding motor vehicles and gasoline, retail sales edged up 0.1 percent after slipping 0.1 percent in April. The headline for May retail sales was excellent by recent standards. But after wading through the detail, the May gain was merely respectable—and by recent measures that is still good. Overall retail sales rebounded 0.5 percent after falling 0.2 percent in April. Excluding motor vehicles, retail sales also made a comeback, gaining 0.5 percent, also following a 0.2 percent drop in April. However, a 3.6 percent jump in gasoline station sales was the primary factor behind the increase. Excluding motor vehicles and gasoline, retail sales edged up 0.1 percent after slipping 0.1 percent in April.
Other components were mixed with gains seen in building materials, health & personal care, food & beverages, clothing, and food services & drinking places. Declines were found in miscellaneous retailers, sporting goods, electronics, furniture, nonstore retailers, and general merchandise.
So, how are retail sales doing over the last 12 months' Only two major categories showed net gains—health & personal care and food & beverages. Basically, the basics were positive.
Weakness was led by a year-ago plunge in sales at gasoline stations, down 33.8 percent due to sharply lower gasoline prices from 2008. Next in line were motor vehicles, down 19.6 percent, due to tighter credit, higher unemployment, and concerns over buying cars from bankrupt auto manufacturers. Also notably weak were furniture and building materials, reflecting the recession in housing. Electronics & appliances likely have been hurt by heavy discounting.

 It wasn’t a lot, but it was in the right direction. The Reuters/University of Michigan consumer sentiment index edged up 3 tenths to 69.0. Expectations, which have been driving consumer measurements sharply higher for the last two months, actually fell back in this report, down 4 points to 65.4 for the first decline since February. In contrast, the assessment of current conditions, which has been flat, jumped nearly 7 points to 74.5. This is good news because consumer evaluations of current conditions generally lag expectations when coming out of recessions. The June gain in consumer sentiment was the fourth consecutive rise and the highest level since March 2008. It wasn’t a lot, but it was in the right direction. The Reuters/University of Michigan consumer sentiment index edged up 3 tenths to 69.0. Expectations, which have been driving consumer measurements sharply higher for the last two months, actually fell back in this report, down 4 points to 65.4 for the first decline since February. In contrast, the assessment of current conditions, which has been flat, jumped nearly 7 points to 74.5. This is good news because consumer evaluations of current conditions generally lag expectations when coming out of recessions. The June gain in consumer sentiment was the fourth consecutive rise and the highest level since March 2008.
Rising gasoline prices and talk about surging federal deficits have consumers more nervous about inflation. Both 1-year and 5-year inflation expectations rose, each now at 3.1 percent with the 1-year reading up 3 tenths and the 5-year up 2 tenths.
 The U.S. trade deficit in April worsened as exports fell faster than imports. However, there is a glimmer of hope in the import detail. The overall U.S. trade gap grew to $29.2 billion from a revised $28.5 billion deficit the prior month. Indeed, worldwide demand contracted further as exports fell 2.3 percent while imports slipped 1.4 percent. The widening in the trade gap was seen in both petroleum and nonpetroleum components. The petroleum deficit widened to $15.0 billion from $14.5 billion in March. Meanwhile, the goods excluding petroleum gap grew to $23.9 billion in April from $23.2 billion the month before. The U.S. trade deficit in April worsened as exports fell faster than imports. However, there is a glimmer of hope in the import detail. The overall U.S. trade gap grew to $29.2 billion from a revised $28.5 billion deficit the prior month. Indeed, worldwide demand contracted further as exports fell 2.3 percent while imports slipped 1.4 percent. The widening in the trade gap was seen in both petroleum and nonpetroleum components. The petroleum deficit widened to $15.0 billion from $14.5 billion in March. Meanwhile, the goods excluding petroleum gap grew to $23.9 billion in April from $23.2 billion the month before.
 The fall in exports was led by declines in industrial supplies and capital goods excluding autos. Consumer goods exports also slipped while the foods, feeds & beverages component rose incrementally. The fall in exports was led by declines in industrial supplies and capital goods excluding autos. Consumer goods exports also slipped while the foods, feeds & beverages component rose incrementally.
On the import side, no one expenditure category dominated as capital goods excluding autos, industrial supplies, autos, and the foods, feeds & beverages component declined modestly. The good news, ironically, is that consumer goods imports rose slightly in April after a similar gain in March. While demand for capital goods and manufacturing inputs is down, the higher import levels for consumer goods suggest that businesses believe that the consumer sector will be rebounding in coming months.
Looking at the pattern of exports and imports over the past year, it appears that the contractions in overseas demand for U.S. exports and U.S. demand for imports are easing. Export and import weakness is nowhere nearly as severe as in late 2008 and early 2009. This is another sign that the recession is easing not just in the U.S. but also overseas. It should be emphasized that the recession continues, but not with as tight a grip as earlier.
 Import price data for May show early hints of inflation. There are signs of cost push inflation heavily related to higher commodity prices. The good news is that the pressure has not fully reached the consumer stage. Overall import prices jumped 1.3 percent in May after a 1.1 percent boost the prior month. Recent gains have been led by petroleum & petroleum product prices which increased 8.3 percent in the latest month, following a 9.8 percent jump in April. Import price data for May show early hints of inflation. There are signs of cost push inflation heavily related to higher commodity prices. The good news is that the pressure has not fully reached the consumer stage. Overall import prices jumped 1.3 percent in May after a 1.1 percent boost the prior month. Recent gains have been led by petroleum & petroleum product prices which increased 8.3 percent in the latest month, following a 9.8 percent jump in April.
But price pressures have been rising outside of petroleum also. Non-petroleum import prices rose 0.2 percent to end a long string of declines. Pressure is appearing in ex-petroleum industrial supplies (up 0.6 percent) and, for a second month, in foods (up 0.3 percent). Commodity prices have been on the rise in large part due to inflation hedging spurred by expectations of dollar-based inflation. Such expectations have also been a big factor behind the jump underway in crude oil.
The limited good news is that import prices for consumer goods ex autos and for capital goods remain soft. Import prices for consumer goods and for capital goods were flat in May.
Import prices indeed are not keeping inflation down as in recent months—especially in terms of the impact of oil prices directly on gasoline and indirectly on business costs. While the inflation pressures are just starting to rise, it’s time for the Fed to start thinking about making sure the numbers don’t boost overall inflation in coming months.
It wasn’t a great week but it wasn’t bad either. Consumers peeked out of their fox holes and actually spent some money. And consumers are slowly growing more optimistic about pending recovery—emphasis on slowly. The news on the decline in exports was not good in terms of being a decline. But the fact that export weakness is slowing is a step in the right direction. Overall, the economy is easing toward a recession bottom and is slightly closer to recovery.
This coming week we get double doses of news on market moving indicators for the heavily cyclical goods-producing sectors and on inflation. Traders will focus on housing starts and industrial production for the first and on producer prices and consumer prices for the latter. Also, we get added information on manufacturing from both the Empire State and Philly Fed manufacturing surveys.
The Empire State manufacturing index improved to minus 4.6 in May from minus 14.7 in April. The shipments index actually showed a month-to-month increase, coming in above the breakeven level with a 1.3 reading. But looking ahead, the news was not all on the upside. The new orders index fell back to minus 9.0 in May from minus 3.9 the month before, suggesting a fallback in June for the overall index.
Empire State Manufacturing Survey Consensus Forecast for June 09: -2.0
Range: -8.1 to 5.0
Housing starts in April fell another 12.8 percent to a pace of 0.458 million units annualized—a new record low for a series going back to 1959. The April pace of 0.458 million units annualized was down 54.2 percent year-on-year. April's decrease was led by the multifamily component which plunged 46.1 percent while single-family starts edged up 2.8 percent. Looking ahead, we may see a rebound in multifamily starts pulling up the headline number. But single-family starts are still constrained by heavy supply of unsold homes—which stood at 10.1 months in April for newly constructed homes.
Housing starts Consensus Forecast for May 09: 0.500 million-unit rate
Range: 0.440 million to 0.550 million-unit rate
The producer price index in April made a comeback as the overall PPI rebounded 0.3 percent, after falling 1.2 percent in March. The boost was led by a 1.5 percent jump in food prices, following two months of decline. Meanwhile, energy actually slipped 0.1 percent, following a 5.5 percent drop in March. The core PPI rate also firmed – to a 0.1 percent rise after no change in March. For May, rising oil prices could lead to another boost in the headline PPI. However, discounting—including for autos—could pull down the core rate.
PPI Consensus Forecast for May 09: +0.7 percent
Range: +0.1 to +0.8 percent
PPI ex food & energy Consensus Forecast for May 09: +0.1 percent
Range: +0.1 to +0.2 percent
Industrial production in April fell 0.5 percent, following March's 1.7 percent plunge. However, the manufacturing component declined a more moderate 0.3 percent, following a 2.1 percent fall the month before. Overall capacity utilization in April continued its downtrend, slipping to 69.1 percent from 69.4 percent in March. Looking ahead, we are likely to see another decline in industrial production as motor vehicle assemblies are still under pressure from lackluster sales and bankruptcies at Chrysler and GM. Markets should give attention to industrial production excluding motor vehicles, which declined 0.5 percent in April. Weakness is still expected in May as production worker hours from the employment report showed a 2.1 percent drop for the month in manufacturing. Major manufacturing survey headline numbers for May also came in below the breakeven points for their respective surveys: 42.8 for ISM, minus 22.6 for Philly Fed, and minus 4.6 for the Empire State survey.
Industrial production Consensus Forecast for May 09: -1.0 percent
Range: -1.5 to -0.2 percent
Capacity utilization Consensus Forecast for May 09: 68.4 percent
Range: 68.0 to 69.0 percent
The consumer price index for April came in flat, following a 0.1 percent decline in March. A 2.4 percent drop in energy costs kept the overall CPI weak. Meanwhile, core CPI inflation posted a 0.3 percent jump in April, after rising 0.2 percent the month before. But according to the Labor Department, over 40 percent of the gain in the core rate was due to a second consecutive hike in tobacco taxes. Looking ahead, rising energy costs will likely boost the headline number for May but if the tobacco tax increase in April is not repeated in May, the core should soften—especially as many retailers continue to discount.
CPI Consensus Forecast for May 09: +0.3 percent
Range: +0.1 to +0.4 percent
CPI ex food & energy Consensus Forecast for May 09: +0.1 percent
Range: +0.1 to +0.2 percent
Initial jobless claims fell 24,000 in the June 6 week to 601,000. The improvement was clearly evident in the four-week average which fell 10,500 to 621,750 -- its lowest level since February. However, while job losses are slowing, the number of unemployed rose further in the latest week. Continuing claims for the May 30 week rose 59,000 to 6.816 million, another record high.
Jobless Claims Consensus Forecast for 6/13/09: 610,000
Range: 590,000 to 625,000
The Conference Board's index of leading indicators in April posted its first gain in seven months, jumping 1.0 percent in April. The most important factors giving April a boost were the big stock market rally and a rise in consumer expectations. The biggest negative was money supply.
Leading indicators Consensus Forecast for May 09: +1.0 percent
Range: -0.7 to +1.3 percent
The general business conditions component of the Philadelphia Fed's business outlook survey index in May edged up to minus 22.6 from minus 24.4 the month before. The May reading was the best since plus 1.9 seen for September 2008. Looking ahead, there may be some slippage in the overall index in June as the May new orders index actually fell back slightly to minus 25.9 from minus 24.3 in April.
Philadelphia Fed survey Consensus Forecast for June 09: -15.0
Range: -21.4 to -14.0
Econoday Senior Writer Mark Pender contributed to this article.
|
