|
This past week we found out that the fourth quarter was even more negative than previously believed. And the first quarter is looking even worse based on the latest numbers for housing, manufacturing, and the consumer. Further rattling the markets was a deal between Citibank and the Treasury for the Treasury to bolster the bank’s capital position by taking ownership of somewhere between 30 and 40 percent of the firm. And you can’t leave out the reminder by the Obama Administration that the federal deficit is ballooning with their plans to raise taxes on high income earners. The good news likely is that equities didn’t fall any more than they did.
 Most equity indexes ended the week down – and for plenty of good reasons. On the economic indicator front, the news was a parade of down data, indicating that markets had not fully built in how bad the recession is. Fourth quarter GDP was revised down sharply, durables orders posted a large decline, existing and new home sales both fell to record lows, house prices plunged further, initial jobless claims jumped, and consumer confidence dropped to a record low. It was not much of a week for the optimists on the economy and equities responded in kind. Most equity indexes ended the week down – and for plenty of good reasons. On the economic indicator front, the news was a parade of down data, indicating that markets had not fully built in how bad the recession is. Fourth quarter GDP was revised down sharply, durables orders posted a large decline, existing and new home sales both fell to record lows, house prices plunged further, initial jobless claims jumped, and consumer confidence dropped to a record low. It was not much of a week for the optimists on the economy and equities responded in kind.
During the week Fed Chairman Ben Bernanke tried to allay market fears that nationalization of banks is not necessarily an outcome of how to deal with weak and undercapitalized banks. He indicated that both the Treasury and the Fed were working to provide capital without necessarily nationalizing large banks. His comments were soothing but did not last as Citibank was seen as increasingly close to failure by many investors. Traders saw a deal between Citibank and the Treasury to bolster capital for the bank as acknowledgement that the bank was in worse shape than earlier believed. The Treasury already owns preferred shares of the bank’s stock from a $45 billion earlier infusion. These stocks will be converted to common stock. Depending on how much other preferred stock is converted to common stock by other investors, the Treasury will likely end up owning somewhere between 30 and 40 percent of Citibank.
President Obama announced a proposed budget for fiscal 2010 with an estimated $1.75 trillion budget deficit. Support in the budget for the financial sector lifted bank shares but negative economic news for the week was more than offsetting. Markets did not like talk of raising taxes on individuals earning over $250,000 per year. His budget reinstates the pre-Bush top tax rates of 36 percent and 39.6 percent in 2011, up from the current 33 percent and 35 percent.
Still, for the week, it could have been a lot worse – traders appear to have already been building in a worsening in the economy.
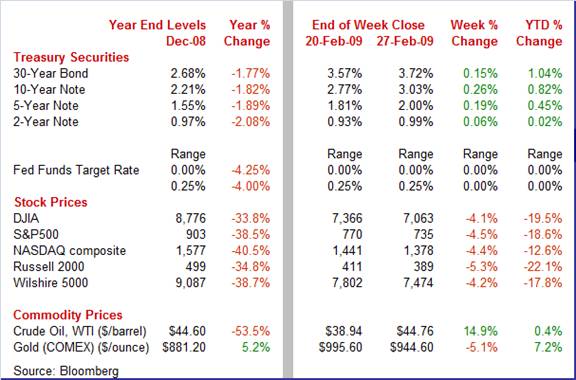
Equities were down this past week. The Dow was down 4.1 percent; the S&P 500, down 4.5 percent; the Nasdaq, down 4.4 percent; and the Russell 2000, down 5.3 percent.
 With February now come to a close, the Dow has fallen for six consecutive months. Major equity indexes were down for the month of February net. The Dow was down 11.7 percent; the S&P 500, down 11.0 percent; the Nasdaq, down 6.7 percent; and the Russell 2000, down 12.3 percent. With February now come to a close, the Dow has fallen for six consecutive months. Major equity indexes were down for the month of February net. The Dow was down 11.7 percent; the S&P 500, down 11.0 percent; the Nasdaq, down 6.7 percent; and the Russell 2000, down 12.3 percent.
For the year-to-date, major indexes are down as follows: the Dow, down 19.5 percent; the S&P 500, down 18.6 percent; the Nasdaq, down 12.6 percent; and the Russell 2000, down 22.1 percent.
Weekly percent change column reflects percent changes for all components except interest rates. Interest rate changes are reflected in simple differences.
 Treasury yields were mixed this past week as bill rates edged down but rates on T-notes and T-bonds rose—especially on bonds. The yield curve steepened a little more as very negative economic news and flight to safety weighed on short-term yields. But the ballooning federal deficit is bumping up longer yields. Note and bond rates rose most noticeably on Wednesday as the higher yields were demanded by investors after the five-year note auction of $32 billion in notes. Also rattling bond markets was President Obama’s unveiling a $1.75 trillion deficit in his proposed budget for fiscal 2010. His pledge to reduce the deficit to $533 billion by 2013 was seen as being not credible – further boosting yields on Treasury notes and bonds. Treasury yields were mixed this past week as bill rates edged down but rates on T-notes and T-bonds rose—especially on bonds. The yield curve steepened a little more as very negative economic news and flight to safety weighed on short-term yields. But the ballooning federal deficit is bumping up longer yields. Note and bond rates rose most noticeably on Wednesday as the higher yields were demanded by investors after the five-year note auction of $32 billion in notes. Also rattling bond markets was President Obama’s unveiling a $1.75 trillion deficit in his proposed budget for fiscal 2010. His pledge to reduce the deficit to $533 billion by 2013 was seen as being not credible – further boosting yields on Treasury notes and bonds.
 For this past week Treasury rates were mixed as follows: 3-month T-bill, down 2 basis points, the 2-year note, up 6 basis points; the 5-year note, up 19 basis points; the 10-year bond, up 26 basis points; and the 30-year bond, up 15 basis points. For this past week Treasury rates were mixed as follows: 3-month T-bill, down 2 basis points, the 2-year note, up 6 basis points; the 5-year note, up 19 basis points; the 10-year bond, up 26 basis points; and the 30-year bond, up 15 basis points.
Short yields remain under pressure from flight to safety while long rates have been boosted over heavy supply concerns and higher inflation expectations.
 Oil prices have quietly settled into a relatively tight trading range in recent weeks of $35 to $45 per barrel for West Texas Intermediate spot. Of course, the dollar swings now are big percentages at these relatively low levels but in contrast to upward movement into early July of last year and the downtrend into early January, the numbers have been relatively calm in recent weeks. For the latest week, spot prices for West Texas Intermediate rose $5.82 per barrel to settle at $44.76 per barrel. Upward pressure was due to expectations of lower inventories with actual numbers for gasoline stocks coming in even less than expected. Analysts also announced that OPEC production is expected to be down for February. Oil prices have quietly settled into a relatively tight trading range in recent weeks of $35 to $45 per barrel for West Texas Intermediate spot. Of course, the dollar swings now are big percentages at these relatively low levels but in contrast to upward movement into early July of last year and the downtrend into early January, the numbers have been relatively calm in recent weeks. For the latest week, spot prices for West Texas Intermediate rose $5.82 per barrel to settle at $44.76 per barrel. Upward pressure was due to expectations of lower inventories with actual numbers for gasoline stocks coming in even less than expected. Analysts also announced that OPEC production is expected to be down for February.
All the news was negative this past week as not only was the fourth quarter growth rate revised down sharply but housing and manufacturing continued to contract in the first quarter and the consumer remains gloomy.
 The U.S. economy ended 2008 with the worst quarterly performance since 1982. Fourth quarter GDP was revised down significantly as the Commerce Department’s first revision to fourth quarter GDP knocked the quarter’s growth rate down to a 6.2 percent decline from the initial estimate of a 3.8 percent drop. The downward revision was primarily due to a sharply lower estimate for inventories and for exports. Also, personal consumption, nonresidential fixed investment, and government purchases were revised down modestly. These were partially offset by a less weak decline in residential investment. The fourth quarter fall in GDP followed a 0.5 percent dip the prior quarter. The U.S. economy ended 2008 with the worst quarterly performance since 1982. Fourth quarter GDP was revised down significantly as the Commerce Department’s first revision to fourth quarter GDP knocked the quarter’s growth rate down to a 6.2 percent decline from the initial estimate of a 3.8 percent drop. The downward revision was primarily due to a sharply lower estimate for inventories and for exports. Also, personal consumption, nonresidential fixed investment, and government purchases were revised down modestly. These were partially offset by a less weak decline in residential investment. The fourth quarter fall in GDP followed a 0.5 percent dip the prior quarter.
 Probably the only positive news in the GDP report was that inventories are now seen as falling $19.9 billion instead of rising $6.2 billion. How is this positive' The inventory drop leaves less inventory overhang to work off even though the downward revision pulled down Q4. The revision to inventories cut 1.1 percentage points off of fourth quarter growth. Probably the only positive news in the GDP report was that inventories are now seen as falling $19.9 billion instead of rising $6.2 billion. How is this positive' The inventory drop leaves less inventory overhang to work off even though the downward revision pulled down Q4. The revision to inventories cut 1.1 percentage points off of fourth quarter growth.
Turning to inflation, the GDP price index was revised up to plus 0.5 percent annualized from the initial estimate of a 0.1 percent dip and topped the consensus forecast for an annualized decline of 0.1 percent. Headline PCE inflation was revised up to down 5.0 percent while core PCE inflation also was nudged up to 0.8 percent annualized for the fourth quarter.
The latest GDP numbers show the economy deeply mired in recession with the latest quarter showing sizeable drops in consumer spending (especially durables), business spending on equipment, housing investment, inventories, and exports. Nonresidential fixed investment fell but only moderately while government purchases were the only major component that posted a gain.
 Don’t look for an improvement in manufacturing any time soon. Durable goods orders in January fell for a record six consecutive months – though the series only starts in 1992. Durable goods orders plunged 5.2 percent in January, following a 4.6 percent drop in December. Excluding the transportation component, new orders declined 2.5 percent, after dropping 5.5 percent in December. Don’t look for an improvement in manufacturing any time soon. Durable goods orders in January fell for a record six consecutive months – though the series only starts in 1992. Durable goods orders plunged 5.2 percent in January, following a 4.6 percent drop in December. Excluding the transportation component, new orders declined 2.5 percent, after dropping 5.5 percent in December.
By industry group, the largest decline was in transportation which dropped a monthly 13.5 percent. Within this group, defense aircraft orders were down 28.3 percent and motor vehicles fell 6.4 percent. Nondefense aircraft actually surged 81.7 percent. Every major industry group except communications equipment declined in January.
Overall, the January durables report indicates that the recession in manufacturing is getting worse. This will further tug down on the overall economic growth and further impact jobs and income in the consumer sector.
Fed officials and others continue to talk about the need to stabilize credit markets before the economy can recover. But the real sector that has to stabilize first is housing – and that is not happening. Both existing and new home sales continued to fall in January.  Existing home sales posted a 5.3 percent drop in January to a 4.490 million annual unit rate. January’s pace is a record low for this series going back to January 1999. Supply on the market remains extremely elevated at 9.6 months compared to 9.4 months in December. Existing home sales posted a 5.3 percent drop in January to a 4.490 million annual unit rate. January’s pace is a record low for this series going back to January 1999. Supply on the market remains extremely elevated at 9.6 months compared to 9.4 months in December.
Weakness in sales is carrying over to prices as the median price of an existing home fell 3.1 percent in January to $170,300 for a 14.8 percent year-on-year decline. Falling home prices will limit government efforts to stem foreclosures as any private help on refinancing must take into account lower market values. For homeowners under water (home value below mortgage debt owed) and in need of refinancing, either it won’t happen or the government will have to make up the difference. That, in the end, is you and me, the taxpayers.
 As bad as existing home sales were, new home sales have been even more depressed. New home sales in January plunged a monthly 10.2 percent to a record low pace of 309,000 annualized units sold. Prices for new homes also continued to decline under the weight of excess supply and little traffic. The median price for a new home fell a very steep 9.9 percent in January to $201,100, pulling down the year-on-year rate to minus 13.5 percent. As bad as existing home sales were, new home sales have been even more depressed. New home sales in January plunged a monthly 10.2 percent to a record low pace of 309,000 annualized units sold. Prices for new homes also continued to decline under the weight of excess supply and little traffic. The median price for a new home fell a very steep 9.9 percent in January to $201,100, pulling down the year-on-year rate to minus 13.5 percent.
The supply of new homes on the market jumped to 13.3 months from 12.2 months in December.
 Home prices are now a key indicator of the health of the economy and, in particular, the housing sector. Economists almost universally agree that there will be no stabilization of credit markets and economic recovery until home prices stabilize. This importance is due to the impact of home prices on the ability to refinance and on the value of bundled securities held by many financial institutions. While the traditionally followed home price measures in the existing and new home sales reports show a continuing downtrend in prices, many economists believe those measures are not accurate because of the shifting composition of homes sold—low end versus high end. In contrast, the Case-Shiller indexes compare same house sales and are believed to be more accurate than prices in the new and existing home sales reports. Home prices are now a key indicator of the health of the economy and, in particular, the housing sector. Economists almost universally agree that there will be no stabilization of credit markets and economic recovery until home prices stabilize. This importance is due to the impact of home prices on the ability to refinance and on the value of bundled securities held by many financial institutions. While the traditionally followed home price measures in the existing and new home sales reports show a continuing downtrend in prices, many economists believe those measures are not accurate because of the shifting composition of homes sold—low end versus high end. In contrast, the Case-Shiller indexes compare same house sales and are believed to be more accurate than prices in the new and existing home sales reports.
In the latest report, Case-Shiller Composite 10-City Index posted a monthly 2.3 percent dip while the 20-City Index fell 2.5 percent for December. Year-on-year declines are accelerating, at down19.2 percent for the 10-City Index and down 18.5 percent for the 20-City Index. The latest numbers point to a likely worsening in foreclosure rates as financially strapped home-owners in need of refinancing will walk away without government help if private lenders are unwilling or unable to refinance.
 The consumer has checked out – no longer in the building. If there is going to be recovery any time soon, it is not going to be on the backs of consumers. Consumer confidence and sentiment are at or barely above record lows, indicating that consumers are in defensive positions, holding onto their wallets. The consumer has checked out – no longer in the building. If there is going to be recovery any time soon, it is not going to be on the backs of consumers. Consumer confidence and sentiment are at or barely above record lows, indicating that consumers are in defensive positions, holding onto their wallets.
The Conference Board's consumer confidence index in February fell to a record low in more than 40 years of data to 25.0 from 37.4 in January. The worst news in the report was a 15-point fall back in the expectations component, to 27.5. This index had been holding steady and the new decline shows a worsening in consumer worries about the future. The consumer outlook on the job market was particularly bleak. Only 4.4 percent of the sample says jobs are currently plentiful with 47.8 percent saying they are hard to get. Expectations six months out show 7.1 percent seeing more jobs ahead against 47.3 percent seeing fewer.
The Reuters/University of Michigan consumer sentiment index for February came in at 56.3, compared against 61.2 in January. The latest number is barely above the record low of 51.7 set in May 1981. The expectations component was especially weak at 50.5, indicating that consumers don't yet see a bottom for the economy.
Two big sectors – consumer and housing – are worsening rather than improving. Clearly, the recession is deepening in the first quarter of the year and growth is likely to be negative for a while since fiscal stimulus will be slow to take effect.
The two big market movers bracket the week with personal income out on Monday and the February employment situation released on Friday. Also, we’ll get an update on manufacturing with Monday’s ISM report.
Personal income dipped 0.2 percent in December, following a 0.4 percent fall in November. Within personal income, the wages and salaries component posted a 0.3 percent decline after a 0.2 percent fall in November. Consumer spending continued to retreat in December, plunging 1.0 percent after a 0.8 percent drop the prior month. Personal consumption has declined for six months in a row. The limited goods news this past week was on inflation – but this was due not just to lower oil prices but an anemic economy. The headline PCE price index declined 0.5 percent in December while the core PCE price index was unchanged for the third month in a row. Looking ahead, the 598,000 drop in payroll employment points to another decline in personal income in January though a moderate 0.3 percent gain in average hourly earnings will help limit the damage. Consumer spending is likely to be mixed. Durables are likely down on motor vehicle sales but nondurables and services are likely to improve based on retail sales excluding autos. On the inflation front, look for a rebound in PCE inflation for January based on the CPI and core CPI rebounding 0.3 percent and 0.2 percent, respectively.
Personal income Consensus Forecast for January 09: -0.2 percent
Range: -0.5 to +0.5 percent
Personal consumption expenditures Consensus Forecast for January 09: +0.4 percent
Range: -0.9 to +0.8 percent
Core PCE price index Consensus Forecast for January 09, m/m: +0.1 percent
Range: -0.1 to +0.2 percent
Core PCE price index Consensus Forecast for January 09, y/y: +1.8 percent
Range: +1.7 to +1.9 percent
The Institute for Supply Management's manufacturing index was still in negative territory in January but not as deep as in December. The ISM's manufacturing index rose more than 2-1/2 points to 35.6 which is still well below the breakeven point of 50, indicating that contraction continues but at a less rapid pace. The freefall also slowed for the new orders index, which rose to 33.2 from a 23.1 but remained well in contraction territory. The decline in prices paid continued but not quite at the precipitous pace in December. The prices paid index rose to 29.0 from 18.0 in December. Looking ahead, manufacturing is likely to continue downward in the near term as demand has continued to fall in many sectors – including consumer, housing, business investment, and exports.
ISM manufacturing index Consensus Forecast for February 09: 33.8
Range: 30.0 to 36.9
Construction spending in December continued to plummet across all major sectors. Construction outlays fell 1.4 percent in December, after posting a 1.2 percent drop in November. Looking ahead, the 16.8 percent drop in housing starts in January indicates that the residential portion of construction outlays should continue downward. Weakening corporate profits and lower revenues for state and local governments indicate that the trend for nonresidential and public outlays is down for January and coming months.
Construction spending Consensus Forecast for January 09: -1.5 percent
Range: -2.5 to -0.5 percent
Sales of domestic motor vehicles proved extremely weak in January as unit sales of North American-made cars and light trucks fell to a 6.8 million annual rate from a 7.7 million rate in December. With the recession deepening and questions remaining over the viability of U.S. automakers, sales are likely to remain depressed in February.
Motor vehicle domestic sales Consensus Forecast for February 09: 6.2 million-unit rate
Range: 6.2 to 7.3 million-unit rate
The pending home sales index bumped up in December, jumping 6.3 percent to 87.7. The big question is whether the December was real improvement based on lower mortgage rates or whether there was just some seasonality issue at play (modest real gains in housing get inflated by large seasonal factors during winter months). With labor markets worsening, it is likely that December’s improvement was temporary.
Pending home sales Consensus Forecast for January 09: 85.1
Range: 83.3 to 90.8
The composite index from the ISM non-manufacturing survey rose nearly 3 points in January to a 42.9 level that nevertheless still indicates contraction, but again at a slower rate than the prior month. The new orders index also improved but remained below the breakeven point, suggesting that the index will be down in February.
Composite index Consensus Forecast for February 09: 41.0
Range: 37.0 to 44.0
What will markets focus on in the Beige Book, this one prepared for the March 17-18 FOMC meeting. Every sector is weak so there will be little that markets will not go over with a fine-toothed comb. But stabilizing credit markets and the housing sector are key to recovery so markets may be more sensitive to any language on banks, credit markets, home sales, and house prices.
Initial jobless claims for the February 21 week jumped 36,000 to 667,000, the highest level in 26 years (prior week revised 4,000 higher to 631,000). Continuing claims were the worst ever, up 114,000 to 5.112 million for the week ending February 14. With companies continuing to announce layoffs, high levels of initial claims are likely for some time.
Jobless Claims Consensus Forecast for 2/28/09: 650,000
Range: 600,000 to 676,000
Nonfarm productivity for the fourth quarter’s initial estimate came in much better than expected. Fourth quarter productivity increased at a 3.2 percent annualize rate, following a 1.5 percent rise in the third quarter. But the stronger-than-expected positive number was due to hours worked falling more than output, down 8.4 percent and 5.5 percent, respectively. Meanwhile, unit labor costs eased to a 1.8 percent annualized increase, following a 2.6 percent gain in the third quarter. However, the sharp downward revision to fourth quarter real GDP (from down 3.8 percent to down 6.2 percent) will likely cut into the productivity gain and boost unit labor costs. The output component of productivity and unit labor costs is based on many of the source data used for real GDP.
Nonfarm Productivity Consensus Forecast for revised Q4 08: +1.5 percent annual rate
Range: -0.5 to 3.0 percent annual rate
Unit Labor Costs Consensus Forecast for revised Q4 08: 3.4 percent annual rate
Range: 0.7 to 6.4 percent annual rate
Factory orders are looking ugly – pointing to further declines in manufacturing. Factory orders are pointing to greater declines in shipments and greater contraction in payrolls. New factory orders fell a revised 4.7 percent in December (originally down 3.9 percent), following a 6.5 percent drop in November. We can expect more of the same for January as we already have the initial estimate for the durables component at down a sharp 5.2 percent for the month.
Factory orders Consensus Forecast for January 09: -3.5 percent
Range: -6.0 to +0.5 percent
Nonfarm payroll employment in January showed the economy worsening further with a third consecutive drop in payroll employment topping half a million. Nonfarm payroll employment in January plummeted 598,000, following a fall of 577,000 in December and a decline of 597,000 in November. The latest wage inflation numbers have been a little peculiar in recent months. Average hourly earnings increased 0.3 percent in January after rising 0.4 percent in December. It is likely that average hourly earnings have been kept on the high side by a shift in the composition of those still with jobs with more low-paying jobs being cut than high-paying jobs. The civilian unemployment rate jumped to 7.6 percent from 7.2 percent in December. The January number is the highest since 7.6 percent for October 1992. Looking ahead, jobless claims have been rising and are pointing to a February job loss that is even larger than January’s.
Nonfarm payrolls Consensus Forecast for February 09: -648,000
Range: -800,000 to -500,000
Unemployment rate Consensus Forecast for February 09: 7.9 percent
Range: 7.8 to 8.1 percent
Average workweek Consensus Forecast for February 09: 33.3 hours
Range: 33.1 to 33.5 hours
Average hourly earnings Consensus Forecast for February 09: +0.2 percent
Range: 0.0 to +0.3 percent
Consumer credit continues to contract and contract at an unprecedented rate, reflecting both tightening credit standards and a hunkering down by consumers. Consumer credit fell $6.6 billion dollars in December with revolving credit showing the great bulk of the contraction. Consumer credit fell a revised $11.1 billion in November. Declines of this size in overall consumer credit have not been seen since the 1990-91 recession. There are cross currents going into the January numbers. While sales of domestics were down, combined domestics and imports motor vehicle sales nudged up in January and will be a positive on credit growth but the worsening jobs pictures suggests that consumers will be retrenching elsewhere for the month. Net, we will likely see another decline in consumer credit outstanding in January.
Consumer credit Consensus Forecast for January 09: -$4.8 billion
Range: -$10.0 billion to +$3.2 billion
Econoday Senior Writer Mark Pender contributed to this article.
|

