|
Simply Economics will be taking next week off
Simply Economics will return on January 2, 2009
Merry Christmas and Happy New Year
from all of us at Econoday!
The final full trading week of the year was full of surprises as the Fed cut rates to an historic low and embarked on a new policy strategy. At week's end, the Bush administration bit the bullet and decided to give GM and Chrysler temporary bail-out loans instead of allowing the automakers to fall into bankruptcy as many believed the administration had been leaning. Even though most equities ended the week on a positive note, the economy has a long way to go to get to recovery. As noted by Dallas Fed President Richard Fisher, referring to the Fed’s still needed work to boost the economy, "we have miles to go before we sleep."
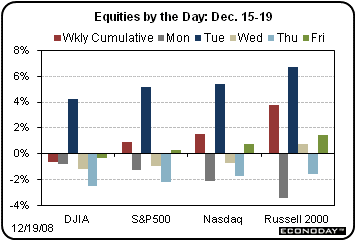 Stocks were mostly up this past week with the Fed’s lowering its target rate to near zero juicing stocks just after Tuesday’s FOMC statement. Also, adding to the general good mood was an announcement at week's end that the Bush administration would be loaning GM and Chrysler $17.4 billion of TARP funds ($13.4 billion will be available immediately with another $4 billion to be released in February). Stocks were mostly up this past week with the Fed’s lowering its target rate to near zero juicing stocks just after Tuesday’s FOMC statement. Also, adding to the general good mood was an announcement at week's end that the Bush administration would be loaning GM and Chrysler $17.4 billion of TARP funds ($13.4 billion will be available immediately with another $4 billion to be released in February).
The Dow was the one major index that was negative for the week. Sharply lower oil prices weighed on the energy patch and options expirations led the Dow down at close on Friday. Also, pulling the Dow down was GE taking a hit from a downgrade by S&P on earnings. Still, it should be noted that equities were still somewhat muted despite some euphoria from the Fed cut. The lack of stronger upward movement was due to negative economic news from manufacturing and housing sectors.
Equities were mixed this past week. The Dow was down 0.6 percent; the S&P 500, up 0.9 percent; the Nasdaq, up 1.5 percent; and the Russell 2000, up 3.8 percent.
For the year-to-date, major indexes are down as follows: the Dow, down 35.3 percent; the S&P 500, down 39.5 percent; the Nasdaq, down 1.5 percent; and the Russell 2000, down 3.8 percent.

Weekly percent change column reflects percent changes for all components except interest rates. Interest rate changes are reflected in simple differences.
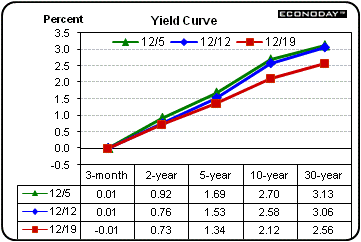 Treasury yields hit historic lows this past week with the 3-month T-bill even closing with an incrementally negative rate of return. Yes, traders paid the Treasury to borrow! Treasury yields hit historic lows this past week with the 3-month T-bill even closing with an incrementally negative rate of return. Yes, traders paid the Treasury to borrow!
Several factors pushed yields lower – notably so on the far end. Recession concerns increased despite the Fed’s rate cut. Economic news on housing and manufacturing showed the economy contracting further. Inflation expectations continued downward on the economic news combined with sharply lower oil prices. Finally, the FOMC announcement pushed rates lower. Rates were lower on the short end due to the lower target rate. Long rates fell on the Fed stating in the meeting announcement that the Fed likely will buy agency securities (Fannie Mae and Freddie Mac) to help bring down mortgage rates. The Fed stated that it is also considering buying longer maturities of Treasuries. At week, end, however, rates firmed slightly on the news that the Bush administration approved a temporary bailout of GM and Chrysler with TARP funds.
 For this past week Treasury rates were down as follows: 3-month T-bill, down 2 basis points to a yield of minus 0.01 percent; the 2-year note, down 3 basis points; the 5-year note, down 18 basis points; the 10-year bond, down 46 basis points; and the 30-year bond, down 50 basis points. For this past week Treasury rates were down as follows: 3-month T-bill, down 2 basis points to a yield of minus 0.01 percent; the 2-year note, down 3 basis points; the 5-year note, down 18 basis points; the 10-year bond, down 46 basis points; and the 30-year bond, down 50 basis points.
A combination of recession fears, Fed rating cutting, and Fed intentions of purchasing agency securities pushed Treasury yields to record lows.
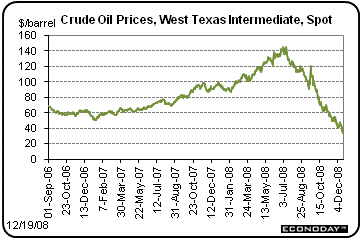 Crude oil prices ended this past week down sharply. Key factors weighing on prices were negative economic news on housing starts, industrial production, Empire State manufacturing, and Philly Fed manufacturing. The oil market focused more on economic weakness than did equity markets. Oil prices were not even lifted by the Fed’s sharper-than-expected rate cut as OPEC’s cuts were seen as not enough to offset declining demand. The expiration of the January contract on December 19 also weighed on prices. Crude oil prices ended this past week down sharply. Key factors weighing on prices were negative economic news on housing starts, industrial production, Empire State manufacturing, and Philly Fed manufacturing. The oil market focused more on economic weakness than did equity markets. Oil prices were not even lifted by the Fed’s sharper-than-expected rate cut as OPEC’s cuts were seen as not enough to offset declining demand. The expiration of the January contract on December 19 also weighed on prices.
Net for the week, spot prices for West Texas Intermediate dropped $12.41 per barrel to settle at $33.87 – and coming in $111.42 below the record settle of $145.29 per barrel set on July 3. The close is the lowest since early February 2004.
The economy continued to worsen with negative news from the housing and manufacturing sectors. However, the highlight of the week was the Fed’s unexpected cut of the fed funds target rate to near zero.
 At the end of the December 15-16 FOMC meeting, the Fed stunned the markets with a cut in the fed funds target to near zero. The Fed announced that its target is now a range – of 0.0 percent to 0.25 percent. This is down from the previous fed funds target rate of 1.0 percent. The Fed lowered the discount rate by 75 basis points from 1.25 percent to 0.50 percent. At the end of the December 15-16 FOMC meeting, the Fed stunned the markets with a cut in the fed funds target to near zero. The Fed announced that its target is now a range – of 0.0 percent to 0.25 percent. This is down from the previous fed funds target rate of 1.0 percent. The Fed lowered the discount rate by 75 basis points from 1.25 percent to 0.50 percent.
The Fed eased further due to the view that the economy is worsening while inflation pressures have eased.
"Since the Committee's last meeting, labor market conditions have deteriorated, and the available data indicate that consumer spending, business investment, and industrial production have declined. Financial markets remain quite strained and credit conditions tight. Overall, the outlook for economic activity has weakened further."
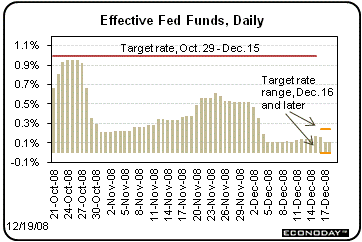 The Fed’s target of near zero is recognition that the Fed has not been able to flood the markets with liquidity AND maintain its prior target of 1 percent. Because of the surge in liquidity, the effective fed funds rate has been well below 1 percent since late October and around 1/10 of 1 percent since early December. The near zero effective fed funds rate reflects the Fed’s new policy of adding to liquidity using "quantitative easing." The Fed’s target of near zero is recognition that the Fed has not been able to flood the markets with liquidity AND maintain its prior target of 1 percent. Because of the surge in liquidity, the effective fed funds rate has been well below 1 percent since late October and around 1/10 of 1 percent since early December. The near zero effective fed funds rate reflects the Fed’s new policy of adding to liquidity using "quantitative easing."
What is quantitative easing' Quite simply, quantitative easing is the Fed’s use of its balance sheet to increase or decrease liquidity in the credit markets without changing interest rates. With the fed funds target rate range now at 0 to 0.25 percent, the Fed really has no room to lower rates further. What can the Fed do with its balance sheets to add to market liquidity' The Fed has undertaken the policy of buying commercial paper and asset backed securities. And the Fed has implemented a number of new auction facilities. These purchases are forms of quantitative easing.
But the Fed is looking at implementing even more innovative ways of improving the credit markets – some of which are already being set up to start operating early in 2009.
"As previously announced, over the next few quarters the Federal Reserve will purchase large quantities of agency debt and mortgage-backed securities to provide support to the mortgage and housing markets, and it stands ready to expand its purchases of agency debt and mortgage-backed securities as conditions warrant."
 "The Committee is also evaluating the potential benefits of purchasing longer-term Treasury securities. Early next year, the Federal Reserve will also implement the Term Asset-Backed Securities Loan Facility to facilitate the extension of credit to households and small businesses. The Federal Reserve will continue to consider ways of using its balance sheet to further support credit markets and economic activity." "The Committee is also evaluating the potential benefits of purchasing longer-term Treasury securities. Early next year, the Federal Reserve will also implement the Term Asset-Backed Securities Loan Facility to facilitate the extension of credit to households and small businesses. The Federal Reserve will continue to consider ways of using its balance sheet to further support credit markets and economic activity."
Has the quantitative easing really taken place' If you look at certain items on the Fed’s balance sheets, it is clear that the Fed has flooded the credit markets in recent months. The Term Auction Facility had average daily numbers surge from the end of October well into December. Federal Reserve Chairman Ben Bernanke has earned his old nickname of “Helicopter Ben” – reflecting the belief that at times the appropriate monetary policy simply is to flood the markets with liquidity. Money figuratively is falling from the sky.
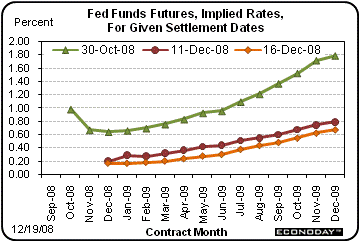 Looking ahead, the latest FOMC statement indicated "that weak economic conditions are likely to warrant exceptionally low levels of the federal funds rate for some time." Looking ahead, the latest FOMC statement indicated "that weak economic conditions are likely to warrant exceptionally low levels of the federal funds rate for some time."
The bottom line is that the Fed sees the economy in a recession that is worse than believed even a couple of months ago. With the drop in the target to a range of zero and just above, the Fed appears to be implying that rates are going to be low for some time. Indeed, the fed funds futures market expects the effective fed funds rate to stay extremely low all of 2009. Traders are betting that the effective fed funds rate does not edge back up to 0.5 percent until September or October.
The Fed still has much work to do to determine the best method or methods of implementing quantitative easing. Focus can be on the consumer sector, mortgage markets, other, or some combination. Given the futures market expectation of a near zero fed funds rate for a long time, traders have recognized that indeed Dallas Fed President Richard Fisher is right: "we have miles to go before we sleep." And the latest economic data corroborate that view.
 Industrial production in November resumed it strong downtrend after a technical rebound in October. Overall industrial production in November fell 0.6 percent, following a 1.5 percent rebound in October. Industrial production in November resumed it strong downtrend after a technical rebound in October. Overall industrial production in November fell 0.6 percent, following a 1.5 percent rebound in October.
The all-important manufacturing component dropped 1.4 percent after a 0.6 percent partial rebound the month before. The rebound in October was due to oil and chemical facilities coming back online after Hurricanes Gustav and Ike.
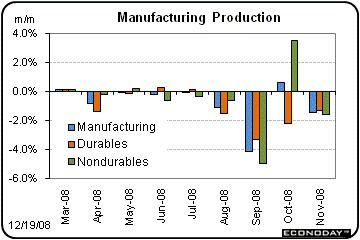 Within manufacturing, declines were widespread. Durables output fell 1.3 percent in November with the largest decline in primary metals, which fell over 7 percent for the second month due to lower output at steel mills. However, the index for aerospace did rise and was due to the return of striking workers at Boeing. Nondurables output fell 1.6 percent, led downward by chemicals which dropped 3.6 percent.
Overall capacity utilization in November dropped to 75.4 percent from 76.0 percent in October and came in lower than the consensus forecast for 75.7 percent.
On a year-on-year basis, industrial production in November stood at down 5.5 percent.
 Regional manufacturing surveys are pointing to a further worsening in manufacturing. Early indications for manufacturing in December are not good as both the Empire State and Philly Fed reports remained in deeply negative territory. The Empire State general business conditions index held little changed at minus 25.8, compared to minus 25.4 in November - indicating steady but severe month-to-month contraction in the region's manufacturing economy. Regional manufacturing surveys are pointing to a further worsening in manufacturing. Early indications for manufacturing in December are not good as both the Empire State and Philly Fed reports remained in deeply negative territory. The Empire State general business conditions index held little changed at minus 25.8, compared to minus 25.4 in November - indicating steady but severe month-to-month contraction in the region's manufacturing economy.
The Philly Fed's general business conditions index rose somewhat to minus 32.9 from minus 39.3 in November. But the negative number continues to reflect a sharply higher percentage of manufacturers reporting declines than otherwise. Both surveys have had their key index at very negative levels for the last three months.
Price readings were very soft in both reports. The prices paid indexes were particularly weak, reflecting a drop in commodities prices. The Empire prices paid index fell nearly 30 points to minus 7.5 while the Philly prices paid index fell to minus 33.2 from minus 30.7 in November. But demand also has been falling for manufacturing output. The New York Fed’s prices received index fell more than 20 points to minus 11.7. Meanwhile, the Philly Fed prices received index dropped sharply to minus 37.8 from minus 15.5 the month before.
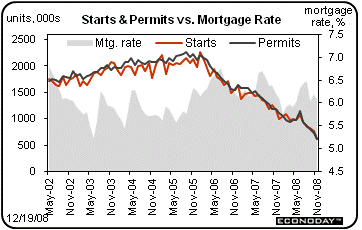 Housing starts in November plummeted further, weighed down by massive unsold inventories of new and existing houses on the market. Starts plummeted another 18.9 percent, following a 6.4 percent decrease the prior month. The November pace of 0.625 million units annualized was down 47.0 percent year-on-year. The decline in starts was led by the multifamily component which declined 23.3 percent while the single-family component fell 16.9 percent. Housing starts in November plummeted further, weighed down by massive unsold inventories of new and existing houses on the market. Starts plummeted another 18.9 percent, following a 6.4 percent decrease the prior month. The November pace of 0.625 million units annualized was down 47.0 percent year-on-year. The decline in starts was led by the multifamily component which declined 23.3 percent while the single-family component fell 16.9 percent.
By region, the decline in starts was led by a monthly 34.6 percent drop in the Northeast. Starts also fell sharply in other regions with the Midwest down 23.1 percent; the West, down 16.8 percent; and the South down 15.6 percent for the month.
Until unsold inventories come down, we will continue to see downward pressure on starts. November’s 0.625 pace is the historical low for a series that goes back to 1959.
 Lower oil prices and a worldwide drop in demand have softened consumer price inflation – especially at the headline level. The consumer price index fell for the fourth month in row due to lower energy costs. The headline CPI dropped 1.7 percent in November, following a 1.0 percent decrease in October. September is reported as no change but before rounding the CPI edged down incrementally. Lower oil prices and a worldwide drop in demand have softened consumer price inflation – especially at the headline level. The consumer price index fell for the fourth month in row due to lower energy costs. The headline CPI dropped 1.7 percent in November, following a 1.0 percent decrease in October. September is reported as no change but before rounding the CPI edged down incrementally.
Weakness in consumer price inflation is broad-based as the core rate remained low. The core rate in November was unchanged and followed a 0.1 percent outright decline in October. Keeping the core rate soft were declines in lodging while away from home, new and used vehicles, and public transportation (includes airline fares). Also, other categories were flat or showed modest increases.
Indeed, the energy component was responsible for the sharp drop in the headline number as this component fell a monthly 17.0 percent, pulled down by a 29.5 percent plunge in gasoline prices. Food rose a modest 0.2 percent.
Year-on-year, headline inflation is up 1.0 percent (seasonally adjusted) in November while the core is up 2.0 percent. Taking into account that CPI inflation typically runs a quarter percentage point higher than PCE price indexes (due to differences in methodologies), the latest CPI numbers are well within the Fed’s implicit target range for 1-1/2 to 2 percent annualized inflation.
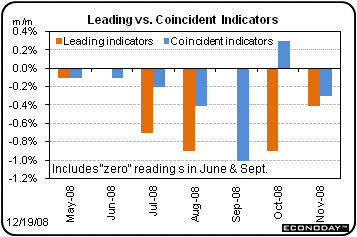 The index of leading indicators fell again, pointing to continuing decline in the U.S. economy. The leading index fell 0.4 percent in November, following a 0.9 percent drop the month before. The latest decrease was lead by declines in building permits, stock prices, and a rise in unemployment claims. The index of coincident indicators, resumed its downward trend with a 0.3 percent decline after a 0.3 percent technical rebound in October. Industrial production had boosted this index in October on a rebound in activity in areas hit by hurricanes. The index of leading indicators fell again, pointing to continuing decline in the U.S. economy. The leading index fell 0.4 percent in November, following a 0.9 percent drop the month before. The latest decrease was lead by declines in building permits, stock prices, and a rise in unemployment claims. The index of coincident indicators, resumed its downward trend with a 0.3 percent decline after a 0.3 percent technical rebound in October. Industrial production had boosted this index in October on a rebound in activity in areas hit by hurricanes.
The recession is continuing to worsen as indicated by manufacturing and housing data. The fourth quarter and first quarter both are likely to be significantly negative. We certainly do not have any first quarter data but we do know that auto manufacturers are shutting down during most if not all of January and that will reverberate throughout the economy. But the Fed is taking aggressive action to improve credit markets and boost lending. Recovery is in the works – but it is going to take some time to get here.
The two market movers this week are GDP and personal income. Also getting market attention will be new and existing home sales reports.
GDP for the third quarter came in at a minus 0.5 percent for the first revision from the initial estimate of a 0.3 percent dip. The downward revision to GDP was due to stronger declines in PCEs and nonresidential fixed investment along with slower growth in government purchases and a slightly wider net export deficit. These were partially offset by a somewhat less of a decline in residential investment and in inventories. Turning to inflation, the GDP price index was unrevised to an annualized 4.2 percent. The final revision to the third quarter likely will get little attention as the world has changed considerably since the third quarter – both growth and inflation are sharply lower in the fourth quarter.
Real GDP Consensus Forecast for final Q3 08: -0.5 percent annual rate
Range: -0.8 to -0.5 percent annual rate
GDP price index Consensus Forecast for final Q3 08: +4.2 percent annual rate
Range: +2.6 to +4.2 percent annual rate
The Reuter's/University of Michigan's Consumer sentiment index bounced higher during the first part of December -- but only from record low levels. Reuters/University of Michigan's consumer sentiment index rose to 59.1 from 55.3 in November. Inflation expectations are really coming down. Inflation expectations for one year out fell 1.2 percentage points to 1.7 percent. Expectations for five years out slipped 2 tenths to 2.7 percent.
Consumer sentiment Consensus Forecast for final Dec 08: 58.6
Range: 53.6 to 60.2
Existing home sales fell 3.1 percent in October to an annualized pace of 4.98 million. There are signs that sales have hit bottom as the year-ago pace is down only 1.6 percent – reflecting modest up and down movement over the past year. Still October’s level was anemic – being down 31.3 percent from the historical
peak of 7.25 million. But what has helped induce the likely bottom is a sharp decline in prices. The median sales price of an existing home fell a very steep 4.2 percent in October to $183,300, a level last seen in first quarter 2004. The year-on-year decrease of 11.9 percent is the worst in 10 years of available data. Supply on the market remains extremely swollen, at 4.23 million units for 10.2 months of supply, up from 10.0 in September.
Existing home sales Consensus Forecast for November 08: 4.90 million-unit rate
Range: 4.75 to 5.04 million-unit rate
New home sales - in contrast to existing home sales – have not shown signs of bottoming as sales fell 5.3 percent in October to an annualized pace of 433,000. The latest month is down 40.1 percent on a year-ago basis and down 68.8 percent from the historical high of 1.389 million units set in July 2005. The October level is a pace last seen in the 1991 recession, more than 17 years ago. Prices continued to weaken with a 1.7 percent dip in the latest month to a median sales price of $218,000 – which is down 7.0 percent on a year-ago basis.
New home sales Consensus Forecast for November 08: 420 thousand-unit annual rate
Range: 360 thousand to 490 thousand-unit annual rate
Durable goods orders plunged 6.9 percent in October (initially reported as down 6.2 percent). An 11.2 percent drop in transportation orders played a key role pulling down the overall numbers. Nonetheless, weakness was widespread with ex-transportation orders falling 5.4 percent in the latest month.
New orders for durable goods Consensus Forecast for November 08: -3.0 percent
Range: -8.0 percent to +3.0 percent
New orders for durable goods, ex-trans., Consensus Forecast for November 08: -3.0 percent
Range: -4.2 percent to 0.0 percent
Personal income in October posted a moderate gain – but strength was due to a temporary factor. Personal income in October rose 0.3 percent in October, following a 0.1 percent rise in September. But strength for the month was temporary and due to a rebound in rental income. Rental income had been depressed in September due to hurricanes. The wages and salaries component, however, was soft – nudged 0.1 percent after a 0.1 percent dip in September. Consumers cut back on shopping in the latest month as personal consumption expenditures plummeted 1.0 percent, following a 0.3 percent decline the month before. On the inflation front, the headline PCE price index dropped 0.6 percent on a plunge in energy. The core PCE price index was unchanged, following a 0.2 percent rise in September.
Personal income Consensus Forecast for November 08: 0.0 percent
Range: -0.3 to +0.3 percent
Personal consumption expenditures Consensus Forecast for November 08: -0.7 percent
Range: -1.5 to -0.3 percent
Core PCE price index Consensus Forecast for November 08, m/m: 0.0 percent
Range: -0.3 to +0.2 percent
Core PCE price index Consensus Forecast for November 08, y/y: +2.0 percent
Range: +2.0 to +2.0 percent
Initial jobless claims for the December 13 week came off the prior week’s spike, slipping 21,000 to 554,000. The four-week average came in at 543.75, up 2,750 for the week. Initial claims may have come off problems with timing of claims after the Thanksgiving holiday week. However, the latest numbers are still elevated and are certain to rise based on announced shutdowns in manufacturing and other industries.
Jobless Claims Consensus Forecast for 12/20/08: 552,000
Range: 535,000 to 587,000
U.S. Holiday: Christmas Day. All Markets Closed.
SIFMA Recommended Early Close 2:00 ET
New Year’s week is rather quiet. The only market mover is the ISM manufacturing index. However, motor vehicles sales may get more attention than usual as traders will be watching to see how much bankruptcy rumors have hurt Big Three sales.
The Conference Board's consumer confidence index was mixed in November – slipping for current conditions but showing improvement in the economic outlook. The overall index rose to 44.9 from 38.8 in October – largely on the expectations component. The expectations index, the report's main component that makes up 60 percent of the headline index, rose more than 10 points to 46.7. The gain reflects improvement across future sub-components including jobs where more see more jobs ahead and fewer respondents see fewer jobs ahead. But for the current assessment, the reverse is true. The present situation index, a component making up the other 40 percent of the headline index, fell 1.3 points to 42.2. Buying plans pose some of the worst news in the report, showing serious declines for cars, houses and appliances.
Consumer confidence Consensus Forecast for December 08: 45.0
Range: 40.0 to 50.2
Initial jobless claims are due out for the week ending December 27.
Jobless Claims Consensus Forecast for 12/27/08: NA
Range: NA to NA
The NAPM-Chicago purchasing managers' index posted a large drop in November, falling 4 points to 33.8. Weakness was particularly severe in new and backlog orders. New orders fell more than 5 points to 27.2 while backlog orders dropped nearly 11 points to 28.2. Prices paid, at 50.7, was the only index over the 50 level that indicates month-to-month growth. But this index, given declines underway in energy and material prices, appears certain to dip well below 50 in the reading for December.
NAPM-Chicago Consensus Forecast for December 08: 33.0
Range: 28.0 to 42.1
SIFMA Recommended Early Close 2:00 ET
U.S. Holiday: New Year’s Day. All Markets Closed
Sales of domestic motor vehicles remained depressed in November at a 7.5 million annual unit rate - little changed from October. Levels unfortunately are at lows not seen since the early 1980s. As low as November levels were we could see still lower sales in December as unemployment has spiked and concerns have risen over automakers going into bankruptcy.
Motor vehicle domestic sales Consensus Forecast for December 08: NA million-unit rate
Range: NA to NA million-unit rate
The Institute for Supply Management's manufacturing index contracted further in November as the headline index fell nearly 3 points to 36.2. The reading is the lowest since 1980 recession. Key components in the survey showed greater weakness than the headline index including a 31.5 level for the production index that matched the record low in May 1980. The new orders index at 27.9 is at its lowest since the early 1980s. Perhaps the most stunning reading of all, prices paid was 25.5 - down 11.5 points in the month and the lowest reading since early data in 1949.
ISM manufacturing index Consensus Forecast for December 08: 35.5
Range: 33.0 to 40.0
SIFMA Recommended Early Close 2:00 ET
Econoday Senior Writer Mark Pender contributed to this article.
|

![[Econoday]](images/econoday_logo_slim.gif)
![[Econoday]](images/logo.gif)


 Stocks were mostly up this past week with the Fed’s lowering its target rate to near zero juicing stocks just after Tuesday’s FOMC statement. Also, adding to the general good mood was an announcement at week's end that the Bush administration would be loaning GM and Chrysler $17.4 billion of TARP funds ($13.4 billion will be available immediately with another $4 billion to be released in February).
 Treasury yields hit historic lows this past week with the 3-month T-bill even closing with an incrementally negative rate of return. Yes, traders paid the Treasury to borrow!
 For this past week Treasury rates were down as follows: 3-month T-bill, down 2 basis points to a yield of minus 0.01 percent; the 2-year note, down 3 basis points; the 5-year note, down 18 basis points; the 10-year bond, down 46 basis points; and the 30-year bond, down 50 basis points.
  Crude oil prices ended this past week down sharply. Key factors weighing on prices were negative economic news on housing starts, industrial production, Empire State manufacturing, and Philly Fed manufacturing. The oil market focused more on economic weakness than did equity markets. Oil prices were not even lifted by the Fed’s sharper-than-expected rate cut as OPEC’s cuts were seen as not enough to offset declining demand. The expiration of the January contract on December 19 also weighed on prices.
 At the end of the December 15-16 FOMC meeting, the Fed stunned the markets with a cut in the fed funds target to near zero. The Fed announced that its target is now a range – of 0.0 percent to 0.25 percent. This is down from the previous fed funds target rate of 1.0 percent. The Fed lowered the discount rate by 75 basis points from 1.25 percent to 0.50 percent.
 The Fed’s target of near zero is recognition that the Fed has not been able to flood the markets with liquidity AND maintain its prior target of 1 percent. Because of the surge in liquidity, the effective fed funds rate has been well below 1 percent since late October and around 1/10 of 1 percent since early December. The near zero effective fed funds rate reflects the Fed’s new policy of adding to liquidity using "quantitative easing."
  "The Committee is also evaluating the potential benefits of purchasing longer-term Treasury securities. Early next year, the Federal Reserve will also implement the Term Asset-Backed Securities Loan Facility to facilitate the extension of credit to households and small businesses. The Federal Reserve will continue to consider ways of using its balance sheet to further support credit markets and economic activity."
 Looking ahead, the latest FOMC statement indicated "that weak economic conditions are likely to warrant exceptionally low levels of the federal funds rate for some time."
  Industrial production in November resumed it strong downtrend after a technical rebound in October. Overall industrial production in November fell 0.6 percent, following a 1.5 percent rebound in October.
  Within manufacturing, declines were widespread. Durables output fell 1.3 percent in November with the largest decline in primary metals, which fell over 7 percent for the second month due to lower output at steel mills. However, the index for aerospace did rise and was due to the return of striking workers at Boeing. Nondurables output fell 1.6 percent, led downward by chemicals which dropped 3.6 percent.
 Regional manufacturing surveys are pointing to a further worsening in manufacturing. Early indications for manufacturing in December are not good as both the Empire State and Philly Fed reports remained in deeply negative territory. The Empire State general business conditions index held little changed at minus 25.8, compared to minus 25.4 in November - indicating steady but severe month-to-month contraction in the region's manufacturing economy.
  Housing starts in November plummeted further, weighed down by massive unsold inventories of new and existing houses on the market. Starts plummeted another 18.9 percent, following a 6.4 percent decrease the prior month. The November pace of 0.625 million units annualized was down 47.0 percent year-on-year. The decline in starts was led by the multifamily component which declined 23.3 percent while the single-family component fell 16.9 percent.
 Lower oil prices and a worldwide drop in demand have softened consumer price inflation – especially at the headline level. The consumer price index fell for the fourth month in row due to lower energy costs. The headline CPI dropped 1.7 percent in November, following a 1.0 percent decrease in October. September is reported as no change but before rounding the CPI edged down incrementally.
  The index of leading indicators fell again, pointing to continuing decline in the U.S. economy. The leading index fell 0.4 percent in November, following a 0.9 percent drop the month before. The latest decrease was lead by declines in building permits, stock prices, and a rise in unemployment claims. The index of coincident indicators, resumed its downward trend with a 0.3 percent decline after a 0.3 percent technical rebound in October. Industrial production had boosted this index in October on a rebound in activity in areas hit by hurricanes.