|
In years past, when July and August came around, I would wonder what I would write about during the long summer doldrums. That has not been an issue lately — if anything it has been how can I condense everything into one article and not have it become a novella.
The week was dominated by U.S. rescue plans for Fannie Mae and Freddie Mac, the two quasi-government mortgage lenders. Also dominating attention was Fed Chairman Ben Bernanke’s semi-annual testimony to Congress. Several key firms, including major financial firms, released earnings reports as well, most of which were less weak than expected.
Market sentiment was so negative at the end of the prior week that Washington felt compelled to make their Fannie Mae and Freddie Mac announcements prior to Monday openings in Asia (Sunday dinner time on the U.S. east coast). But for the markets, credibility was scarce. Investors were reluctant to accept the reassurances proffered and equities along with the dollar headed south.
The U.S. Treasury and Federal Reserve announced steps to support troubled mortgage companies Fannie Mae and Freddie Mac. Treasury Secretary Henry Paulson said he will seek approval to expand the government's line of credit to the agencies and allow the Treasury to acquire equity capital in the companies, if necessary. Both moves will require Congressional authorization. The Federal Reserve, meanwhile, said it would open its discount lending window to provide additional credit to the agencies if they need the funds.
Fed Chairman Ben Bernanke gave his semi-annual testimony to the Senate Committee on Banking, Housing, and Urban Affairs, and House of Representatives Financial Services Committee on Tuesday and Wednesday. While the prepared testimony was the same, the questions, especially in an election year ran the gamut with many far from the Fed’s remit. The prepared testimony had little to offer but uncomfortable truths, especially when, just prior to his testimony, data for June showed that consumer inflation had spiked to 5 percent. He said there were significant downside risks to the economy’s outlook. He also said the chances that high inflation will persist have intensified.
On the week, stocks in India, Europe, the UK and the U.S. managed to gain despite volatility.
|
|
2007 |
2008 |
% Change |
|
Index |
Dec 31 |
Jul 11 |
Jul 18 |
Week |
Year |
| Asia |
|
|
|
|
|
|
| Australia |
All Ordinaries |
6421.0 |
5067.8 |
4915.3 |
-3.0% |
-23.4% |
| Japan |
Nikkei 225 |
15307.8 |
13039.7 |
12803.7 |
-1.8% |
-16.4% |
|
Topix |
1475.7 |
1285.9 |
1252.4 |
-2.6% |
-15.1% |
| Hong Kong |
Hang Seng |
27812.7 |
22184.6 |
21874.2 |
-1.4% |
-21.4% |
| S. Korea |
Kospi |
1897.1 |
1567.5 |
1510.0 |
-3.7% |
-20.4% |
| Singapore |
STI |
3482.3 |
2926.8 |
2847.7 |
-2.7% |
-18.2% |
| China |
Shanghai Composite |
5261.6 |
2856.6 |
2778.4 |
-2.7% |
-47.2% |
|
|
|
|
|
|
|
| India |
Sensex 30 |
20287.0 |
13469.9 |
13635.4 |
1.2% |
-32.8% |
| Indonesia |
Jakarta Composite |
2745.8 |
2276.9 |
2141.1 |
-6.0% |
-22.0% |
| Malaysia |
KLSE Composite |
1445.0 |
1150.4 |
1105.0 |
-3.9% |
-23.5% |
| Philippines |
PSEi |
3621.6 |
2438.0 |
2389.5 |
-2.0% |
-34.0% |
| Taiwan |
Taiex |
8506.3 |
7244.8 |
6815.3 |
-5.9% |
-19.9% |
| Thailand |
SET |
858.1 |
730.3 |
664.5 |
-9.0% |
-22.6% |
|
|
|
|
|
|
|
| Europe |
|
|
|
|
|
|
| UK |
FTSE 100 |
6456.9 |
5261.60 |
5376.40 |
2.2% |
-16.7% |
| France |
CAC |
5614.1 |
4100.64 |
4299.36 |
4.8% |
-23.4% |
| Germany |
XETRA DAX |
8067.3 |
6153.30 |
6382.65 |
3.7% |
-20.9% |
|
|
|
|
|
|
|
| North America |
|
|
|
|
|
|
| United States |
Dow |
13264.8 |
11100.54 |
11496.57 |
3.6% |
-13.3% |
|
NASDAQ |
2652.3 |
2239.08 |
2282.78 |
2.0% |
-13.9% |
|
S&P 500 |
1468.4 |
1239.49 |
1260.68 |
1.7% |
-14.1% |
| Canada |
S&P/TSX Comp. |
13833.1 |
13709.10 |
13515.96 |
-1.4% |
-2.3% |
| Mexico |
Bolsa |
29536.8 |
28338.1 |
28169.77 |
2.0% |
-4.6% |
 The FTSE, CAC and DAX ended another turbulent week — but this time on a positive note. It was the first week in nine that the FTSE was up while it was the first week in seven for the CAC and DAX. An outbreak of optimism in the financial sector combined with lower crude prices helped generate gains. Financial and technology stocks beat earnings forecasts while JPMorgan eased concern about growing credit losses and declining consumer spending. And some banks reported losses — but they were less than anticipated — and investors exhaled. On the week, the CAC was up 4.8 percent, the DAX was up 3.7 percent while the FTSE gained 2.2 percent. The FTSE, CAC and DAX ended another turbulent week — but this time on a positive note. It was the first week in nine that the FTSE was up while it was the first week in seven for the CAC and DAX. An outbreak of optimism in the financial sector combined with lower crude prices helped generate gains. Financial and technology stocks beat earnings forecasts while JPMorgan eased concern about growing credit losses and declining consumer spending. And some banks reported losses — but they were less than anticipated — and investors exhaled. On the week, the CAC was up 4.8 percent, the DAX was up 3.7 percent while the FTSE gained 2.2 percent.
On Tuesday, stocks sank as investors sold banking stocks amidst growing uneasiness about the ongoing mortgage crisis. But a sharp drop in crude oil prices helped limit the decline. And Federal Reserve Chairman Ben Bernanke did not help when he stated the obvious — financial markets and institutions remain under considerable stress. In his prepared remarks for Congress, Bernanke said a weakening housing market, tighter credit and rising oil prices threatened the economy.
Economic news centered on inflation data. In the UK and Germany producer prices soared. And consumer inflation in the UK and the eurozone spiked respectively to 3.8 percent and 4 percent (a new record and the highest level since the euro was introduced in 1999). They were not alone. In the U.S., consumer inflation soared by 5 percent. A steep drop in crude oil prices back to around $130 per barrel offered some much needed respite to U.S. and European equity markets on Wednesday and Thursday and helped the dollar pull away from Tuesday’s record low against the euro. Although declining oil prices helped stocks of energy intensive companies such as airlines and motor vehicles it did not boost resource equities. And German investor confidence contributed to investor malaise when it dropped to the lowest since the data was first compiled in December 1991.
 All Asian/Pacific equity indexes followed here were down last week with the exception of the Indian Sensex. That index responded positively to the drop in crude prices. Investors there were also heartened by a less than anticipated increase in the weekly wholesale price index. Analysts expected the increase to exceed 12 percent, but the inflation rate for the recent week came in at 11.91 percent and surprised traders. All Asian/Pacific equity indexes followed here were down last week with the exception of the Indian Sensex. That index responded positively to the drop in crude prices. Investors there were also heartened by a less than anticipated increase in the weekly wholesale price index. Analysts expected the increase to exceed 12 percent, but the inflation rate for the recent week came in at 11.91 percent and surprised traders.
Losses were heavy on the week, with the Thailand SET leading the flow of red ink. The index lost 9 percent in a holiday shortened trading week while both Taiwan’s Taiex and Indonesia’s Jakarta Composite were down 5.9 percent. Investors sold stocks after the Bank of Thailand increased its interest rate to 3.5 percent.
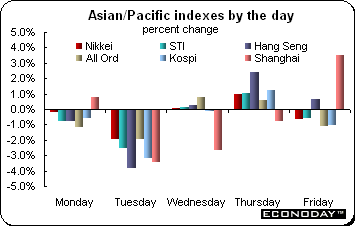 Chinese stocks continued their downward trajectory, losing 2.7 percent last week. The Shanghai Composite is now down 47.2 percent in 2008. The index dropped Thursday after second quarter gross domestic product slowed and persistent pressures from producer prices weighed on investor sentiment as concerns over profits intensified. China’s second quarter GDP growth slowed to 10.1 percent from 10.6 percent in the first. But according to analysts, the slowdown in growth should not be surprising given that monetary policy has been tightened progressively and in various ways since the start of last year. Chinese stocks continued their downward trajectory, losing 2.7 percent last week. The Shanghai Composite is now down 47.2 percent in 2008. The index dropped Thursday after second quarter gross domestic product slowed and persistent pressures from producer prices weighed on investor sentiment as concerns over profits intensified. China’s second quarter GDP growth slowed to 10.1 percent from 10.6 percent in the first. But according to analysts, the slowdown in growth should not be surprising given that monetary policy has been tightened progressively and in various ways since the start of last year.
Stocks in Hong Kong were very volatile during the week as they were elsewhere. For example, the Hang Seng sank 3.8 percent (839.7 points) Tuesday only to bounce back on Thursday with a gain of 2.4 percent (511.2 points). Bank stock performance was an integral part of the volatility. When trading ended Friday, the Hang Seng was down 1.4 percent for the week and is now down 21.4 percent in 2008.
Crude’s price decline to below $140 a barrel hurt resource shares especially in Australia and adding to investor pain. The all ordinaries was down for the ninth consecutive week. While lower oil prices provided some much needed relief for airlines, mineral related industries were sold. High interest rates are finally pinching the economy. The Reserve Bank of Australia enacted a policy rate of 7.25 percent in order to calm the red-hot economy and control rampant inflation.
Bank of Japan
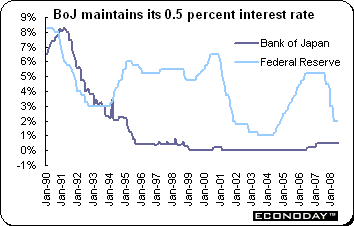 As expected, the Bank of Japan kept its key interest rate steady at 0.5 percent after its two-day meeting as soaring energy and commodity prices continue to erode incomes and discourage business and household spending. The rate is the lowest among the major economies. The Bank acknowledged the increasing impact of global problems on the economy and lowered its growth forecast while at the same time, upped its prediction for inflation. Growth for the fiscal year ending March 2009 is now estimated at 1.2 percent, down from its April forecast of 1.5 percent while inflation — which has been fuelled by higher oil and food prices — has been revised from 1.1 percent to 1.8 percent. As expected, the Bank of Japan kept its key interest rate steady at 0.5 percent after its two-day meeting as soaring energy and commodity prices continue to erode incomes and discourage business and household spending. The rate is the lowest among the major economies. The Bank acknowledged the increasing impact of global problems on the economy and lowered its growth forecast while at the same time, upped its prediction for inflation. Growth for the fiscal year ending March 2009 is now estimated at 1.2 percent, down from its April forecast of 1.5 percent while inflation — which has been fuelled by higher oil and food prices — has been revised from 1.1 percent to 1.8 percent.
At his press conference, BoJ governor Masaaki Shirakawa said that the combination of lower growth and higher inflation did not mean the economy was in stagflation. Rather, he said that “we believe the possibility is relatively high that the economy will remain on a sustainable growth path with price stability." He said that inflation would eventually subside as the impact of higher energy and food prices waned. The BoJ also announced measures designed to bring greater clarity to its communications, including a three-year growth and inflation forecast to be included in its six-month outlook report.
In a speech given later in the week, governor Shirakawa noted that the BoJ currently gives equal weight to both downside risks to the economy and upside risks to consumer prices. He emphasized that they were equally balanced. Shirakawa explained that the Bank is watching various risks to the economy, saying that deteriorating terms of trade — that is the price of a country's exports relative to imports — are hurting corporate profits and consumer spending. The governor repeated that the BoJ believes the economy will likely return to a path of moderate growth over time, citing Japan's relatively stable financial markets, the economy's growing resilience to external shocks and the likelihood of improvements in the global economy.
Bangko Sentral ng Pilipinas and Bank of Thailand up interest rates
Bangko Sentral ng Pilipinas increased the rate it pays banks for overnight borrowing or reverse repurchase facility by 50 basis points to 5.75 percent and to 7.75 percent for the overnight lending 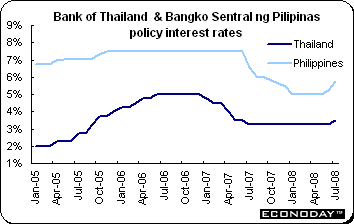 or repurchase facility. According to the Bank’s post-meeting statement, it said that controlling inflation is its foremost priority. It noted that “concurrent and interrelated shocks to the economy — such as the persistent surge in oil prices and spikes in commodity prices — have contributed to elevated inflation readings. Second-round effects have set in, as evident in the rise in core inflation.” The Bank increased its 2008 inflation estimate to a range of 9 percent to 11 percent from a previous prediction of 7 percent to 9 percent, citing a weak peso and higher food, transportation and energy costs. The inflation target, defined in terms of the average year-on-year change in the consumer price index (CPI) over the calendar year, is 4 percent with a tolerance interval of plus 1 percentage point for 2009. or repurchase facility. According to the Bank’s post-meeting statement, it said that controlling inflation is its foremost priority. It noted that “concurrent and interrelated shocks to the economy — such as the persistent surge in oil prices and spikes in commodity prices — have contributed to elevated inflation readings. Second-round effects have set in, as evident in the rise in core inflation.” The Bank increased its 2008 inflation estimate to a range of 9 percent to 11 percent from a previous prediction of 7 percent to 9 percent, citing a weak peso and higher food, transportation and energy costs. The inflation target, defined in terms of the average year-on-year change in the consumer price index (CPI) over the calendar year, is 4 percent with a tolerance interval of plus 1 percentage point for 2009.
The Bank of Thailand increased its key interest rate for the first time in two years to combat the fastest inflation in a decade and said further increases are possible. The Bank’s one-day bond repurchase rate was increased by 25 basis points to 3.50 percent. Surging oil and food prices are forcing central banks from Vietnam to Pakistan to raise borrowing costs even as a U.S. slowdown hurts demand for Asian exports and erodes growth. The Bank has an inflation target range of 0 to 3.5 percent. June CPI was up 1.2 percent on the month and 8.9 percent on the year.
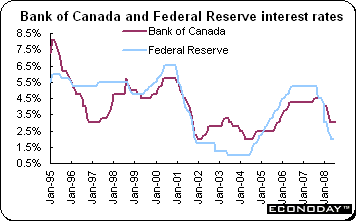 As expected, the Bank of Canada kept its key interest rate at 3 percent. At its previous meeting on June 10, the Bank surprised analysts by keeping its policy rate unchanged at 3 percent. At the time and in subsequent remarks by Governor Carney, the Bank has expressed some unease about underlying inflation although the risks remained evenly balanced. Canadian inflation is tame compared with that in Europe and the United States. May CPI was up 2.2 percent on the year. This was higher than April’s increase of 1.7 percent. And food and energy prices have soared as well. The post-meeting statement said that risks now are balanced between growth and inflation. As expected, the Bank of Canada kept its key interest rate at 3 percent. At its previous meeting on June 10, the Bank surprised analysts by keeping its policy rate unchanged at 3 percent. At the time and in subsequent remarks by Governor Carney, the Bank has expressed some unease about underlying inflation although the risks remained evenly balanced. Canadian inflation is tame compared with that in Europe and the United States. May CPI was up 2.2 percent on the year. This was higher than April’s increase of 1.7 percent. And food and energy prices have soared as well. The post-meeting statement said that risks now are balanced between growth and inflation.
The Bank released its Monetary Policy Report update Thursday. Governor Mark Carney said that the Canadian economy is on the verge of beginning a recovery from the downturn that it experienced earlier this year. The Bank projects that the Canadian economy will grow by 1.4 percent this year, 2.4 percent in 2009, and 3.3 per cent in 2010. The emergence of excess supply in the economy should keep inflation below 2 per cent through 2009. Both core and total inflation are projected to move up to 2 percent in 2010 as the economy moves back into balance. There are both upside and downside risks to the Bank's new projection for inflation, but these risks appear to be balanced.
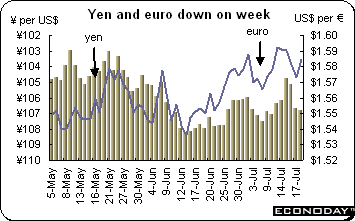 The dollar rebounded against the euro after dropping to an all time low of $1.6038 in intraday trading on Tuesday July 15. But the dollar firmed on signs U.S. investment banks would withstand credit-market losses stemming from the collapse of the subprime-mortgage market. The dollar also rebounded from mid-week lows against the yen to end the week up marginally. The yen lost ground against higher-yielding currencies as firming confidence lifted risk appetite, reducing the safe-haven yen’s attractiveness. The dollar gained against the yen Friday after Citigroup issued its earnings report. The dollar rebounded against the euro after dropping to an all time low of $1.6038 in intraday trading on Tuesday July 15. But the dollar firmed on signs U.S. investment banks would withstand credit-market losses stemming from the collapse of the subprime-mortgage market. The dollar also rebounded from mid-week lows against the yen to end the week up marginally. The yen lost ground against higher-yielding currencies as firming confidence lifted risk appetite, reducing the safe-haven yen’s attractiveness. The dollar gained against the yen Friday after Citigroup issued its earnings report.
The dollar’s ups and downs have become closely tied to that of the financial sector in recent weeks. The dollar therefore benefited after Wells Fargo earnings beat estimates mid-week and losses of other financial firms were less than anticipated. The dollar was also helped by declining crude prices. Of late, the dollar has declined when oil prices have increased. The dollar drifted on Friday after early morning earnings news. There were no U.S. economic data Friday.
Ben Bernanke stirred dollar interest after he remarked to the House of Representatives that currency intervention was sometimes justified, but only rarely.
Selected currencies — weekly results
|
|
2007 |
2008 |
% change |
|
|
Dec 31 |
July 11 |
July 18 |
Week |
Year |
| U.S. $ per currency |
|
|
|
|
|
|
| Australia |
A$ |
0.878 |
0.966 |
0.970 |
0.4% |
10.6% |
| New Zealand |
NZ$ |
0.774 |
0.761 |
0.761 |
0.0% |
-1.7% |
| Canada |
C$ |
1.012 |
0.991 |
0.994 |
0.3% |
-1.8% |
| Eurozone |
euro (€) |
1.460 |
1.593 |
1.585 |
-0.5% |
8.5% |
| UK |
pound sterling (£) |
1.984 |
1.988 |
1.998 |
0.5% |
0.7% |
|
|
|
|
|
|
|
| Currency per U.S. $ |
|
|
|
|
|
|
| China |
yuan |
7.295 |
6.834 |
6.817 |
0.3% |
7.0% |
| Hong Kong |
HK$* |
7.798 |
7.805 |
7.798 |
0.1% |
0.0% |
| India |
rupee |
39.410 |
42.885 |
42.520 |
0.9% |
-7.3% |
| Japan |
yen |
111.710 |
106.375 |
106.934 |
-0.5% |
4.5% |
| Malaysia |
ringgit |
3.306 |
3.233 |
3.244 |
-0.3% |
1.9% |
| Singapore |
Singapore $ |
1.436 |
1.357 |
1.353 |
0.3% |
6.1% |
| South Korea |
won |
935.800 |
1000.400 |
1013.500 |
-1.3% |
-7.7% |
| Taiwan |
Taiwan $ |
32.430 |
30.420 |
30.320 |
0.3% |
7.0% |
| Thailand |
baht |
29.500 |
33.660 |
33.315 |
1.0% |
-11.5% |
| Switzerland |
Swiss franc |
1.133 |
1.017 |
1.022 |
-0.6% |
10.9% |
|
|
|
|
|
|
|
| *Pegged to U.S. dollar |
|
|
|
|
|
|
| Source: Bloomberg |
|
|
|
|
|
|
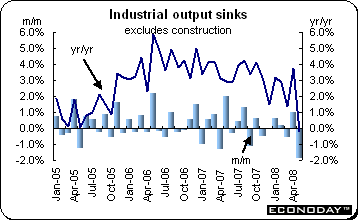 May industrial production sank by 1.9 percent and declined 0.2 percent when compared with the previous year. All of the major sectors posted sizeable monthly declines. Durable consumer goods (down 3.3 percent) were the weakest performer but capital goods (down 2.4 percent) were not far behind and both intermediates (down 1.4 percent) and non-durables consumer goods (down 1.2 percent) saw easily their largest declines so far this year. Energy output shrank by 2.7 percent. By region, production fell heavily in all member states providing data with the exception of Ireland (up 13.3 percent). Germany (2.6 percent), France (2.6 percent), Italy (1.4 percent) and Spain (2.6 percent) all fared badly and there were even more marked declines in Portugal (5.7 percent), the Netherlands (6.0 percent), and Greece (4.5 percent). May industrial production sank by 1.9 percent and declined 0.2 percent when compared with the previous year. All of the major sectors posted sizeable monthly declines. Durable consumer goods (down 3.3 percent) were the weakest performer but capital goods (down 2.4 percent) were not far behind and both intermediates (down 1.4 percent) and non-durables consumer goods (down 1.2 percent) saw easily their largest declines so far this year. Energy output shrank by 2.7 percent. By region, production fell heavily in all member states providing data with the exception of Ireland (up 13.3 percent). Germany (2.6 percent), France (2.6 percent), Italy (1.4 percent) and Spain (2.6 percent) all fared badly and there were even more marked declines in Portugal (5.7 percent), the Netherlands (6.0 percent), and Greece (4.5 percent).
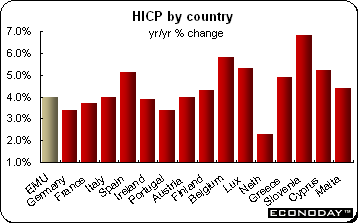 June harmonized index of consumer prices was up 0.4 percent and 4 percent when compared with last year. Core HICP excluding energy and non-processed food was up a modest 0.1 percent on the month and 2.5 percent on the year. Excluding food, drink, tobacco & petroleum the HICP was up 1.8 percent. Simply excluding energy, inflation was unchanged at 2.6 percent. June harmonized index of consumer prices was up 0.4 percent and 4 percent when compared with last year. Core HICP excluding energy and non-processed food was up a modest 0.1 percent on the month and 2.5 percent on the year. Excluding food, drink, tobacco & petroleum the HICP was up 1.8 percent. Simply excluding energy, inflation was unchanged at 2.6 percent.
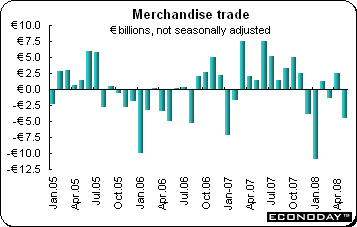 May unadjusted merchandise trade deficit was €4.6 billion after a surplus of €2.5 billion in April. The seasonally adjusted merchandise trade balance swung back into a sizeable deficit of €1.5 billion in May. The sharp deterioration from a markedly smaller revised surplus of €1.4B in April reflected a 3.4 percent monthly decline in exports that more than offset a 1.3 percent drop in imports. Both declines followed unusually large increases in April. The largest positive impact on the overall trade position in May was made by Germany (€6.6 billion). France, Italy and Spain all registered deficits. Over the first four months of 2008, the unadjusted data show especially strong annual export growth to Russia (24 percent), Poland (22 percent) and China (19 percent). On the same basis, imports have been particularly robust from Russia (24 percent), Poland (23 percent) and the Czech Republic (16 percent). May unadjusted merchandise trade deficit was €4.6 billion after a surplus of €2.5 billion in April. The seasonally adjusted merchandise trade balance swung back into a sizeable deficit of €1.5 billion in May. The sharp deterioration from a markedly smaller revised surplus of €1.4B in April reflected a 3.4 percent monthly decline in exports that more than offset a 1.3 percent drop in imports. Both declines followed unusually large increases in April. The largest positive impact on the overall trade position in May was made by Germany (€6.6 billion). France, Italy and Spain all registered deficits. Over the first four months of 2008, the unadjusted data show especially strong annual export growth to Russia (24 percent), Poland (22 percent) and China (19 percent). On the same basis, imports have been particularly robust from Russia (24 percent), Poland (23 percent) and the Czech Republic (16 percent).
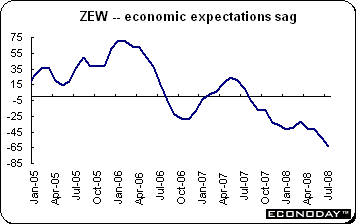 July ZEW survey expectations sank to minus 63.9 from minus 52.4 in June while current conditions slumped more than 20 points to 17.0. The decline in sentiment reflects increased global risks for economic activity. High oil prices, the strong euro, U.S. economic woes, the interest rate increase by the ECB and weak domestic consumer demand could hurt German companies in the next six months. The latest ZEW results may exaggerate the intensity of the coming slowdown, as they are based on the views of some 300 analysts and institutional investors who tend to focus on financial market developments. July ZEW survey expectations sank to minus 63.9 from minus 52.4 in June while current conditions slumped more than 20 points to 17.0. The decline in sentiment reflects increased global risks for economic activity. High oil prices, the strong euro, U.S. economic woes, the interest rate increase by the ECB and weak domestic consumer demand could hurt German companies in the next six months. The latest ZEW results may exaggerate the intensity of the coming slowdown, as they are based on the views of some 300 analysts and institutional investors who tend to focus on financial market developments.
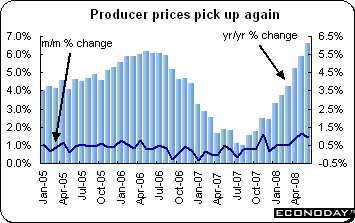 June producer price index jumped 0.8 percent and was up 6.7 percent when compared with last year. The annual gain was a 16 year high. Inevitably the main driving force behind the latest acceleration was energy prices which jumped another 2.6 percent on the month and 17.9 percent on the year. Excluding this sector, the PPI was up 0.3 percent from May and 3.0 percent from a year ago. On a monthly basis, basic goods prices advanced 0.5 percent (3.7 percent on the year) while consumer goods rose 0.3 percent (3.9 percent) and capital goods edged up 0.2 percent (1.2 percent). June producer price index jumped 0.8 percent and was up 6.7 percent when compared with last year. The annual gain was a 16 year high. Inevitably the main driving force behind the latest acceleration was energy prices which jumped another 2.6 percent on the month and 17.9 percent on the year. Excluding this sector, the PPI was up 0.3 percent from May and 3.0 percent from a year ago. On a monthly basis, basic goods prices advanced 0.5 percent (3.7 percent on the year) while consumer goods rose 0.3 percent (3.9 percent) and capital goods edged up 0.2 percent (1.2 percent).
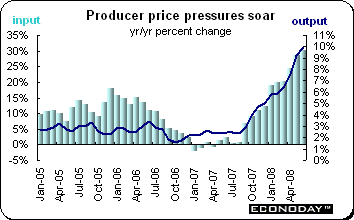 June producer output prices were up 0.9 percent and 10 percent when compared with a year ago and its fastest pace since records began. Core output prices were up 0.3 percent but this was also sufficient to ensure a new high of 6.4 percent for the on the year change. Fuel prices once again dominated the monthly advance with petroleum product prices surging another 4.2 percent and responsible for more than half of the increase in the overall index. Over the year, petrol prices are up some 34.2 percent. Other sectors posting significant monthly gains were food (1.1 percent), chemical products (1.0 percent) and metal products (0.9 percent). All of the other main groups saw prices rise by 0.3 percent or less but no sector registered a fall. Producer input prices were up 2.1 percent and 30.3 percent on the year. Excluding food, drink & tobacco, the core index rose 1.5 percent and is up a hefty 15.5 percent on the year. An 8.1 percent monthly jump in crude oil prices was responsible for almost all of the increase in the overall index. In addition, fuel prices rose 1.9 percent and there were also sizeable increases in imported food materials (2.3 percent), imported chemicals (1.3 percent) and other imported materials (0.9 percent). Against this there were declines in home food materials (3.1 percent) and imported metals (0.5 percent). June producer output prices were up 0.9 percent and 10 percent when compared with a year ago and its fastest pace since records began. Core output prices were up 0.3 percent but this was also sufficient to ensure a new high of 6.4 percent for the on the year change. Fuel prices once again dominated the monthly advance with petroleum product prices surging another 4.2 percent and responsible for more than half of the increase in the overall index. Over the year, petrol prices are up some 34.2 percent. Other sectors posting significant monthly gains were food (1.1 percent), chemical products (1.0 percent) and metal products (0.9 percent). All of the other main groups saw prices rise by 0.3 percent or less but no sector registered a fall. Producer input prices were up 2.1 percent and 30.3 percent on the year. Excluding food, drink & tobacco, the core index rose 1.5 percent and is up a hefty 15.5 percent on the year. An 8.1 percent monthly jump in crude oil prices was responsible for almost all of the increase in the overall index. In addition, fuel prices rose 1.9 percent and there were also sizeable increases in imported food materials (2.3 percent), imported chemicals (1.3 percent) and other imported materials (0.9 percent). Against this there were declines in home food materials (3.1 percent) and imported metals (0.5 percent).
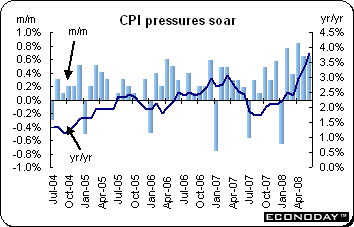 June consumer prices were up 0.7 percent and 3.8 percent when compared with the same month a year ago. The latest spike was largely a function of spiraling food and energy costs. Core CPI was up 0.3 percent on the month and 1.6 percent on the year. On the year, food and alcohol prices surged from 7.8 percent in May to 9.5 percent in June and were responsible for almost 0.2 percentage points of the 0.5 percentage point rise in annual headline inflation. Also contributing to the gain were transportation prices (6.3 percent to 7.3 percent) which reflected the jump in energy costs, housing & household services and recreation & culture. Amongst the other major sectors, there were small negative effects on the change in annual inflation from clothing & footwear and restaurants & hotels. Overall service sector inflation edged up to 3.1 percent from 3.0 percent last time but prices in the goods producing area jumped sharply, to a 3.9 percent annual rate from 3.0 percent. June consumer prices were up 0.7 percent and 3.8 percent when compared with the same month a year ago. The latest spike was largely a function of spiraling food and energy costs. Core CPI was up 0.3 percent on the month and 1.6 percent on the year. On the year, food and alcohol prices surged from 7.8 percent in May to 9.5 percent in June and were responsible for almost 0.2 percentage points of the 0.5 percentage point rise in annual headline inflation. Also contributing to the gain were transportation prices (6.3 percent to 7.3 percent) which reflected the jump in energy costs, housing & household services and recreation & culture. Amongst the other major sectors, there were small negative effects on the change in annual inflation from clothing & footwear and restaurants & hotels. Overall service sector inflation edged up to 3.1 percent from 3.0 percent last time but prices in the goods producing area jumped sharply, to a 3.9 percent annual rate from 3.0 percent.
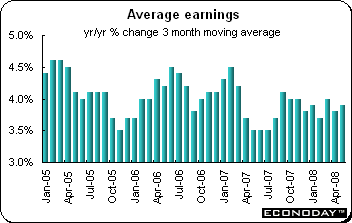 May average earnings were up 3.9 percent on the year. Including bonuses, earnings were up 3.8 percent on the year. Private sector pay growth (including bonuses) stood at 3.9 percent compared with 3.5 percent for the public sector. Excluding bonus payments, private sector growth stood at 3.8 percent, compared with 4.0 percent for the public sector. Average earnings for manufacturing were steady (3.6 percent) while services dipped a tick (4.2 percent). May average earnings were up 3.9 percent on the year. Including bonuses, earnings were up 3.8 percent on the year. Private sector pay growth (including bonuses) stood at 3.9 percent compared with 3.5 percent for the public sector. Excluding bonus payments, private sector growth stood at 3.8 percent, compared with 4.0 percent for the public sector. Average earnings for manufacturing were steady (3.6 percent) while services dipped a tick (4.2 percent).
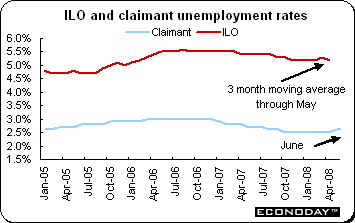 June claimant count unemployment rose a greater than expected 15,500 to nudge the jobless rate from 2.5 percent to 2.6 percent. The rise in the count was the largest since December 1992. The pace of increase in joblessness has risen every month since February and there is little to suggest that this pattern will not continue over coming months and quarters. There were 32,200 less vacancies in the second quarter compared with the previous three months, easily the steepest fall so far in 2008. For the three months ending in May, the ILO measure of joblessness edged up 12,000 to 1,620,000. This left the unemployment rate unchanged at 5.2 percent compared with the previous three months but still down 0.2 percentage points from a year ago. June claimant count unemployment rose a greater than expected 15,500 to nudge the jobless rate from 2.5 percent to 2.6 percent. The rise in the count was the largest since December 1992. The pace of increase in joblessness has risen every month since February and there is little to suggest that this pattern will not continue over coming months and quarters. There were 32,200 less vacancies in the second quarter compared with the previous three months, easily the steepest fall so far in 2008. For the three months ending in May, the ILO measure of joblessness edged up 12,000 to 1,620,000. This left the unemployment rate unchanged at 5.2 percent compared with the previous three months but still down 0.2 percentage points from a year ago.
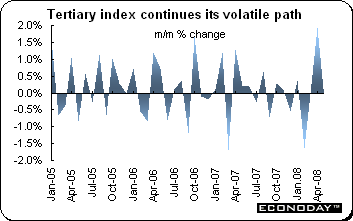 May tertiary index edged down 0.2 percent but was up 0.1 percent when compared with last year. This was much less than analysts’ expectations of a 2 percent drop. The following industries declined: services (down 0.3 percent), information & communications (down 3.5 percent) and real estate (down 0.7 percent). Industries that were up on the month included wholesale & retail trade (up 1 percent), electricity, gas, heat supply & water (up 1.7 percent), finance & insurance (up 0.6 percent), eating & drinking places & accommodations (up 1 percent), compound services (up 2.4 percent), transport (up 0.3 percent) and learning support (up 1.1 percent). Medical, health care & welfare were unchanged on the month. May tertiary index edged down 0.2 percent but was up 0.1 percent when compared with last year. This was much less than analysts’ expectations of a 2 percent drop. The following industries declined: services (down 0.3 percent), information & communications (down 3.5 percent) and real estate (down 0.7 percent). Industries that were up on the month included wholesale & retail trade (up 1 percent), electricity, gas, heat supply & water (up 1.7 percent), finance & insurance (up 0.6 percent), eating & drinking places & accommodations (up 1 percent), compound services (up 2.4 percent), transport (up 0.3 percent) and learning support (up 1.1 percent). Medical, health care & welfare were unchanged on the month.
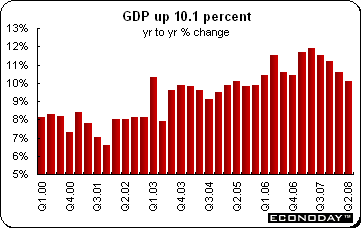 Second quarter real gross domestic product was up 10.1 percent when compared with the same quarter a year ago. Seasonally-adjusted, real GDP growth continued to climb at an annualized rate of 10.4 percent, marginally slower than 10.7 percent in the first quarter. In spite of further downshift in global growth, exports expanded but import growth accelerated more, resulting in a modest decline in trade surplus. Consumer spending growth and fixed investment continued to run at a healthy clip, with the momentum picking up notably in June. Second quarter real gross domestic product was up 10.1 percent when compared with the same quarter a year ago. Seasonally-adjusted, real GDP growth continued to climb at an annualized rate of 10.4 percent, marginally slower than 10.7 percent in the first quarter. In spite of further downshift in global growth, exports expanded but import growth accelerated more, resulting in a modest decline in trade surplus. Consumer spending growth and fixed investment continued to run at a healthy clip, with the momentum picking up notably in June.
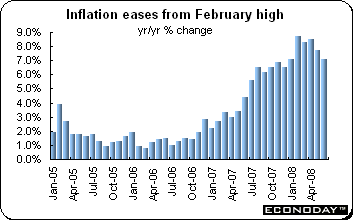 June consumer price index was up 7.1 percent when compared with last year. This compares with 7.7 percent in May, 8.5 percent in April and a nearly 12-year-high of 8.7 percent in February. For the first half of the year, the CPI was up 7.9 percent. June consumer price index was up 7.1 percent when compared with last year. This compares with 7.7 percent in May, 8.5 percent in April and a nearly 12-year-high of 8.7 percent in February. For the first half of the year, the CPI was up 7.9 percent.
Seasonally adjusted unemployment rate for the three months April through June remained at 3.3 percent as both the labor force and unemployment dropped in that period. The number of unemployed for the same period declined by 800 but the labor force declined by 2,700. The jobless rate declined in restaurants & hotels, communications and miscellaneous personal services sectors while the rate was up for the construction and insurance sectors.
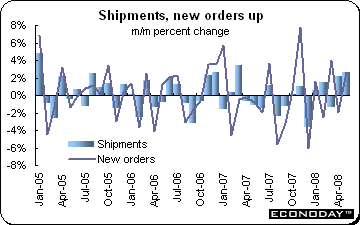 May factory shipments jumped 2.7 percent and were down 1.3 percent when compared with last year. In volume terms, sales were up a notably more modest 0.2 percent and provide a more reliable guide to underlying developments in the manufacturing sector. However, shipments have increased four of the last five months. Sixteen out of the twenty-one reporting industries were up, not surprisingly dominated by petroleum and coal products (9.2 percent). Primary metals (3.1 percent) did well again with the latest advance constituting the seventh consecutive monthly rise. Chemical products were also robust, rising 3.5 percent to compound the 2.3 percent increase in April with fertilizer manufacturers especially robust. The only marked decline on the month was in textile products (13.1 percent). Order backlogs were up 0.8 percent while new orders climbed 2.7 percent. May factory shipments jumped 2.7 percent and were down 1.3 percent when compared with last year. In volume terms, sales were up a notably more modest 0.2 percent and provide a more reliable guide to underlying developments in the manufacturing sector. However, shipments have increased four of the last five months. Sixteen out of the twenty-one reporting industries were up, not surprisingly dominated by petroleum and coal products (9.2 percent). Primary metals (3.1 percent) did well again with the latest advance constituting the seventh consecutive monthly rise. Chemical products were also robust, rising 3.5 percent to compound the 2.3 percent increase in April with fertilizer manufacturers especially robust. The only marked decline on the month was in textile products (13.1 percent). Order backlogs were up 0.8 percent while new orders climbed 2.7 percent.
Last week was dominated by Fannie Mae and Freddie Mac, by Fed Chairman Ben Bernanke’s semi-annual Congressional testimony, by a slew of earnings reports and by dropping crude oil prices. The dollar hit an all time low against the euro Tuesday. Most of the new economic data underlined inflationary pressures in Europe, the UK and the U.S.
The International Monetary Fund (IMF) raised its global economic forecast. It decided that the impact of a credit crunch was not as severe as had been first feared. The IMF now expects the global economy to grow 4.1 percent in 2008, up from an initial estimate of 3.7 percent. That compares with 5 percent growth in 2007. Despite upgrading forecasts for the UK and US, the IMF warned that the global economy remained in a “tough spot”. Growth must be balanced while dealing with inflation.
There are no major central bank meetings next week, although the Beige Book will be published Wednesday in advance of the next FOMC meeting on August 5. The major economic data event this week is the UK’s first estimate of second quarter growth.
| Central Bank activities |
|
| July 23 |
United States |
Federal Reserve Beige Book released |
|
|
|
| The following indicators will be released this week... |
| Europe |
|
|
| July 23 |
France |
Consumption of Manufactured Goods (June) |
| July 24 |
Germany |
Ifo Business Survey (July) |
|
UK |
Retail Sales (June) |
| July 25 |
EMU |
M3 Money Supply (June) |
|
UK |
Gross Domestic Product (Q2.2008 preliminary) |
|
|
|
| Asia/Pacific |
|
|
| July 21 |
Australia |
Producer Price Index (Q2.2008) |
| July 22 |
Japan |
All Industry Activity Index (May) |
| July 23 |
Australia |
Consumer Price Index (Q2.2008) |
| July 24 |
Japan |
Merchandise Trade Balance (June) |
| July 25 |
Japan |
Consumer Price Index (June, July) |
|
|
|
| Americas |
|
|
| July 22 |
Canada |
Retail Sales (May) |
| July 23 |
Canada |
Consumer Price Index (June) |
Anne D Picker is the author of International Economic Indicators and Central Banks.
|

![[Econoday]](images/econoday_logo_slim.gif)
![[Econoday]](images/logo.gif)


 The FTSE, CAC and DAX ended another turbulent week — but this time on a positive note. It was the first week in nine that the FTSE was up while it was the first week in seven for the CAC and DAX. An outbreak of optimism in the financial sector combined with lower crude prices helped generate gains. Financial and technology stocks beat earnings forecasts while JPMorgan eased concern about growing credit losses and declining consumer spending. And some banks reported losses — but they were less than anticipated — and investors exhaled. On the week, the CAC was up 4.8 percent, the DAX was up 3.7 percent while the FTSE gained 2.2 percent.
  All Asian/Pacific equity indexes followed here were down last week with the exception of the Indian Sensex. That index responded positively to the drop in crude prices. Investors there were also heartened by a less than anticipated increase in the weekly wholesale price index. Analysts expected the increase to exceed 12 percent, but the inflation rate for the recent week came in at 11.91 percent and surprised traders.
  Chinese stocks continued their downward trajectory, losing 2.7 percent last week. The Shanghai Composite is now down 47.2 percent in 2008. The index dropped Thursday after second quarter gross domestic product slowed and persistent pressures from producer prices weighed on investor sentiment as concerns over profits intensified. China’s second quarter GDP growth slowed to 10.1 percent from 10.6 percent in the first. But according to analysts, the slowdown in growth should not be surprising given that monetary policy has been tightened progressively and in various ways since the start of last year.
  As expected, the Bank of Japan kept its key interest rate steady at 0.5 percent after its two-day meeting as soaring energy and commodity prices continue to erode incomes and discourage business and household spending. The rate is the lowest among the major economies. The Bank acknowledged the increasing impact of global problems on the economy and lowered its growth forecast while at the same time, upped its prediction for inflation. Growth for the fiscal year ending March 2009 is now estimated at 1.2 percent, down from its April forecast of 1.5 percent while inflation — which has been fuelled by higher oil and food prices — has been revised from 1.1 percent to 1.8 percent.
  or repurchase facility. According to the Bank’s post-meeting statement, it said that controlling inflation is its foremost priority. It noted that “concurrent and interrelated shocks to the economy — such as the persistent surge in oil prices and spikes in commodity prices — have contributed to elevated inflation readings. Second-round effects have set in, as evident in the rise in core inflation.” The Bank increased its 2008 inflation estimate to a range of 9 percent to 11 percent from a previous prediction of 7 percent to 9 percent, citing a weak peso and higher food, transportation and energy costs. The inflation target, defined in terms of the average year-on-year change in the consumer price index (CPI) over the calendar year, is 4 percent with a tolerance interval of plus 1 percentage point for 2009.
  As expected, the Bank of Canada kept its key interest rate at 3 percent. At its previous meeting on June 10, the Bank surprised analysts by keeping its policy rate unchanged at 3 percent. At the time and in subsequent remarks by Governor Carney, the Bank has expressed some unease about underlying inflation although the risks remained evenly balanced. Canadian inflation is tame compared with that in Europe and the United States. May CPI was up 2.2 percent on the year. This was higher than April’s increase of 1.7 percent. And food and energy prices have soared as well. The post-meeting statement said that risks now are balanced between growth and inflation.
  The dollar rebounded against the euro after dropping to an all time low of $1.6038 in intraday trading on Tuesday July 15. But the dollar firmed on signs U.S. investment banks would withstand credit-market losses stemming from the collapse of the subprime-mortgage market. The dollar also rebounded from mid-week lows against the yen to end the week up marginally. The yen lost ground against higher-yielding currencies as firming confidence lifted risk appetite, reducing the safe-haven yen’s attractiveness. The dollar gained against the yen Friday after Citigroup issued its earnings report.
  May
May  June
June  May unadjusted
  July
July  June
June  June
June  June
June  May
May  June
June  May
May  Second quarter
  June
June  May
May