|
Relentless worries about the health and well being of the global financial sector combined with a spike in oil prices to provoke nervous trading last week, sending most equity indexes lower. Concerns about financial companies focused on U.S. mortgage agencies Fannie Mae and Freddie Mac and their ability to withstand further credit losses. Investors are unsure about the magnitude of additional credit-related losses, which are likely to affect the health of the U.S. economy already battered by credit concerns stemming from the subprime mortgage crisis. Also weighing on investors are jitters ahead of quarterly earnings statements from many U.S. financial institutions which will be released at mid-month. With housing prices continuing to fall, likely losses in the overall financial system will continue to rise.
The U.S. dollar dropped and crude prices climbed amid growing worries of threats to supplies from Nigeria and Iran as well as concern over a Brazilian oil workers strike next week. Rumors that Israel may be preparing to attack Iran also pushed prices up.
More indexes joined the ranks of those in a bear market. Now stocks in the U.S., Japan, China, UK, France, Germany, Hong Kong, Germany and Australia have retreated more than 20 percent from their peaks. On the week, all indexes in Europe and North America were down. However, in the Asia/Pacific, seven of 13 indexes were up on the week.
|
|
2007 |
2008 |
% Change |
|
Index |
Dec 31 |
Jul 4 |
Jul 11 |
Week |
Year |
| Asia |
|
|
|
|
|
|
| Australia |
All Ordinaries |
6421.0 |
5170.0 |
5067.8 |
-2.0% |
-21.1% |
| Japan |
Nikkei 225 |
15307.8 |
13237.9 |
13039.7 |
-1.5% |
-14.8% |
|
Topix |
1475.7 |
1297.9 |
1285.9 |
-0.9% |
-12.9% |
| Hong Kong |
Hang Seng |
27812.7 |
21423.8 |
22184.6 |
3.6% |
-20.2% |
| S. Korea |
Kospi |
1897.1 |
1577.9 |
1567.5 |
-0.7% |
-17.4% |
| Singapore |
STI |
3482.3 |
2892.5 |
2926.8 |
1.2% |
-16.0% |
| China |
Shanghai Composite |
5261.6 |
2669.9 |
2856.6 |
7.0% |
-45.7% |
|
|
|
|
|
|
|
| India |
Sensex 30 |
20287.0 |
13454.0 |
13469.9 |
0.1% |
-33.6% |
| Indonesia |
Jakarta Composite |
2745.8 |
2314.8 |
2276.9 |
-1.6% |
-17.1% |
| Malaysia |
KLSE Composite |
1445.0 |
1134.1 |
1150.4 |
1.4% |
-20.4% |
| Philippines |
PSEi |
3621.6 |
2369.2 |
2438.0 |
2.9% |
-32.7% |
| Taiwan |
Taiex |
8506.3 |
7228.4 |
7244.8 |
0.2% |
-14.8% |
| Thailand |
SET |
858.1 |
743.0 |
730.3 |
-1.7% |
-14.9% |
|
|
|
|
|
|
|
| Europe |
|
|
|
|
|
|
| UK |
FTSE 100 |
6456.9 |
5412.8 |
5261.60 |
-2.8% |
-18.5% |
| France |
CAC |
5614.1 |
4266.0 |
4100.64 |
-3.9% |
-27.0% |
| Germany |
XETRA DAX |
8067.3 |
6272.2 |
6153.30 |
-1.9% |
-23.7% |
|
|
|
|
|
|
|
| North America |
|
|
|
|
|
|
| United States |
Dow |
13264.8 |
11288.5 |
11100.54 |
-1.7% |
-16.3% |
|
NASDAQ |
2652.3 |
2245.4 |
2239.08 |
-0.3% |
-15.6% |
|
S&P 500 |
1468.4 |
1262.9 |
1239.49 |
-1.9% |
-15.6% |
| Canada |
S&P/TSX Comp. |
13833.1 |
14010.4 |
13709.10 |
-2.2% |
-0.9% |
| Mexico |
Bolsa |
29536.8 |
28338.1 |
27614.54 |
-2.6% |
-6.5% |
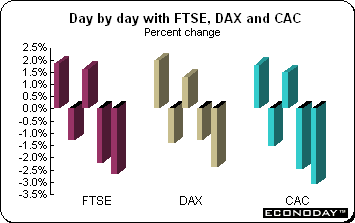 The FTSE, CAC and DAX sank as record oil hurt automakers and airlines and as investor concerns deepened about the health of Fannie Mae and Freddie Mac. The FTSE entered bear market territory Friday after flirting with it earlier in the week. The FTSE 100 was down 2.8 percent on the week and more than 20 percent below its June 2007 high of 6,730 — the definition of a bear market. This is the 19th bear market since 1918, as credit losses and the worst housing slump in 30 years dimmed the earnings outlook for banks and retailers. The FTSE, CAC and DAX sank as record oil hurt automakers and airlines and as investor concerns deepened about the health of Fannie Mae and Freddie Mac. The FTSE entered bear market territory Friday after flirting with it earlier in the week. The FTSE 100 was down 2.8 percent on the week and more than 20 percent below its June 2007 high of 6,730 — the definition of a bear market. This is the 19th bear market since 1918, as credit losses and the worst housing slump in 30 years dimmed the earnings outlook for banks and retailers.
Energy sensitive stocks including auto makers and airlines sank as crude climbed to $147.27 a barrel. Some analysts classified investor concerns about Fannie Mae and Freddie Mac as near panic. And oil prices just reached another record, which also weighed on the market. Reassurances from U.S. Treasury Secretary Henry Paulson Friday morning had little impact. Paulson said federal regulators are backing Fannie Mae and Freddie Mac in their “current form.” Obviously investors wanted more assurance. But the U.S. is reluctant to step in before Fannie Mae and Freddie Mac, which own or guarantee about half the $12 trillion in home loans outstanding, exhaust their options for raising capital. The companies have raised $20 billion to cover losses amid the highest delinquency rates in at least 29 years.
On Thursday, worries about the health of the global financial sector made for another extremely nervous session for the global financial markets. Much of the concern centered on Fannie Mae and Freddie Mac after William Poole, the former president of the St. Louis Federal Reserve, said the two government-sponsored enterprises (GSEs) may need a government bailout. On the week, the FTSE was down 2.8 percent while the CAC sank 3.9 percent and the DAX declined 1.9 percent. In 2008, the indexes are down 18.5 percent, 27 percent and 23.7 percent respectively. According to analysts, June and July have been difficult months over the last four decades because of thin volumes.
Bank of England holds its fire
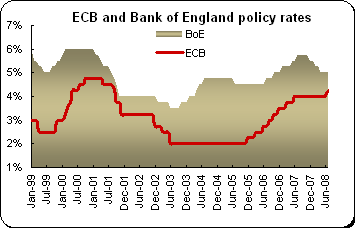 As expected, the Bank of England kept its key interest rate at 5 percent as growth slows and inflationary pressures climb. The monetary policy committee last lowered interest rates at its April meeting. The MPC is being pulled in two directions by the conflicting trends of faltering growth and rising inflationary pressures, both of which have grown worse since the committee met in June. Evidence has been piling up that the economy is sliding into the grip of a serious slowdown, if not an outright recession. As expected, the Bank of England kept its key interest rate at 5 percent as growth slows and inflationary pressures climb. The monetary policy committee last lowered interest rates at its April meeting. The MPC is being pulled in two directions by the conflicting trends of faltering growth and rising inflationary pressures, both of which have grown worse since the committee met in June. Evidence has been piling up that the economy is sliding into the grip of a serious slowdown, if not an outright recession.
With the Bank’s inflation target of 2 percent and prices rising, the risk is that companies and households would come to expect high inflation, making it a self-fulfilling prophecy. The MPC has responded to these fears by insisting the economy must slow sharply which in turn has raised economic insecurity perhaps just enough to squeeze inflation out of the system. Economic data continue to weaken as the housing sector and with it, consumer confidence tumble. Both the manufacturing and services sector PMIs (purchasing managers’ indexes) released last week showed activity below the 50 breakeven point for the first time since 2001. And newly released data on industrial and manufacturing output declined more than expected.
As usual when there is no policy change, the MPC did not explain its decision. Bank watchers will have to wait two weeks for the minutes of the meeting. The Bank’s 5 percent lending rate is the highest among the Group of Seven nations while Japan's 0.5 percent is the industrialized worlds lowest.
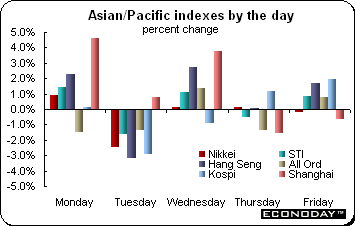 Equities were mixed last week as worries continued to simmer about the banking sector while at the same time crude oil prices continued to cause concerns. The Nikkei was down for the fifth consecutive week, but did manage to snap a 12-day losing streak on Monday. However, investors remained jittery about high crude prices, sending the index lower on Friday. The Nikkei was up three of five days during the week even though U.S. economic concerns weighed on export oriented stocks such as auto makers. Equities were mixed last week as worries continued to simmer about the banking sector while at the same time crude oil prices continued to cause concerns. The Nikkei was down for the fifth consecutive week, but did manage to snap a 12-day losing streak on Monday. However, investors remained jittery about high crude prices, sending the index lower on Friday. The Nikkei was up three of five days during the week even though U.S. economic concerns weighed on export oriented stocks such as auto makers.
Stocks in Australia were up Friday as commodity producers climbed along with metals and oil, and on speculation the U.S. government will prevent the collapse of Fannie Mae and Freddie Mac. However, the All Ordinaries was down for the eighth consecutive week.
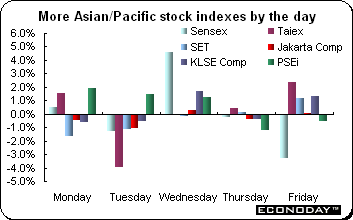 Although the index managed to edge up on the week, India's Sensex Index slid 3.3 percent on Friday amid intra-day volatility of 715 points, after a government report said industrial production grew at the slowest pace in more than six years while inflation accelerated to the fastest since 1995. Wholesale price inflation surged to 11.9 percent in the 12 months to June 28 while May industrial production was up 3.8 percent, much lower than revised 6.2 percent growth in April. Although the index managed to edge up on the week, India's Sensex Index slid 3.3 percent on Friday amid intra-day volatility of 715 points, after a government report said industrial production grew at the slowest pace in more than six years while inflation accelerated to the fastest since 1995. Wholesale price inflation surged to 11.9 percent in the 12 months to June 28 while May industrial production was up 3.8 percent, much lower than revised 6.2 percent growth in April.
Both the Hang Seng and Shanghai Composite were up last week by 3.6 percent and 7 percent respectively. The Chinese business sentiment index improved to 137.4 in the second quarter from 136.2 reported in the first quarter. In Hong Kong, Chinese banks led gainers after China Merchants Bank and China Citic Bank forecast higher first-half net profit. Airlines soared on expectations that revenue would be higher on account of Beijing Olympics in August.
As expected, the Bank of Korea left its key interest rate unchanged at 5 percent for the 11th straight month due to concerns over spiraling inflation. The bank has kept the interest rate steady since its first back-to-back increases in July and August of 2007.
On the week, seven of 13 indexes tracked here had positive gains. The Shanghai Composite was the best performer, gaining 7 percent while the All Ordinaries performed the worst, losing 2 percent during the week.
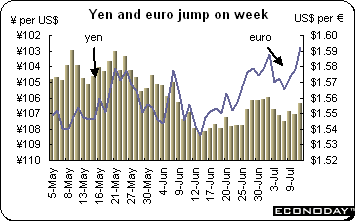 The dollar sank against the euro again last week. At one point in Friday trading the euro neared its all-time high of just under $1.60 on concern the U.S. government may be forced to take over mortgage lenders Fannie Mae and Freddie Mac. The currency was headed for a weekly decline after Treasury Secretary Henry Paulson said the government is supporting the two largest buyers of U.S. home loans in their “current form.” The dollar dropped the most in two weeks against the yen and reached a 25-year low against the Australian dollar. The dollar has fallen about 11 percent against the euro since September 18 when the Fed made the first of seven reductions in its target rate to help avert a recession. In Thursday’s congressional testimony, Paulson reiterated the desire for a “strong dollar” saying the currency should reflect the U.S. economy's “long-term fundamentals.” The dollar sank against the euro again last week. At one point in Friday trading the euro neared its all-time high of just under $1.60 on concern the U.S. government may be forced to take over mortgage lenders Fannie Mae and Freddie Mac. The currency was headed for a weekly decline after Treasury Secretary Henry Paulson said the government is supporting the two largest buyers of U.S. home loans in their “current form.” The dollar dropped the most in two weeks against the yen and reached a 25-year low against the Australian dollar. The dollar has fallen about 11 percent against the euro since September 18 when the Fed made the first of seven reductions in its target rate to help avert a recession. In Thursday’s congressional testimony, Paulson reiterated the desire for a “strong dollar” saying the currency should reflect the U.S. economy's “long-term fundamentals.”
Asian currencies posted a weekly gain, led by South Korea's won as policy makers there pledged to shore up the local currency and tame inflation. As of 2 PM ET in the U.S., the won was up 4.5 percent 4.8 percent, the biggest gain since March 1998, after the government announced on Thursday that it will tackle risks stemming from oil costs and inflation. Korea intervened earlier in the week. Traders said the Bank of Korea sold about $2 billion on Tuesday and more than $3 billion on Wednesday as it tried to support the won, which fell 10 per cent in the first half of the year. The bank said it would use its foreign exchange reserves — estimated to stand at about $258 billion — again to stabilize inflation, adding that it would continue to defend the Won1,000 level against the dollar.
Malaysia's ringgit climbed on speculation investors will shun the U.S. currency as the prospect of widening credit-market losses gives the Federal Reserve less room to raise interest rates. The ringgit logged its first weekly gain in three after U.S. stocks entered a bear market this week for the first time since 2002 as several central banks including South Korea and Malaysia bought their own currencies to help stem inflation.
Selected currencies — weekly results
|
|
2007 |
2008 |
% change |
|
|
Dec 31 |
July 3 |
July 11 |
Week |
Year |
| U.S. $ per currency |
|
|
|
|
|
|
| Australia |
A$ |
0.878 |
0.960 |
0.966 |
0.6% |
10.1% |
| New Zealand |
NZ$ |
0.774 |
0.756 |
0.761 |
0.6% |
-1.7% |
| Canada |
C$ |
1.012 |
0.981 |
0.991 |
1.0% |
-2.1% |
| Eurozone |
euro (€) |
1.460 |
1.570 |
1.593 |
1.4% |
9.1% |
| UK |
pound sterling (£) |
1.984 |
1.983 |
1.988 |
0.2% |
0.2% |
|
|
|
|
|
|
|
| Currency per U.S. $ |
|
|
|
|
|
|
| China |
yuan |
7.295 |
6.851 |
6.834 |
0.2% |
6.7% |
| Hong Kong |
HK$* |
7.798 |
7.798 |
7.805 |
-0.1% |
-0.1% |
| India |
rupee |
39.410 |
43.200 |
42.885 |
0.7% |
-8.1% |
| Japan |
yen |
111.710 |
106.721 |
106.375 |
0.3% |
5.0% |
| Malaysia |
ringgit |
3.306 |
3.265 |
3.233 |
1.0% |
2.3% |
| Singapore |
Singapore $ |
1.436 |
1.363 |
1.357 |
0.4% |
5.8% |
| South Korea |
won |
935.800 |
1045.150 |
1000.400 |
4.5% |
-6.5% |
| Taiwan |
Taiwan $ |
32.430 |
30.430 |
30.420 |
0.0% |
6.6% |
| Thailand |
baht |
29.500 |
33.420 |
33.660 |
-0.7% |
-12.4% |
| Switzerland |
Swiss franc |
1.133 |
1.027 |
1.017 |
1.0% |
11.5% |
|
|
|
|
|
|
|
| *Pegged to U.S. dollar |
|
|
|
|
|
|
| Source: Bloomberg |
|
|
|
|
|
|
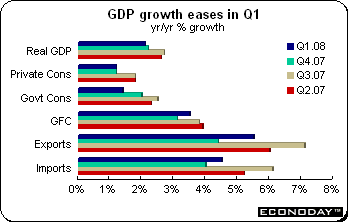 First quarter gross domestic product growth was revised to 0.7 percent from the previous estimate of 0.8 percent and was up 2.1 percent when compared with the same quarter a year ago. Quarterly growth was driven by domestic demand (0.7 percent) as advances in with exports (1.9 percent) and imports (2.0 percent) effectively cancelled each other out. Within domestic demand, private consumption was up just 0.2 percent, a particularly poor result in the wake of 0.1 percent dip in the previous period. Government consumption rose 0.4 percent but it was an unsustainably large 1.6 percent leap in fixed investment that accounted for fully half the rise in GDP. Inventory accumulation added 0.2 percentage points. When compared with last year, domestic demand was up 1.6 percent with private consumption gaining 1.2 percent. Government consumption was up 1.4 percent on the year while fixed investment jumped by 3.5 percent. First quarter gross domestic product growth was revised to 0.7 percent from the previous estimate of 0.8 percent and was up 2.1 percent when compared with the same quarter a year ago. Quarterly growth was driven by domestic demand (0.7 percent) as advances in with exports (1.9 percent) and imports (2.0 percent) effectively cancelled each other out. Within domestic demand, private consumption was up just 0.2 percent, a particularly poor result in the wake of 0.1 percent dip in the previous period. Government consumption rose 0.4 percent but it was an unsustainably large 1.6 percent leap in fixed investment that accounted for fully half the rise in GDP. Inventory accumulation added 0.2 percentage points. When compared with last year, domestic demand was up 1.6 percent with private consumption gaining 1.2 percent. Government consumption was up 1.4 percent on the year while fixed investment jumped by 3.5 percent.
May manufacturing orders dropped 0.9 percent and were up 0.2 percent when compared with the same month a year ago. The latest monthly slide was wholly attributable to the domestic sector which posted a 2.7 percent contraction to stand 0.3 percent lower on the year. Declines were 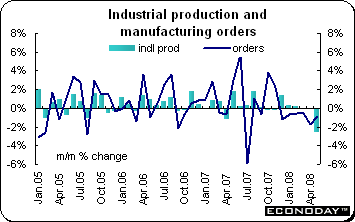 broad based and led by capital goods (4.0 percent), followed by consumer goods (1.7 percent) and basics (1.6 percent). Foreign demand was up 0.8 percent mainly thanks to a hefty increase in basics (12.6 percent) although consumer goods also registered a respectable increase (1.3 percent). Capital goods on the other hand continued to weaken (down 5.6 percent). broad based and led by capital goods (4.0 percent), followed by consumer goods (1.7 percent) and basics (1.6 percent). Foreign demand was up 0.8 percent mainly thanks to a hefty increase in basics (12.6 percent) although consumer goods also registered a respectable increase (1.3 percent). Capital goods on the other hand continued to weaken (down 5.6 percent).
May industrial production contracted 2.4 percent and was up 0.8 percent when compared with last year. Outside of construction which was up 1.1 percent, output fell heavily in all of the major sectors including durable goods (4.6 percent), intermediates (1.8 percent), capital goods (3.9 percent), consumer durable goods (4.6 percent), nondurable (0.7 percent) goods and energy (3.1 percent). Total manufacturing output shrank by 2.6 percent.
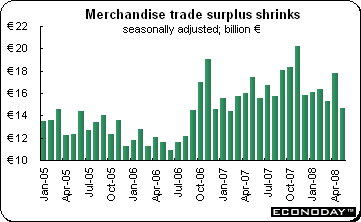 May seasonally adjusted merchandise trade surplus narrowed to €14.6 billion from €17.8 billion in April. The surplus narrowed thanks to a hefty 3.2 percent monthly drop in exports combined with a 0.7 percent rise in imports. Exports produced their weakest performance since August last year and have now fallen in three of the last four months and four of the last six. In unadjusted terms, total exports were up 2.5 percent when compared with last year while imports growth was up 8.2 percent. May seasonally adjusted merchandise trade surplus narrowed to €14.6 billion from €17.8 billion in April. The surplus narrowed thanks to a hefty 3.2 percent monthly drop in exports combined with a 0.7 percent rise in imports. Exports produced their weakest performance since August last year and have now fallen in three of the last four months and four of the last six. In unadjusted terms, total exports were up 2.5 percent when compared with last year while imports growth was up 8.2 percent.
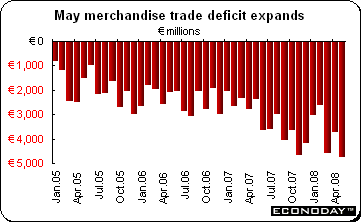 May merchandise trade gap widened to a record €4.7 billion in May. As a result, the cumulative shortfall over the year to date increased to €18.7 billion, some 53 percent up from the January-May period last year. The deterioration reflected both a 1.7 percent monthly decline in exports and a 1.0 percent rise in imports. Over the first five months of the year, exports are still up 6.6 percent but remain easily eclipsed by import growth of nearly 10 percent. The unadjusted data show another sizeable shortfall on the energy account (€4.4 billion), but the bulk of the deficit’s increase was due to a widening in basic goods (€1.4 billion from €0.6 billion). May merchandise trade gap widened to a record €4.7 billion in May. As a result, the cumulative shortfall over the year to date increased to €18.7 billion, some 53 percent up from the January-May period last year. The deterioration reflected both a 1.7 percent monthly decline in exports and a 1.0 percent rise in imports. Over the first five months of the year, exports are still up 6.6 percent but remain easily eclipsed by import growth of nearly 10 percent. The unadjusted data show another sizeable shortfall on the energy account (€4.4 billion), but the bulk of the deficit’s increase was due to a widening in basic goods (€1.4 billion from €0.6 billion).
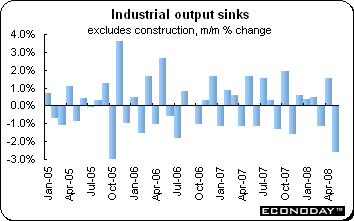 May industrial production excluding construction slumped 2.6 percent to stand 1.2 percent below its year ago level. The nosedive was broad based with all major sectors posting significant declines. Overall manufacturing production tumbled 2.5 percent led by an 8.0 percent collapse in the auto industry. Other hefty declines were registered by consumer goods (1.1 percent) for which clothing & leather (2.5 percent) and household durables (2.2 percent) were especially weak, capital goods (1.1 percent) and semi-finished goods (1.1 percent). Energy fell 4.8 percent and construction was down 1.0 percent. May industrial production excluding construction slumped 2.6 percent to stand 1.2 percent below its year ago level. The nosedive was broad based with all major sectors posting significant declines. Overall manufacturing production tumbled 2.5 percent led by an 8.0 percent collapse in the auto industry. Other hefty declines were registered by consumer goods (1.1 percent) for which clothing & leather (2.5 percent) and household durables (2.2 percent) were especially weak, capital goods (1.1 percent) and semi-finished goods (1.1 percent). Energy fell 4.8 percent and construction was down 1.0 percent.
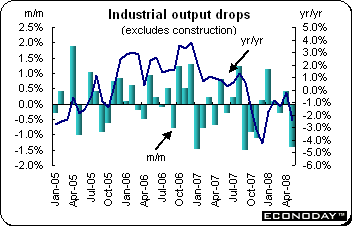 May industrial output reversed direction and dropped 1.4 percent monthly and sank 4.1 percent below the year ago level. Significant monthly declines were registered in all main sectors. Energy (3.7 percent) was especially weak while consumer goods (3.1 percent) and capital goods (3.0 percent) both saw marked contractions in activity and even a smaller drop in intermediates (1.8 percent) constituted the third decline in the last four months. May industrial output reversed direction and dropped 1.4 percent monthly and sank 4.1 percent below the year ago level. Significant monthly declines were registered in all main sectors. Energy (3.7 percent) was especially weak while consumer goods (3.1 percent) and capital goods (3.0 percent) both saw marked contractions in activity and even a smaller drop in intermediates (1.8 percent) constituted the third decline in the last four months.
 May industrial production dropped 0.8 percent and was down 1.6 percent when compared with last year. Industrial production was biased down by a monthly weather-related 5.2 percent drop in output in the electricity, gas & water sector and masked gains of 0.7 percent in mining & quarrying and 1.4 percent in oil & gas extraction. However, manufacturing output was down 0.5 percent and 0.8 percent on the year. All market sectors declined — durables were down 0.1 percent while nondurables slumped 0.8 percent. Capital goods sank 0.7 percent and intermediates dropped 1.0 percent. In manufacturing, most of the major sectors were also down. Metals (2.6 percent), food & drink (1.4 percent) and other manufacturing (2.2 percent) led the declines and eclipsed gains in chemicals & fibres (1.2 percent), engineering (0.5 percent), textiles & clothing (0.6 percent) and a more meager increase in coke & petrol (0.1 percent). May industrial production dropped 0.8 percent and was down 1.6 percent when compared with last year. Industrial production was biased down by a monthly weather-related 5.2 percent drop in output in the electricity, gas & water sector and masked gains of 0.7 percent in mining & quarrying and 1.4 percent in oil & gas extraction. However, manufacturing output was down 0.5 percent and 0.8 percent on the year. All market sectors declined — durables were down 0.1 percent while nondurables slumped 0.8 percent. Capital goods sank 0.7 percent and intermediates dropped 1.0 percent. In manufacturing, most of the major sectors were also down. Metals (2.6 percent), food & drink (1.4 percent) and other manufacturing (2.2 percent) led the declines and eclipsed gains in chemicals & fibres (1.2 percent), engineering (0.5 percent), textiles & clothing (0.6 percent) and a more meager increase in coke & petrol (0.1 percent).
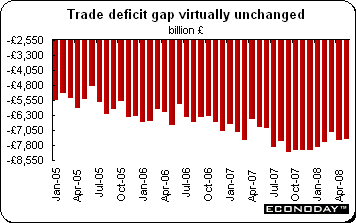 May merchandise trade deficit was Stg7.5 billion, essentially unchanged from the April shortfall. Regionally the deficit with the EU edged up to Stg3.5 billion from Stg3.4 billion while the deficit with the rest of the world narrowed marginally to Stg4.0 billion from Stg4.1 billion. Exports were up 1.5 percent led by higher shipments of oil, chemicals and other semi-manufactured goods. Exports of cars fell. Imports were up 0.9 percent on the back of gains in oil, capital goods and basic materials. Excluding oil and erratics, the overall shortfall was unchanged from April at Stg7.0 billion but the underlying real trade gap worsened as export volumes slipped 0.5 percent on the month while imports were unchanged. May merchandise trade deficit was Stg7.5 billion, essentially unchanged from the April shortfall. Regionally the deficit with the EU edged up to Stg3.5 billion from Stg3.4 billion while the deficit with the rest of the world narrowed marginally to Stg4.0 billion from Stg4.1 billion. Exports were up 1.5 percent led by higher shipments of oil, chemicals and other semi-manufactured goods. Exports of cars fell. Imports were up 0.9 percent on the back of gains in oil, capital goods and basic materials. Excluding oil and erratics, the overall shortfall was unchanged from April at Stg7.0 billion but the underlying real trade gap worsened as export volumes slipped 0.5 percent on the month while imports were unchanged.
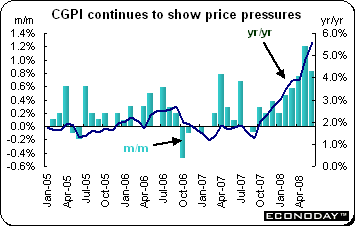 June corporate goods price index jumped by a more than expected 0.8 percent and 5.6 percent when compared with the same month a year ago. The main culprit was petroleum & coal products which were up 7.7 percent on the month after rising a revised 11.5 percent in May. On the year the category is up 36.5 percent when compared with June of 2007. Another contributor to the increase, although not on the same scale, were iron & steel prices which were up 1 percent on the month after jumping 2.6 percent in April. Iron & steel prices are up 18.3 percent on the year. Prices were also up on the month for metal products (0.9 percent) and chemicals & related products along with pulp, paper & related items (both up 0.8 percent). Prices declined for electrical machinery & equipment (down 0.4 percent) and information & communications equipment (down 1.1 percent). Overall manufacturing prices were up 0.8 percent and 5.2 percent on the year. June corporate goods price index jumped by a more than expected 0.8 percent and 5.6 percent when compared with the same month a year ago. The main culprit was petroleum & coal products which were up 7.7 percent on the month after rising a revised 11.5 percent in May. On the year the category is up 36.5 percent when compared with June of 2007. Another contributor to the increase, although not on the same scale, were iron & steel prices which were up 1 percent on the month after jumping 2.6 percent in April. Iron & steel prices are up 18.3 percent on the year. Prices were also up on the month for metal products (0.9 percent) and chemicals & related products along with pulp, paper & related items (both up 0.8 percent). Prices declined for electrical machinery & equipment (down 0.4 percent) and information & communications equipment (down 1.1 percent). Overall manufacturing prices were up 0.8 percent and 5.2 percent on the year.
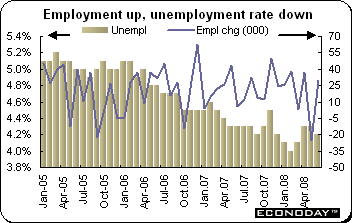 June employment was up 29,800 to 10,715,700, more than expected by analysts. The increase offsets the revised May decline of 25,600. Full-time employment increased by 24,000 to 7,664,600 and part-time employment increased by 5,800 to 3,051,100. The unemployment rate was 4.2 percent as expected. The number of those who were unemployed decreased by 2,800 to 473,800. The number of persons looking for full-time work declined by 300 to 317,100 while the number of persons looking for part-time work was down by 2,600 to 156,700. June employment was up 29,800 to 10,715,700, more than expected by analysts. The increase offsets the revised May decline of 25,600. Full-time employment increased by 24,000 to 7,664,600 and part-time employment increased by 5,800 to 3,051,100. The unemployment rate was 4.2 percent as expected. The number of those who were unemployed decreased by 2,800 to 473,800. The number of persons looking for full-time work declined by 300 to 317,100 while the number of persons looking for part-time work was down by 2,600 to 156,700.
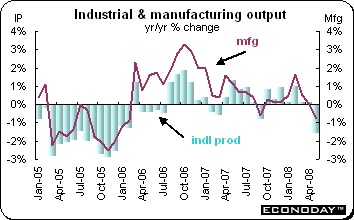
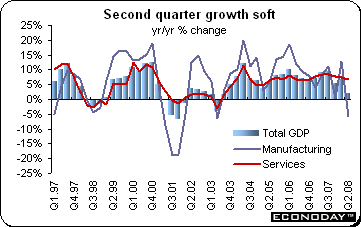 Second quarter gross domestic product was up 1.9 percent when compared with the same quarter a year ago. In the first quarter, GDP expanded by a revised 6.9 percent on the year. This was the slowest pace in five years as manufacturers cut production amid declining orders and accelerating inflation crimped spending. Manufacturing contracted 5.6 percent from a year earlier, compared with a revised 12.7 percent gain in the first three months of the year. Services climbed 6.9 percent from a year earlier, while the construction industry grew 15.2 percent. Industrial output tends to fluctuate from month to month because of swings in production by drug companies which shut plants for cleaning before making different products. Second quarter gross domestic product was up 1.9 percent when compared with the same quarter a year ago. In the first quarter, GDP expanded by a revised 6.9 percent on the year. This was the slowest pace in five years as manufacturers cut production amid declining orders and accelerating inflation crimped spending. Manufacturing contracted 5.6 percent from a year earlier, compared with a revised 12.7 percent gain in the first three months of the year. Services climbed 6.9 percent from a year earlier, while the construction industry grew 15.2 percent. Industrial output tends to fluctuate from month to month because of swings in production by drug companies which shut plants for cleaning before making different products.
June consumer price index was up 4.97 percent when compared with a year ago and substantially higher than May’s reading of 3.71 percent. Seasonally adjusted CPI was up 1.24 percent on the month. The reasons for the jump included increased food prices and continued increases in energy-related costs after last month’s surge in global oil prices and the May 27 increases for domestic gasoline and diesel prices. Core CPI excluding food and energy was up 3.7 percent on the year.
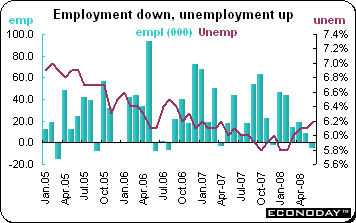 June employment contracted by 5,000 which boosted the unemployment rate to 6.2 percent from 6.1 percent in May. Full-time jobs sank by nearly 40,000 while part-time jobs increased by 34,200 almost offsetting the full-time loss. In the past 12 months, employment growth in part-time work has been faster than that of full time. The jobless rate increase reflected a 6,900 increase in the number of unemployed and a 5,000 decline in payrolls. The participation rate slipped a notch to 67.9 percent and the employment rate also dipped 0.1 percentage point to 63.7 percent. Employment in the goods producing sector was virtually unchanged while agriculture gained 3,100, natural resources was up by 5,400 and utilities increased by 6,800. Manufacturing payrolls were up just 800 but increases in the sectors taken together were almost wiped out by a 15,900 drop in the construction industry. Services sector jobs were down by 5,400 with the most significant declines seen in business building & other support services (17,800), health care & social assistance (16,900) and accommodation & food (12,300). There was also a small drop in transportation and warehousing (4,100). Declines in these industries just outweighed a respectable advance in professional, scientific & technical services (37,100) and less marked increases in trade (12,900), information, culture & recreation (10,100) and educational services (1,900). June employment contracted by 5,000 which boosted the unemployment rate to 6.2 percent from 6.1 percent in May. Full-time jobs sank by nearly 40,000 while part-time jobs increased by 34,200 almost offsetting the full-time loss. In the past 12 months, employment growth in part-time work has been faster than that of full time. The jobless rate increase reflected a 6,900 increase in the number of unemployed and a 5,000 decline in payrolls. The participation rate slipped a notch to 67.9 percent and the employment rate also dipped 0.1 percentage point to 63.7 percent. Employment in the goods producing sector was virtually unchanged while agriculture gained 3,100, natural resources was up by 5,400 and utilities increased by 6,800. Manufacturing payrolls were up just 800 but increases in the sectors taken together were almost wiped out by a 15,900 drop in the construction industry. Services sector jobs were down by 5,400 with the most significant declines seen in business building & other support services (17,800), health care & social assistance (16,900) and accommodation & food (12,300). There was also a small drop in transportation and warehousing (4,100). Declines in these industries just outweighed a respectable advance in professional, scientific & technical services (37,100) and less marked increases in trade (12,900), information, culture & recreation (10,100) and educational services (1,900).
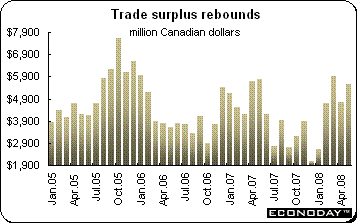 May merchandise trade surplus expanded to C$5.5 billion as exports to countries outside of the U.S hit new record highs and exports to the U.S. itself remained robust. The bilateral surplus with the U.S. was unchanged from its April level at C$8.1 billion. Exports rose a solid 5.4 percent, up for a fifth month in succession with both volumes and prices forging ahead. Inevitably key to the performance was the energy sector which saw exports rise (8.1 percent) for the seventh month in a row. The energy surplus widened out to C$7.2 billion. However, there were also strong increases posted by industrial goods & materials (9.0 percent) and to a lesser extent, agriculture & fishing products (2.6 percent). Exports of automotive products on the other hand declined (3.5 percent) for the third consecutive month. Imports were driven higher by industrial goods & materials (8.7 percent) which jumped sharply on the back of strength in metal & metal ores. Machinery & equipment (4.6 percent) also fared well. The most significant decline was in energy products (3.1 percent) despite a rise in crude petroleum. May merchandise trade surplus expanded to C$5.5 billion as exports to countries outside of the U.S hit new record highs and exports to the U.S. itself remained robust. The bilateral surplus with the U.S. was unchanged from its April level at C$8.1 billion. Exports rose a solid 5.4 percent, up for a fifth month in succession with both volumes and prices forging ahead. Inevitably key to the performance was the energy sector which saw exports rise (8.1 percent) for the seventh month in a row. The energy surplus widened out to C$7.2 billion. However, there were also strong increases posted by industrial goods & materials (9.0 percent) and to a lesser extent, agriculture & fishing products (2.6 percent). Exports of automotive products on the other hand declined (3.5 percent) for the third consecutive month. Imports were driven higher by industrial goods & materials (8.7 percent) which jumped sharply on the back of strength in metal & metal ores. Machinery & equipment (4.6 percent) also fared well. The most significant decline was in energy products (3.1 percent) despite a rise in crude petroleum.
The Bank of England did not surprise anyone as it left its interest rate at 5 percent Thursday as inflation risks make the UK monetary policy committee very reluctant to reduce rates any time soon. European economic data focused primarily on trade and industrial production. The output data were grim, pointing to slowdowns in France, Germany and Italy.
The Banks of Japan and Canada meet this week. No policy change is expected from either. The Bank of Japan’s key interest rate is 0.5 percent while the Bank of Canada’s is 3 percent. Investors continue to wait for another big financial shoe to drop and are doing their best to make it a self-fulfilling prophecy.
| Central Bank activities |
|
| July 15 |
Canada |
Bank of Canada Announcement |
|
Japan |
Bank of Japan Announcement |
|
|
|
| The following indicators will be released this week... |
| Europe |
|
|
| July 14 |
EMU |
Industrial Production (May) |
| July 15 |
Germany |
ZEW Business Survey (July) |
|
UK |
Producer Price Index (June) |
|
|
Consumer Price Index (June) |
| July 16 |
EMU |
Harmonized Index of Consumer Prices (June) |
|
UK |
Labour Market Report (June) |
| July 17 |
Italy |
Merchandise Trade (May) |
| July 18 |
EMU |
Merchandise Trade (May) |
|
Germany |
Producer Price Index (June) |
|
|
|
| Asia/Pacific |
|
|
| July 16 |
Japan |
Tertiary Activity Index (May) |
|
|
|
| Americas |
|
|
| July 16 |
Canada |
Manufacturing Shipments (June) |
Anne D Picker is the author of International Economic Indicators and Central Banks.
|

