|
After reaching multi-month highs, inflation worries resurfaced as producer price data for Germany and the U.S. unsettled investors with their higher than forecast gains. And ever rising crude oil prices didn’t help as new records were set! Equity indexes that had closed at multi-month highs sank back with dramatic declines. The Hang Seng dropped 2.2 percent and the Shanghai Composite sank 4.5 percent on Tuesday while the FTSE lost 2.9 percent. The contagion spread to the Dow. That index lost 1.5 percent on Tuesday and 1.8 percent on Wednesday. All indexes followed here with the exception of the Thai SET, which was up 0.6 percent, were down for the week. For the week, losses ranged from a high of 4.5 percent (Sensex) to a low of 0.1 percent (Jakarta Composite). Only the SET and the Taiwan Taiex in the Asia/Pacific region and the Canadian S&P/TSX and the Mexican Bolsa in North America are up so far in 2008.
Stocks had come a long way in a hurry since the Bear Stearns disaster in March. Analysts think there has been a change in thinking on the economy and an optimistic reading on corporate earnings prospects. But last week’s sell-off could be blamed on a myriad of factors stemming from unpleasant inflation news including record crude prices to revelatory central bank minutes in the UK, Japan, Australia and the U.S. In the U.S. for example, the decline was blamed on changing rate cut expectations stemming from hawkish FOMC minutes and comments from Fed Governor Kevin Warsh along with heightened core inflation and high oil prices. Similarly, minutes from the Bank of England highlighted the need to fight inflation and the Reserve Bank of Australia said they considered increasing rates to stem price increases.
|
|
2007 |
2008 |
% Change |
|
Index |
Dec 31 |
May 16 |
May 23 |
Week |
Year |
| Asia |
|
|
|
|
|
|
| Australia |
All Ordinaries |
6421.0 |
6006.1 |
5866.2 |
-2.3% |
-8.6% |
| Japan |
Nikkei 225 |
15307.8 |
14219.5 |
14012.2 |
-1.5% |
-8.5% |
|
Topix |
1475.7 |
1395.9 |
1376.7 |
-1.4% |
-6.7% |
| Hong Kong |
Hang Seng |
27812.7 |
25618.9 |
24714.1 |
-3.5% |
-11.1% |
| S. Korea |
Kospi |
1897.1 |
1888.9 |
1827.9 |
-3.2% |
-3.6% |
| Singapore |
STI |
3482.3 |
3241.5 |
3122.2 |
-3.7% |
-10.3% |
| China |
Shanghai Composite |
5261.6 |
3624.2 |
3473.1 |
-4.2% |
-34.0% |
|
|
|
|
|
|
|
| India |
Sensex 30 |
20287.0 |
17434.9 |
16649.6 |
-4.5% |
-17.9% |
| Indonesia |
Jakarta Composite |
2745.8 |
2468.8 |
2466.0 |
-0.1% |
-10.2% |
| Malaysia |
KLSE Composite |
1445.0 |
1300.7 |
1274.8 |
-2.0% |
-11.8% |
| Philippines |
PSEi |
3621.6 |
2880.0 |
2849.3 |
-1.1% |
-21.3% |
| Taiwan |
Taiex |
8506.3 |
9197.4 |
8834.7 |
-3.9% |
3.9% |
| Thailand |
SET |
858.1 |
870.3 |
875.6 |
0.6% |
2.0% |
|
|
|
|
|
|
|
| Europe |
|
|
|
|
|
|
| UK |
FTSE 100 |
6456.9 |
6304.30 |
6087.30 |
-3.4% |
-5.7% |
| France |
CAC |
5614.1 |
5078.04 |
4933.77 |
-2.8% |
-12.1% |
| Germany |
XETRA DAX |
8067.3 |
7156.55 |
6944.05 |
-3.0% |
-13.9% |
|
|
|
|
|
|
|
| North America |
|
|
|
|
|
|
| United States |
Dow |
13264.8 |
12986.8 |
12479.6 |
-3.9% |
-5.9% |
|
NASDAQ |
2652.3 |
2528.9 |
2444.7 |
-3.3% |
-7.8% |
|
S&P 500 |
1468.4 |
1425.4 |
1375.9 |
-3.5% |
-6.3% |
| Canada |
S&P/TSX Comp. |
13833.1 |
14984.2 |
14723.4 |
-1.7% |
6.4% |
| Mexico |
Bolsa |
29536.8 |
31487.0 |
31068.7 |
-1.3% |
5.2% |
| Markets were closed in Singapore, India, Malaysia and Thailand on Monday, May 19 |
It was just about all down hill after Monday as stocks plummeted on Tuesday, more than negating the previous day’s gains. And stocks in Europe and the UK were dragged down once again by oil and energy stocks on Thursday and Friday after crude surged to a record above $135 a barrel, prompting investors to punish airlines and other heavy consumers of fuel. But 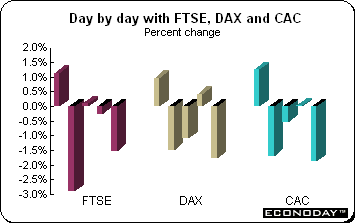 traders piled into companies along the oil producing supply chain — especially those involved in drilling. Fuel cost worries made solar energy companies attractive prospects but airlines were on the sell list as were auto manufacturers. The FTSE, CAC and DAX lost all of the previous week’s gains and then some. The three indexes were down 3.4 percent, 2.8 percent and 3 percent respectively for the week. traders piled into companies along the oil producing supply chain — especially those involved in drilling. Fuel cost worries made solar energy companies attractive prospects but airlines were on the sell list as were auto manufacturers. The FTSE, CAC and DAX lost all of the previous week’s gains and then some. The three indexes were down 3.4 percent, 2.8 percent and 3 percent respectively for the week.
Energy companies alternated from being a positive market force and a negative one as crude oil prices set new records. And raw material producers were sold after a run up in share prices convinced investors it was time to take profits. And at week’s end, U.S. stock indexes did not offer much support to their European counterparts and also declined. The high price of crude continued to put pressure on heavy fuel users such as British Airways.
Bank of England releases minutes
The need to fight inflation led the Bank of England monetary policy committee to vote eight to one to hold interest rates at 5 percent at their May 8th meeting according to the minutes released last week. The MPC already knew when it met that April consumer price inflation had shot up to 3 percent and was likely to climb still higher. Only David Blanchflower, who has consistently voted for lower rates, wanted a quarter-point cut. One of the MPC's biggest worries is that people setting wages and prices will come to expect higher inflation and act accordingly, prolonging price pressures so that a long spell of low growth would be needed to bring inflation back to target. The minutes suggest the MPC thinks it necessary to take a more hawkish stance and tolerate slower growth in order to maintain inflation target credibility.
Most members felt cutting rates would give the impression they were more concerned about stabilizing growth than controlling inflation. They thought the committee “had to make clear to those setting prices and wages that the period of above-target inflation would be temporary and that it was committed to returning inflation to the 2 percent target.” Several economists said these comments suggested the Bank would leave interest rates on hold for the foreseeable future. But others said markets had overreacted to last week's inflation report by pricing out any chance of another rate cut this year. The minutes showed mixed views on the committee over how sharply the economy could slow in response to tighter credit conditions and a squeeze on real incomes.
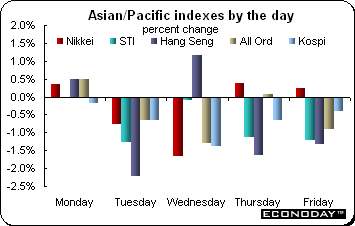 Stock indexes throughout the Asia/Pacific region — with the notable exception of Thailand — reversed direction and were down last week. Renewed growth worries combined with record setting crude oil prices to elevate risk concerns, which in turn sent investors fleeing from equities. Many of the indexes followed here gave back all or most of the previous week’s impressive gains. The indexes that incurred a 3 percent or more loss on the week included the Sensex (down 4.5 percent), Shanghai Composite (down 4.2 percent), Taiex (down 3.9 percent), the STI (down 3.7 percent), the Hang Seng (down 3.5 percent) and the Kospi (down 3.2 percent). The SET was up 0.6 percent. Stock indexes throughout the Asia/Pacific region — with the notable exception of Thailand — reversed direction and were down last week. Renewed growth worries combined with record setting crude oil prices to elevate risk concerns, which in turn sent investors fleeing from equities. Many of the indexes followed here gave back all or most of the previous week’s impressive gains. The indexes that incurred a 3 percent or more loss on the week included the Sensex (down 4.5 percent), Shanghai Composite (down 4.2 percent), Taiex (down 3.9 percent), the STI (down 3.7 percent), the Hang Seng (down 3.5 percent) and the Kospi (down 3.2 percent). The SET was up 0.6 percent.
Although the Nikkei was up three of five days, the index was unable to recoup the combined Tuesday and Wednesday losses. Tuesday’s decline was led by financial and real estate companies after an Australian securities group said that a 16 year streak of rising profits may be ending and analysts downgraded a major Japanese developer. However the week ended on a positive note after exporters’ stocks were boosted by a weaker yen. The Bank of Japan’s monetary policy board minutes that were released Friday for the April 8 and 9 meeting showed that the board members agreed that downside risks to the Japanese economy were rising in the light of unstable global financial markets, a slowing U.S. economy and rising energy and raw material prices. The BoJ kept its key interest rate unchanged at 0.5 percent at the April 8 and 9 meeting as well as during the meetings that followed on April 30 and on May 19 and 20. BoJ minutes are released about six weeks after their policy meetings take place.
After shocks from earthquake felt in equities
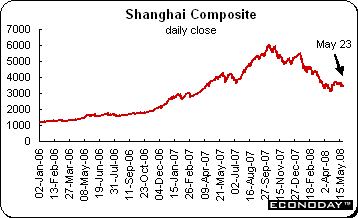 Chinese stocks dropped 4.2 percent last week as concerns about the May 12th earthquake were heightened as new information about damages was revealed. The index suffered its biggest weekly decline since April 18th led by companies reporting fatalities and damage caused by the country's deadliest earthquake in three decades and amid concern the losses would escalate. Investors were concerned that inflation would accelerate on record oil prices and the after effects of the quake. The Sichuan region is an important producer of rice and pork and that fed into investors’ inflation worries. The index is down 34 percent so far this year on concern that the government's measures to tame inflation will dent earnings growth. Hong Kong followed mainland stocks lower with the Hang Seng index shedding 3.5 percent on the week. Chinese stocks dropped 4.2 percent last week as concerns about the May 12th earthquake were heightened as new information about damages was revealed. The index suffered its biggest weekly decline since April 18th led by companies reporting fatalities and damage caused by the country's deadliest earthquake in three decades and amid concern the losses would escalate. Investors were concerned that inflation would accelerate on record oil prices and the after effects of the quake. The Sichuan region is an important producer of rice and pork and that fed into investors’ inflation worries. The index is down 34 percent so far this year on concern that the government's measures to tame inflation will dent earnings growth. Hong Kong followed mainland stocks lower with the Hang Seng index shedding 3.5 percent on the week.
Bank of Japan’s interest rate remains at 0.5 percent
As expected, the Bank of Japan left its key interest rate at 0.5 percent. The vote was unanimous. March inflation data showed that both the consumer price index and the core measure that excludes only fresh food were both up 1.2 percent on the year for the fastest pace in 10 years. However, the core that excludes both fresh food and energy barely managed to edge up 0.1 percent on the year. With its bank rate at only 0.5 percent, the BoJ has little room to maneuver. The BoJ raised the key rate to 0.5 percent in February 2007. The rate is the lowest among major economies.
Since its last meeting at the end of April, first quarter GDP data were released showing that the economy grew 0.8 percent when compared with the previous quarter and 1.1 percent when compared with the previous year. This was slightly below the latest BoJ semiannual outlook which sets the parameters for policy over the next six to 12 months. The BoJ cut its economic growth forecast and predicted inflation would accelerate. The Bank estimated that the economy would grow 1.5 percent in the fiscal year ending March 31, less than an October estimate of 2.1 percent. The report said that the outlook for economic activity and prices is uncertain and, therefore, it is not appropriate to predetermine the direction of future monetary policy. The Bank said it has kept rates unchanged since raising them in February 2007 because risks including higher energy costs and a domestic housing slump have created uncertainty in the economy.
After the meeting, Governor Masaaki Shirakawa said the central bank is focusing on the risk that growth will falter because of a weakening global economy, financial market turmoil and rising commodities costs. Economists say Japan's growth may cool as companies pare spending. Record oil prices and costlier raw materials are squeezing profits and eroding household incomes, discouraging both companies and consumers from spending. Machinery orders, a harbinger of business investment in the next three to six months, fell 8.3 percent in March, more than economists estimated.
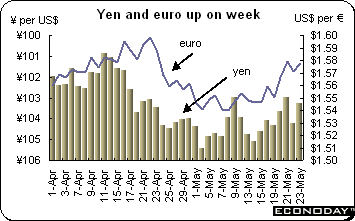 Both the yen and euro were up for the week in volatile trading. The euro strengthened against the dollar and other leading currencies partly because of an unexpected uptick in the highly regarded German Ifo business confidence index. The dollar fell through $1.58 against the euro for the first time in a month Wednesday after the FOMC minutes painted a gloomy picture of the U.S. economy and oil prices continued to surge. Worries that the U.S. economy might be facing a bout of stagflation increased after the Fed downgraded its outlook for growth while, in minutes from their last meeting in late April, expressed concerns over rising inflationary risks. Predictably, the yen moved in concert with investors’ appetite for risk. Both the yen and euro were up for the week in volatile trading. The euro strengthened against the dollar and other leading currencies partly because of an unexpected uptick in the highly regarded German Ifo business confidence index. The dollar fell through $1.58 against the euro for the first time in a month Wednesday after the FOMC minutes painted a gloomy picture of the U.S. economy and oil prices continued to surge. Worries that the U.S. economy might be facing a bout of stagflation increased after the Fed downgraded its outlook for growth while, in minutes from their last meeting in late April, expressed concerns over rising inflationary risks. Predictably, the yen moved in concert with investors’ appetite for risk.
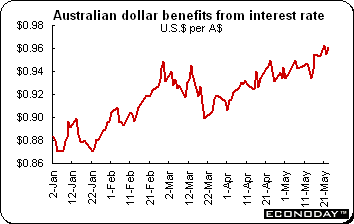 The Australian dollar climbed to its highest since being allowed to trade freely in 1983 versus the U.S. dollar on speculation the nation's higher-yielding government bonds would attract investors and as commodity prices continued to rise. The Australian dollar was trading at $0.961 — the most since February 1983 — just before U.S. trading ended on Friday. Analysts think that the currency appears to be headed toward parity which was last reached in July 1982. The Aussie has climbed almost 9 percent so far in 2008. The currency has attracted overseas investors thanks to the Reserve Bank of Australia’s 7.25 percent interest rate. The RBA minutes which were released earlier this week showed that board members were concerned that inflation remains uncomfortably high. Australia's currency was also boosted as the price of gold, the nation's third-most valuable export, rose to the highest in a month. The Australian dollar climbed to its highest since being allowed to trade freely in 1983 versus the U.S. dollar on speculation the nation's higher-yielding government bonds would attract investors and as commodity prices continued to rise. The Australian dollar was trading at $0.961 — the most since February 1983 — just before U.S. trading ended on Friday. Analysts think that the currency appears to be headed toward parity which was last reached in July 1982. The Aussie has climbed almost 9 percent so far in 2008. The currency has attracted overseas investors thanks to the Reserve Bank of Australia’s 7.25 percent interest rate. The RBA minutes which were released earlier this week showed that board members were concerned that inflation remains uncomfortably high. Australia's currency was also boosted as the price of gold, the nation's third-most valuable export, rose to the highest in a month.
|
|
2007 |
2008 |
% change |
|
|
Dec 31 |
May 16 |
May 23 |
Week |
Year |
| U.S. $ per currency |
|
|
|
|
|
|
| Australia |
A$ |
0.8776 |
0.955 |
0.960 |
0.5% |
9.4% |
| New Zealand |
NZ$ |
0.7740 |
0.774 |
0.786 |
1.6% |
1.5% |
| Canada |
C$ |
1.0120 |
1.000 |
1.012 |
1.2% |
0.0% |
| Eurozone |
euro (€) |
1.4603 |
1.559 |
1.578 |
1.2% |
8.0% |
| UK |
pound sterling (£) |
1.9843 |
1.955 |
1.979 |
1.2% |
-0.2% |
|
|
|
|
|
|
|
| Currency per U.S. $ |
|
|
|
|
|
|
| China |
yuan |
7.2946 |
6.989 |
6.942 |
0.7% |
5.1% |
| Hong Kong |
HK$* |
7.7984 |
7.800 |
7.801 |
0.0% |
0.0% |
| India |
rupee |
39.4100 |
42.540 |
42.750 |
-0.5% |
-7.8% |
| Japan |
yen |
111.7100 |
104.075 |
103.317 |
0.7% |
8.1% |
| Malaysia |
ringgit |
3.3057 |
3.233 |
3.215 |
0.5% |
2.8% |
| Singapore |
Singapore $ |
1.4360 |
1.368 |
1.359 |
0.7% |
5.7% |
| South Korea |
won |
935.8000 |
1038.000 |
1046.300 |
-0.8% |
-10.6% |
| Taiwan |
Taiwan $ |
32.4300 |
30.590 |
30.470 |
0.4% |
6.4% |
| Thailand |
baht |
29.5000 |
32.285 |
32.070 |
0.7% |
-8.0% |
| Switzerland |
Swiss franc |
1.1334 |
1.047 |
1.024 |
2.3% |
10.7% |
|
|
|
|
|
|
|
| *Pegged to U.S. dollar |
|
|
|
|
|
|
| Source: Bloomberg |
|
|
|
|
|
|
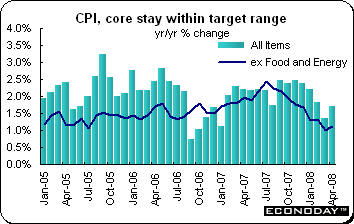
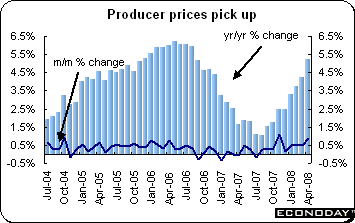 April producer price index jumped 1.1 percent and was up 5.2 percent when compared with last year. The leap in the headline rates was largely due to yet another spike in energy prices which jumped 3.2 percent on the month and now stand some 12.6 percent above their year ago level. Excluding energy, the PPI was up a much more modest 0.4 percent, and 2.7 percent on the year. Outside of energy, there were few monthly gains of significance although raw oil and fat (2.1 percent) and margarine products (7.1 percent) remained under upside pressure. Overall basic goods prices rose 0.8 percent on the month while capital and consumer goods both edged up just 0.1 percent. Within the consumer sector, durables were flat while non-durables matched the sector average. April producer price index jumped 1.1 percent and was up 5.2 percent when compared with last year. The leap in the headline rates was largely due to yet another spike in energy prices which jumped 3.2 percent on the month and now stand some 12.6 percent above their year ago level. Excluding energy, the PPI was up a much more modest 0.4 percent, and 2.7 percent on the year. Outside of energy, there were few monthly gains of significance although raw oil and fat (2.1 percent) and margarine products (7.1 percent) remained under upside pressure. Overall basic goods prices rose 0.8 percent on the month while capital and consumer goods both edged up just 0.1 percent. Within the consumer sector, durables were flat while non-durables matched the sector average.
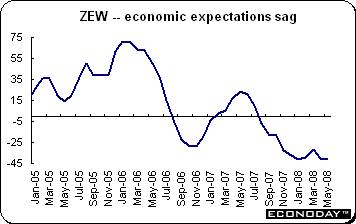 May ZEW current conditions index was up to 38.6 from 33.2 in April. This was the second monthly increase. However expectations slipped to minus 41.4 from minus 40.7 in the previous month. This was the second consecutive dip in this component and its weakest reading since the start of the year. The divergence in the two indices is not unusual and capital markets will typically place the most weight on the expectations element. May ZEW current conditions index was up to 38.6 from 33.2 in April. This was the second monthly increase. However expectations slipped to minus 41.4 from minus 40.7 in the previous month. This was the second consecutive dip in this component and its weakest reading since the start of the year. The divergence in the two indices is not unusual and capital markets will typically place the most weight on the expectations element.
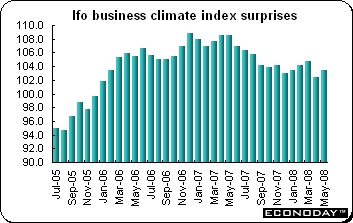 May Ifo sentiment climbed to 103.5 from 102.4 in April. The drift higher was mainly attributable to a rise in the current conditions component (110.1 from 108.4), in line with the latest ZEW survey. However, in contrast to ZEW, the expectations index also crept higher with a 0.6 point gain to 97.3. Among the major sector diffusion indexes, the strongest advance was registered by retail (minus 4.4 from minus 10.9) followed by wholesale (4.0 from 1.6). Morale also improved slightly in manufacturing (15.0 from 13.3) but slipped in construction (minus 20.3 from minus 20.0). Ifo remains relatively optimistic about German economic prospects and sees only a moderate slowdown and growth in GDP of at least 2.0 percent in 2008. May Ifo sentiment climbed to 103.5 from 102.4 in April. The drift higher was mainly attributable to a rise in the current conditions component (110.1 from 108.4), in line with the latest ZEW survey. However, in contrast to ZEW, the expectations index also crept higher with a 0.6 point gain to 97.3. Among the major sector diffusion indexes, the strongest advance was registered by retail (minus 4.4 from minus 10.9) followed by wholesale (4.0 from 1.6). Morale also improved slightly in manufacturing (15.0 from 13.3) but slipped in construction (minus 20.3 from minus 20.0). Ifo remains relatively optimistic about German economic prospects and sees only a moderate slowdown and growth in GDP of at least 2.0 percent in 2008.
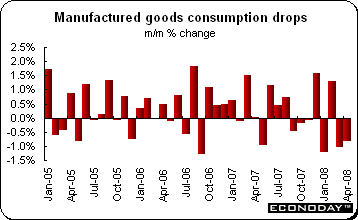 April household spending on manufactured goods dropped 0.8 percent, reducing annual growth to just 0.4 percent. Consumption has now fallen in three of the last four months. The latest decline follows a smaller revised 1.0 percent drop in March and reflected weakness across most sectors. Durables dropped 0.6 percent courtesy of a 2.7 percent slump in autos which more than offset an otherwise impressive 1.6 percent increase in household goods. Textiles declined another 3.0 percent on top of the 2.9 percent fall already posted in March while other products were down 0.1 percent. Excluding autos, spending fell 0.6 percent on the month and 1.4 percent on the year. April household spending on manufactured goods dropped 0.8 percent, reducing annual growth to just 0.4 percent. Consumption has now fallen in three of the last four months. The latest decline follows a smaller revised 1.0 percent drop in March and reflected weakness across most sectors. Durables dropped 0.6 percent courtesy of a 2.7 percent slump in autos which more than offset an otherwise impressive 1.6 percent increase in household goods. Textiles declined another 3.0 percent on top of the 2.9 percent fall already posted in March while other products were down 0.1 percent. Excluding autos, spending fell 0.6 percent on the month and 1.4 percent on the year.
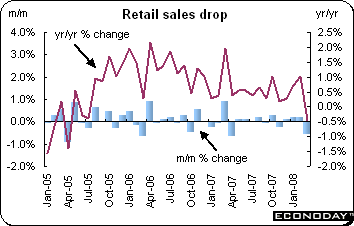 March retail sales were down 0.5 percent and down by the same amount when compared with March of last year. The decline was led by the non-food sector which slumped 0.7 percent from March for an annual decline of 2.3 percent. Food purchases slipped 0.3 percent on the month but remained in positive territory at up 0.8 percent from March 2007. March retail sales were down 0.5 percent and down by the same amount when compared with March of last year. The decline was led by the non-food sector which slumped 0.7 percent from March for an annual decline of 2.3 percent. Food purchases slipped 0.3 percent on the month but remained in positive territory at up 0.8 percent from March 2007.
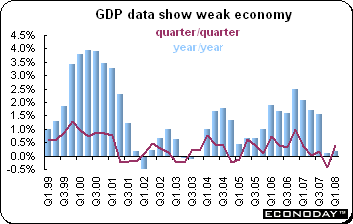 First quarter gross domestic product was up 0.4 percent and 0.2 percent when compared with last year. The long awaited GDP data for the fourth quarter of 2007 which was also released at the same time declined 0.4 percent and was up 0.1 percent on the year. The first quarterly advance was the strongest since the 1.0 percent gain posted at the end of 2006 but coming on the back of the 0.4 percent slump in the previous quarter does nothing to alter a very subdued picture of economic activity. The official statistics body failed to provide any details behind the headline figures apart from indicating that first quarter growth was due to higher output in agriculture, services and industry. First quarter gross domestic product was up 0.4 percent and 0.2 percent when compared with last year. The long awaited GDP data for the fourth quarter of 2007 which was also released at the same time declined 0.4 percent and was up 0.1 percent on the year. The first quarterly advance was the strongest since the 1.0 percent gain posted at the end of 2006 but coming on the back of the 0.4 percent slump in the previous quarter does nothing to alter a very subdued picture of economic activity. The official statistics body failed to provide any details behind the headline figures apart from indicating that first quarter growth was due to higher output in agriculture, services and industry.
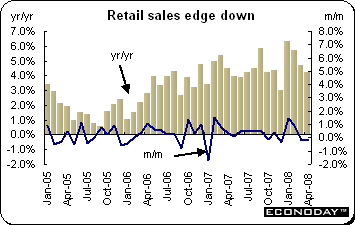 April retail sales volumes edged down 0.2 percent but were up 4.2 percent when compared with last year. This was the first time that volumes have seen monthly back-to-back declines since January 2006. However, the entire drop in the headline index reflected weaker food purchases (1.0 percent) since non-food stores surprisingly saw demand creep higher (0.2 percent) despite a sharp contraction in the household goods sector (1.4 percent). Non-specialized stores (2.5 percent) fared particularly well and other stores (0.7 percent) continued to advance. Clothing & footwear (unchanged) may have been hit by disappointing weather but non-store retailing (1.1 percent) rebounded sharply after a small decline March. Meantime, the retail sales deflator remained strongly in negative territory, down 0.9 percent from a year ago. April retail sales volumes edged down 0.2 percent but were up 4.2 percent when compared with last year. This was the first time that volumes have seen monthly back-to-back declines since January 2006. However, the entire drop in the headline index reflected weaker food purchases (1.0 percent) since non-food stores surprisingly saw demand creep higher (0.2 percent) despite a sharp contraction in the household goods sector (1.4 percent). Non-specialized stores (2.5 percent) fared particularly well and other stores (0.7 percent) continued to advance. Clothing & footwear (unchanged) may have been hit by disappointing weather but non-store retailing (1.1 percent) rebounded sharply after a small decline March. Meantime, the retail sales deflator remained strongly in negative territory, down 0.9 percent from a year ago.
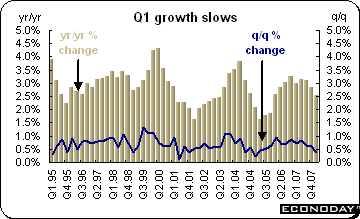 First quarter gross domestic product was up 0.4 percent and 2.5 percent when compared with last year. The data were unrevised from last month’s flash estimate. The data confirm that the economy was propelled forward by the consumer sector which posted a quarterly gain in spending of 1.3 percent, its largest increase since the fourth quarter of 2006. This area was supported by the government sector where final consumption was up 1.0 percent. However, gains here were countered by a 1.6 percent slump in gross fixed capital formation, its largest decline since the beginning of 2003. As a result, total domestic expenditures edged up 0.1 percent from the previous period or 2.6 percent on the year. Activity in all production industries were down 0.2 percent on the quarter but this was heavily biased by a drop of 4.6 percent in mining & quarrying and a 1.3 percent decline in electricity and gas. Manufacturing output was up 0.3 percent. Meanwhile, the agriculture, forestry and fish sector grew 0.7 percent. Within service sector industries, total output grew 0.5 percent from the pervious period and 2.9 percent from a year ago. The quarterly increase here was led by transport & communication (1.0 percent) but there were respectable advances too in distribution, hotels & catering (0.7 percent), business services & finance (0.5 percent) and government (0.5 percent). First quarter gross domestic product was up 0.4 percent and 2.5 percent when compared with last year. The data were unrevised from last month’s flash estimate. The data confirm that the economy was propelled forward by the consumer sector which posted a quarterly gain in spending of 1.3 percent, its largest increase since the fourth quarter of 2006. This area was supported by the government sector where final consumption was up 1.0 percent. However, gains here were countered by a 1.6 percent slump in gross fixed capital formation, its largest decline since the beginning of 2003. As a result, total domestic expenditures edged up 0.1 percent from the previous period or 2.6 percent on the year. Activity in all production industries were down 0.2 percent on the quarter but this was heavily biased by a drop of 4.6 percent in mining & quarrying and a 1.3 percent decline in electricity and gas. Manufacturing output was up 0.3 percent. Meanwhile, the agriculture, forestry and fish sector grew 0.7 percent. Within service sector industries, total output grew 0.5 percent from the pervious period and 2.9 percent from a year ago. The quarterly increase here was led by transport & communication (1.0 percent) but there were respectable advances too in distribution, hotels & catering (0.7 percent), business services & finance (0.5 percent) and government (0.5 percent).
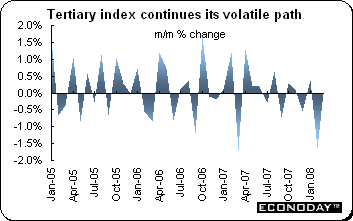 The March tertiary sector index rebounded 0.3 percent and was up 0.1 percent when compared with last year (seasonally adjusted). March’s monthly increase fell short of the anticipated 1.0 percent gain. The 11 service industries tracked by the index account for roughly 60 percent of Japan's economic output. Among them are utilities, transport, telecommunications, wholesale and retail, finance and insurance, real estate, restaurants and hotels, as well as medical, health care and welfare. The March tertiary sector index rebounded 0.3 percent and was up 0.1 percent when compared with last year (seasonally adjusted). March’s monthly increase fell short of the anticipated 1.0 percent gain. The 11 service industries tracked by the index account for roughly 60 percent of Japan's economic output. Among them are utilities, transport, telecommunications, wholesale and retail, finance and insurance, real estate, restaurants and hotels, as well as medical, health care and welfare.
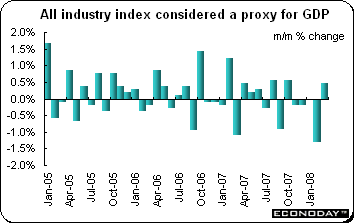 March all industry index was up 0.5 percent but down 0.4 percent when compared with last year. The tertiary index, which was released earlier this week, rebounded 0.3 percent. The all industry index takes a reading of activity in the 11 industries that comprise the tertiary index, along with activity in the construction, agricultural & fisheries industries, the public sector and industrial output. This index is considered a close approximation of gross domestic product growth as measured by industrial and service sector output. March all industry index was up 0.5 percent but down 0.4 percent when compared with last year. The tertiary index, which was released earlier this week, rebounded 0.3 percent. The all industry index takes a reading of activity in the 11 industries that comprise the tertiary index, along with activity in the construction, agricultural & fisheries industries, the public sector and industrial output. This index is considered a close approximation of gross domestic product growth as measured by industrial and service sector output.
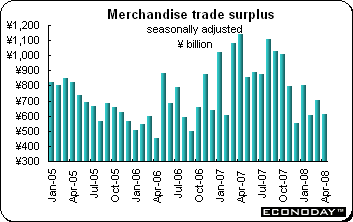 April unadjusted merchandise trade surplus was ¥485 billion, down 46.3 percent from the year ago balance of ¥903 billion. On the year, exports were up 4.0 percent while imports were up a sharp 11.9 percent. The surplus continues to shrink due to surging oil prices and the strong yen. On a seasonally adjusted basis, the trade surplus declined to ¥609 billion from ¥706 billion in March. Exports were down 3.2 percent while imports slipped 2.0 percent. Exports to the U.S. were down 9.1 percent on the year but the decline was partially offset by exports to Asia and Western Europe which were up 7.2 percent and 1.1 percent respectively. Imports from the U.S. were down 6.7 percent while imports from Asia rose 4.6 percent and jumped 6.8 percent from Western Europe. Imports of mineral fuels were up 54.5 percent within which petroleum soared by 55.0 percent on the year while petroleum products were up 33.8 percent. Exports of machinery were barely better than flat with an anemic 0.3 percent on the year gain while those of electrical machinery slipped 0.5 percent. Transportation equipment exports were up 9.1 percent on the year. April unadjusted merchandise trade surplus was ¥485 billion, down 46.3 percent from the year ago balance of ¥903 billion. On the year, exports were up 4.0 percent while imports were up a sharp 11.9 percent. The surplus continues to shrink due to surging oil prices and the strong yen. On a seasonally adjusted basis, the trade surplus declined to ¥609 billion from ¥706 billion in March. Exports were down 3.2 percent while imports slipped 2.0 percent. Exports to the U.S. were down 9.1 percent on the year but the decline was partially offset by exports to Asia and Western Europe which were up 7.2 percent and 1.1 percent respectively. Imports from the U.S. were down 6.7 percent while imports from Asia rose 4.6 percent and jumped 6.8 percent from Western Europe. Imports of mineral fuels were up 54.5 percent within which petroleum soared by 55.0 percent on the year while petroleum products were up 33.8 percent. Exports of machinery were barely better than flat with an anemic 0.3 percent on the year gain while those of electrical machinery slipped 0.5 percent. Transportation equipment exports were up 9.1 percent on the year.
Hong Kong — February through April unemployment rate edged down to 3.3 percent from 3.4 percent for the January through March period thanks to modest employment expansion. Domestic consumption-related employers continue to add jobs which offset the loss in external sectors.
April consumer prices were up 5.4 percent from a year earlier after gaining 4.2 percent in March. Inflation accelerated as food and fuel became more expensive and a local currency pegged to the U.S. dollar boosted import costs. The government has cut taxes and distributed subsidies to help people cope with higher prices.
Taiwan — April seasonally adjusted unemployment rate edged up to 3.92 percent from 3.90 percent in March as weakened trade activities slowed employment growth last month.
Singapore — First quarter gross domestic product increased by 14.6 percent and 6.7 percent when compared with the same quarter a year earlier. Quarterly growth was below the 16.9 percent attained in the fourth quarter of 2007.
April consumer prices increased 7.5 percent when compared with last year thanks to soaring food prices. On a monthly basis, CPI was up 1.2 percent, while the seasonally adjusted monthly figure was 0.9 percent. Food prices were up 0.8 percent and 8.5 percent on the year.
 April consumer price index was up 0.8 percent and 1.7 percent when compared with last year. Core CPI, which excludes food and energy, was up a much more modest 0.3 percent and is 1.1 percent higher on the year. The Bank of Canada core CPI which excludes eight volatile items was up 0.3 percent and 1.5 percent on the year. The Bank of Canada’s inflation target range is 1 percent to 3 percent focusing on the 2 percent median. The main boost to inflation came from gasoline. Energy prices climbed some 4.9 percent on the month or 8.0 percent from the same period of 2007. The next most significant monthly rises were seen in transportation (2.0 percent), shelter (0.9 percent) and food (0.8 percent). Household operations & furnishings (0.3 percent), health & personal care (0.4 percent), recreation, education & reading (0.3 percent) and alcohol (0.1 percent) were all quite subdued. Prices fell in clothing & footwear (1.8 percent) and now show an annual decline of 3.5 percent. April consumer price index was up 0.8 percent and 1.7 percent when compared with last year. Core CPI, which excludes food and energy, was up a much more modest 0.3 percent and is 1.1 percent higher on the year. The Bank of Canada core CPI which excludes eight volatile items was up 0.3 percent and 1.5 percent on the year. The Bank of Canada’s inflation target range is 1 percent to 3 percent focusing on the 2 percent median. The main boost to inflation came from gasoline. Energy prices climbed some 4.9 percent on the month or 8.0 percent from the same period of 2007. The next most significant monthly rises were seen in transportation (2.0 percent), shelter (0.9 percent) and food (0.8 percent). Household operations & furnishings (0.3 percent), health & personal care (0.4 percent), recreation, education & reading (0.3 percent) and alcohol (0.1 percent) were all quite subdued. Prices fell in clothing & footwear (1.8 percent) and now show an annual decline of 3.5 percent.
 March retail sales edged up 0.1 percent and were up 4.6 percent when compared with the same month a year ago. However, in volume terms sales climbed a significantly faster 0.5 percent from February and so maintained the pattern of increases seen every month since October barring February. The most prominent monthly gains were posted by pharmacies and personal care stores (1.1 percent), autos (0.4 percent), food & beverages (0.3 percent) and miscellaneous retailers (0.4 percent). Against this were declines in purchases of clothing & accessories (2.6 percent) where bad weather in Quebec was probably a factor, outdoor home supplies (0.5 percent) and general merchandise (0.5 percent). Excluding autos, sales were unchanged on the month and up 4.8 percent on the year. March retail sales edged up 0.1 percent and were up 4.6 percent when compared with the same month a year ago. However, in volume terms sales climbed a significantly faster 0.5 percent from February and so maintained the pattern of increases seen every month since October barring February. The most prominent monthly gains were posted by pharmacies and personal care stores (1.1 percent), autos (0.4 percent), food & beverages (0.3 percent) and miscellaneous retailers (0.4 percent). Against this were declines in purchases of clothing & accessories (2.6 percent) where bad weather in Quebec was probably a factor, outdoor home supplies (0.5 percent) and general merchandise (0.5 percent). Excluding autos, sales were unchanged on the month and up 4.8 percent on the year.
While the number of new economic data releases might have been light last week, their import certainly was not. Unpleasantly high producer price increases in Germany and the U.S. discomforted investors as did record setting crude oil prices. West Texas Intermediate continued its meteoric rise, peaking at $135.09 a barrel amid continued worries that demand would outstrip supply within the next few years. Long-term prices rose even more sharply, fuelling fresh fears about global economic growth. Several central banks released minutes of recent policy meetings. All expressed concerns over inflation. Equity investors had to digest the fact that rate cuts, barring an apocalypse would not be forthcoming soon — and in fact, rates could increase instead.
With markets in the U.S. and UK closed Monday, investors will have a shortened week to deal with new economic data. Eurozone data will focus on the EU consumer and business survey for the latest in sentiment readings along with the flash reading for May’s harmonized index of consumer prices. And producer price data will be released by France and Italy. In Canada, first quarter gross domestic product will finally be available with most analysts expecting little if any growth. And in Japan, the markets will absorb the usual end of month data deluge including reports on industrial production, consumer prices, unemployment, retail sales and household spending.
| The following indicators will be released this week... |
| Europe |
|
|
| May 27 |
Germany |
Gross Domestic Product Q1.08) |
|
|
Ifo Survey (May) |
| May 29 |
EMU |
M3 Money Supply (April) |
|
Germany |
Unemployment (May) |
| May 30 |
EMU |
EU Business and Consumer Confidence (May) |
|
|
Harmonized Index of Consumer Prices (May, flash) |
|
|
Unemployment (April) |
|
Germany |
Retail Sales (April) |
|
France |
Producer Price Index (April) |
|
Italy |
Producer Price Index (April) |
|
|
|
| Asia/Pacific |
|
|
| May 29 |
Japan |
Retail Sales (April) |
| May 30 |
Japan |
Consumer Price Index (April) |
|
|
Household Spending (April) |
|
|
Unemployment/Employment (April) |
|
|
Industrial Production (April) |
|
|
|
| Americas |
|
|
| May 30 |
Canada |
Gross Domestic Product Q1.08) |
|
|
Monthly Gross Domestic Product (March) |
|
|
Industrial Product Price Index (April) |
|
|
Raw Materials Price Index (April) |
Anne D Picker is the author of International Economic Indicators and Central Banks.
|
