|
With growth slowing and inflation rising, investors listened keenly to Federal Reserve Chairman Ben Bernanke’s semi-annual testimony to Congressional committees on Wednesday and Thursday. And what he had to say did not calm financial market jitters. He acknowledged that economic growth is slowing but he does not think there will be a recession. He also said that some small and medium banks could fail under the pressures from the credit crunch. Concerning inflation, Chairman Bernanke said that he focuses on the forecast for inflation and expectations rather than current numbers. According to the forecast, oil prices will level off while the weak economy will preclude the building of price pressures. At the same time, members of the European Central Bank’s governing council continued to recite the necessity of mooring inflationary expectations — and the importance of an inflation targeting regime or finite target to anchor those expectations.
The second month of 2008 saw a turnaround for some indexes followed here but minimal recovery of January’s steep losses. In Asia, for the month of February, the Nikkei inched up 0.1 percent after losing 11.2 percent in January. The STI gained 1.5 percent after losing 14.4 percent in January while the Hang Seng gained 3.7 percent after sinking 15.7 percent. The Kospi was up 5.4 percent after dropping 14.4 percent. The Jakarta Composite, the Thai SET and Taiwan Taiex also were up on the month. In Europe, the FTSE edged up 0.1 percent but the DAX and CAC were both down. And in North America, the S&P/TSX Composite and Bolsa gained 3.3 percent and 0.4 percent respectively on the month.
Just as the U.S. dollar dropped, commodity prices — especially crude oil and gold — hit new highs. The Friday afternoon London gold price fixing was $971.50 while West Texas Intermediate crude hit $103.05 in early trading but then receded after the dollar stabilized against the euro. Traders said that the robustness displayed by oil prices, given the evidence that U.S. demand is weakening, is testament to the influx of investment money fleeing bond and equity markets and moving into commodities.
|
|
2007 |
2008 |
% Change |
|
Index |
Dec 31 |
Feb 22 |
Feb 29 |
Week |
Jan |
Feb |
Year |
| Asia |
|
|
|
|
|
|
|
|
| Australia |
All Ordinaries |
6421.0 |
5644.5 |
5674.7 |
0.5% |
-11.3% |
-0.4% |
-11.6% |
| Japan |
Nikkei 225 |
15307.8 |
13500.5 |
13603.0 |
0.8% |
-11.2% |
0.1% |
-11.1% |
|
Topix |
1475.7 |
1321.4 |
1324.3 |
0.2% |
-8.8% |
-1.6% |
-10.3% |
| Hong Kong |
Hang Seng |
27812.7 |
23305.0 |
24331.7 |
4.4% |
-15.7% |
3.7% |
-12.5% |
| S. Korea |
Kospi |
1897.1 |
1686.5 |
1711.6 |
1.5% |
-14.4% |
5.4% |
-9.8% |
| Singapore |
STI |
3482.3 |
3048.6 |
3026.5 |
-0.7% |
-14.4% |
1.5% |
-13.1% |
| China |
Shanghai Composite |
5261.6 |
4370.3 |
4348.6 |
-0.5% |
-16.7% |
-0.8% |
-17.4% |
|
|
|
|
|
|
|
|
|
| India |
Sensex 30 |
20287.0 |
17349.1 |
17578.7 |
1.3% |
-13.0% |
-0.4% |
-13.3% |
| Indonesia |
Jakarta Composite |
2745.8 |
2741.2 |
2721.9 |
-0.7% |
-4.3% |
3.6% |
-0.9% |
| Malaysia |
KLSE Composite |
1445.0 |
1369.5 |
1357.4 |
-0.9% |
-3.6% |
-2.6% |
-6.1% |
| Philippines |
PSEi |
3621.6 |
3080.2 |
3130.0 |
1.6% |
-9.8% |
-4.2% |
-13.6% |
| Taiwan |
Taiex |
8506.3 |
8108.7 |
8412.8 |
3.7% |
-11.6% |
11.9% |
-1.1% |
| Thailand |
SET |
858.1 |
826.9 |
845.8 |
2.3% |
-8.6% |
7.8% |
-1.4% |
|
|
|
|
|
|
|
|
|
| Europe |
|
|
|
|
|
|
|
|
| UK |
FTSE 100 |
6456.9 |
5888.5 |
5884.3 |
-0.1% |
-8.9% |
0.1% |
-8.9% |
| France |
CAC |
5614.1 |
4824.6 |
4790.7 |
-0.7% |
-13.3% |
-1.6% |
-14.7% |
| Germany |
XETRA DAX |
8067.3 |
6806.3 |
6748.1 |
-0.9% |
-15.1% |
-1.5% |
-16.4% |
|
|
|
|
|
|
|
|
|
| North America |
|
|
|
|
|
|
|
| United States |
Dow |
13264.8 |
12381.0 |
12266.4 |
-0.9% |
-4.6% |
-3.0% |
-7.5% |
|
NASDAQ |
2652.3 |
2303.4 |
2271.5 |
-1.4% |
-9.9% |
-5.0% |
-14.4% |
|
S&P 500 |
1468.4 |
1353.1 |
1330.6 |
-1.7% |
-6.1% |
-3.5% |
-9.4% |
| Canada |
S&P/TSX Comp. |
13833.1 |
13585.9 |
13582.7 |
0.0% |
-4.9% |
3.3% |
-1.8% |
| Mexico |
Bolsa |
29536.8 |
29528.8 |
28918.5 |
-2.1% |
-2.5% |
0.4% |
-2.1% |
| Markets were closed in the Philippines on Monday, February 25. |
|
|
|
| Markets were closed in Taiwan on Thursday, February 28. |
|
|
|
The FTSE, DAX and CAC declined on the week despite robust gains on Monday and Tuesday. In Europe, stocks were dragged down by faltering consumer confidence in France where the index sank to its lowest level since the measure was introduced in 1987. As we know from past experience, stock performance here is not immune to pulls from across the Atlantic. In this case, it was Mr. Bernanke’s testimony Thursday which combined with disappointing U.S. economic data that pulled U.S. and European stocks down. The declines continued on Friday — but not on Fedspeak — rather on dismal economic news in Europe and the U.S.
 While all three indexes are down so far this year, the FTSE managed to edge up 0.1 percent for February. The CAC and DAX were down 1.62 percent and 1.5 percent respectively. While not gaining for the month, the losses were much less severe than in January when the CAC lost 13.3 percent and the DAX, 15.1 percent. While all three indexes are down so far this year, the FTSE managed to edge up 0.1 percent for February. The CAC and DAX were down 1.62 percent and 1.5 percent respectively. While not gaining for the month, the losses were much less severe than in January when the CAC lost 13.3 percent and the DAX, 15.1 percent.
February economic sentiment weakened perceptively in the EU. The indicator is regarded as a good guide to likely future trends and dropped to 100.1 from 101.7 in January. The decline was led by the service sector. However, the index for Spain, hit by fears of a bursting property bubble, was particularly gloomy. It plunged to the lowest level since January 1994. Italy’s index also dropped steeply, to the lowest level since August 2005. The slowdown will encourage speculation that the ECB will be forced to cut interest rates in coming months, But inflation rates far above the ECB’s 2 percent target suggest that no cut is imminent.
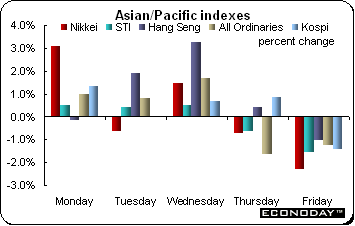
Despite declines on Thursday and Friday, most indexes managed to hold onto earlier gains to end the week on a positive note. However, the STI and the Shanghai, Jakarta and KLSE Composites were down on the week. The plethora of economic data releases were skewed towards Thursday and Friday, especially in the U.S. and Europe. And the miserable data emanating from the U.S. especially heightened worries about recessionary prospects and dampened investor spirits.
 New Japanese data, also released on Thursday and Friday (local time), provided a mixed picture on the state of their economy. Both industrial production and housing starts were down while inflation was up, unemployment was unchanged at 3.8 percent and household spending and retail trade gained. But export-oriented stocks were down both on the outlook for the U.S. economy and the rising value of the yen which cuts into the competitiveness of those who sell abroad and impacts repatriated profits — an important issue as the fiscal year draws to a close on March 31. New Japanese data, also released on Thursday and Friday (local time), provided a mixed picture on the state of their economy. Both industrial production and housing starts were down while inflation was up, unemployment was unchanged at 3.8 percent and household spending and retail trade gained. But export-oriented stocks were down both on the outlook for the U.S. economy and the rising value of the yen which cuts into the competitiveness of those who sell abroad and impacts repatriated profits — an important issue as the fiscal year draws to a close on March 31.
Banking stocks were negatively affected by Fed Chairman Bernanke’s comments that smaller and medium sized banks might fail due to the subprime credit crisis. Across the region Friday, banks and property companies led the declines with carmakers and chip producers not far behind. Japanese exporters were hit negatively by a stronger yen which dampens their competitiveness.
Hong Kong was a bright spot during the week as real estate developers continued to rally on the decision to extend a waiver on quarterly property rates for a year. The prospect of lower interest rates in the U.S. also helped, given the Hong Kong dollar’s peg to its U.S. counterpart.
The slowdown in both the U.S. and Europe combined with monetary tightening by the Peoples Bank of China are depressing the Chinese stock market. The Shanghai Composite reached a peak of 6092 on October 16th but ended February at 4348.64 for its fourth consecutive monthly decline. The index is now down about 40 percent from its October high.
The dollar hit an all-time low against the euro and a three year low against the yen last week. The reason traders give is that the Federal Reserve sees the weakening currency as a positive in helping the economy. Although Treasury Secretary Henry Paulson reiterated yesterday he favors 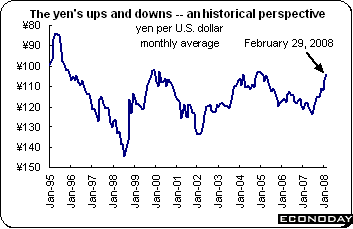 a strong dollar and President George W. Bush said the currency should reflect the economy's “fundamentals,” Bernanke told a Senate committee that the declines have helped narrow the trade deficit and were a positive for the economy. While Bernanke has deferred questions on the dollar to the Treasury before, analysts thought he was expressing indifference to the dollar’s decline. Analysts also said that his comments heightened negative sentiment on U.S. fundamentals. Traders have long been skeptical of the Treasury Secretary and President’s advocacy of the dollar. As a result, the dollar dropped below 104 yen to its lowest level in almost three years. The dollar’s slide has also helped to push oil and gold to record highs. a strong dollar and President George W. Bush said the currency should reflect the economy's “fundamentals,” Bernanke told a Senate committee that the declines have helped narrow the trade deficit and were a positive for the economy. While Bernanke has deferred questions on the dollar to the Treasury before, analysts thought he was expressing indifference to the dollar’s decline. Analysts also said that his comments heightened negative sentiment on U.S. fundamentals. Traders have long been skeptical of the Treasury Secretary and President’s advocacy of the dollar. As a result, the dollar dropped below 104 yen to its lowest level in almost three years. The dollar’s slide has also helped to push oil and gold to record highs.
According to some currency traders, dollar carry trades are emerging as hedge funds and other speculators have started borrowing the U.S. dollar to invest in higher-yielding currencies such as the Australian dollar. Yen carry trades had been popular until recently because of low Japanese interest rates that made the yen an attractive funding currency. With more cuts expected in U.S. interest rates anticipated, the fed funds target could easily fall below Switzerland's 2.75 percent to become the second lowest after Japan's.
EMU
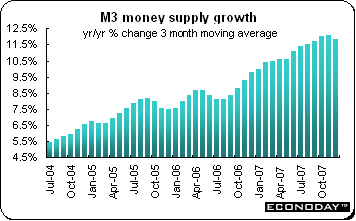 January M3 money supply was up 11.5 percent after climbing 11.6 percent in December. The three month moving average — the ECB’s preferred measure of money supply — was up 11.8 percent and down somewhat from December’s 12.1 percent gain when compared with the same three months a year ago. Lending to the private sector was up 11.1 percent on the year, or just 0.1 percent below from its December rate despite tighter market conditions. Corporate loan demand was especially robust. January M3 money supply was up 11.5 percent after climbing 11.6 percent in December. The three month moving average — the ECB’s preferred measure of money supply — was up 11.8 percent and down somewhat from December’s 12.1 percent gain when compared with the same three months a year ago. Lending to the private sector was up 11.1 percent on the year, or just 0.1 percent below from its December rate despite tighter market conditions. Corporate loan demand was especially robust.
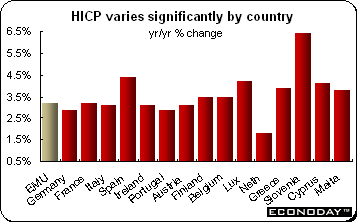 January harmonized index of consumer prices was down 0.4 percent but up 3.2 percent when compared with last year. Core HICP which excludes food, drink, tobacco and petroleum dropped 0.2 percent and was up a tame 1.7 percent on the year. Other core HICP measures which exclude energy and unprocessed foods and exclude energy and processed foods were up 2.3 percent and 2.4 percent respectively on the year. Prices fell significantly over the month in clothing (9.3 percent) for seasonal reasons and were also lower in recreation & culture (2.2 percent) and in hotels & restaurants (0.3 percent). The main increases were in energy (1.6 percent) and food (1.1 percent) although there was also a sizeable increase in housing (1.0 percent). January harmonized index of consumer prices was down 0.4 percent but up 3.2 percent when compared with last year. Core HICP which excludes food, drink, tobacco and petroleum dropped 0.2 percent and was up a tame 1.7 percent on the year. Other core HICP measures which exclude energy and unprocessed foods and exclude energy and processed foods were up 2.3 percent and 2.4 percent respectively on the year. Prices fell significantly over the month in clothing (9.3 percent) for seasonal reasons and were also lower in recreation & culture (2.2 percent) and in hotels & restaurants (0.3 percent). The main increases were in energy (1.6 percent) and food (1.1 percent) although there was also a sizeable increase in housing (1.0 percent).
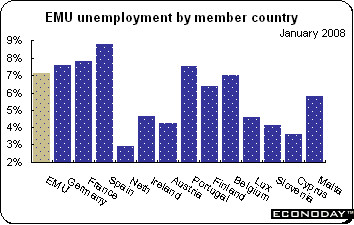 January unemployment edged down to 7.1 percent from 7.2 percent in December. Among the larger reporting countries, jobless rates slipped in Germany (7.6 percent from 7.8 percent) and France (7.8 percent from 7.9 percent). Unemployment was up in Spain (8.8 percent from 8.7 percent) while Italy did not furnish any data. January unemployment edged down to 7.1 percent from 7.2 percent in December. Among the larger reporting countries, jobless rates slipped in Germany (7.6 percent from 7.8 percent) and France (7.8 percent from 7.9 percent). Unemployment was up in Spain (8.8 percent from 8.7 percent) while Italy did not furnish any data.
EU
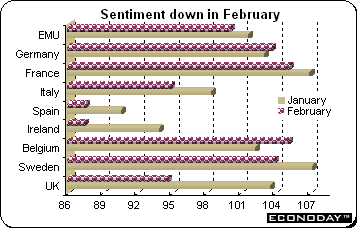 February business and consumer sentiment sank to 100.1 from 101.7 in January and its lowest reading in two years. All sectors were down with the exception of retail which posted an increase to plus 1 from minus 3 in January. Services declined to a reading of 10 from 13 while construction edged down to minus 7 from minus 6. The consumer sector held steady at plus 12. Most member states were down with the exception of Germany which managed a small gain. February business and consumer sentiment sank to 100.1 from 101.7 in January and its lowest reading in two years. All sectors were down with the exception of retail which posted an increase to plus 1 from minus 3 in January. Services declined to a reading of 10 from 13 while construction edged down to minus 7 from minus 6. The consumer sector held steady at plus 12. Most member states were down with the exception of Germany which managed a small gain.
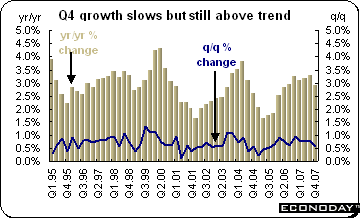
Germany
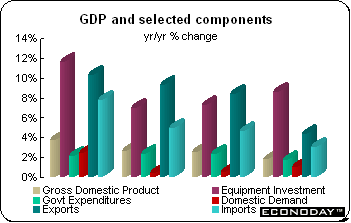 Fourth quarter gross domestic product was up 0.3 percent and 1.8 percent when compared with the same quarter a year ago. There were two main drivers to growth — investment (1.1 percent) thanks to a surge in equipment spending (3.4 percent) and net exports as a strong rise in exports (1.3 percent) contrasted with a modest decline in imports (0.2 percent). However, total domestic demand dropped 0.5 percent on the back of significant drops in private consumption (0.8 percent) and government spending (0.5 percent). Inventory accumulation had a small negative impact of 0.1 percentage points. Fourth quarter gross domestic product was up 0.3 percent and 1.8 percent when compared with the same quarter a year ago. There were two main drivers to growth — investment (1.1 percent) thanks to a surge in equipment spending (3.4 percent) and net exports as a strong rise in exports (1.3 percent) contrasted with a modest decline in imports (0.2 percent). However, total domestic demand dropped 0.5 percent on the back of significant drops in private consumption (0.8 percent) and government spending (0.5 percent). Inventory accumulation had a small negative impact of 0.1 percentage points.
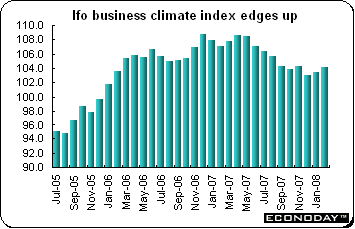 February Ifo business sentiment index edged up to 104.1 from 103.4 in January as the assessment of the current economic climate jumped from 107.9 to 110.3. However, the improvement in optimism here was tinged by weakening expectations which declined to 98.2 from 99.0 in January. By sector, the largest gain occurred in retail (1.3 from -17.5) which returned to positive territory for the first time in more than a year. There was also an improvement in wholesale (5.8 from 3.2). However, these gains were almost mitigated by declines in both manufacturing (16.3 from 17.4) and construction (-24.9 from -16.9). February Ifo business sentiment index edged up to 104.1 from 103.4 in January as the assessment of the current economic climate jumped from 107.9 to 110.3. However, the improvement in optimism here was tinged by weakening expectations which declined to 98.2 from 99.0 in January. By sector, the largest gain occurred in retail (1.3 from -17.5) which returned to positive territory for the first time in more than a year. There was also an improvement in wholesale (5.8 from 3.2). However, these gains were almost mitigated by declines in both manufacturing (16.3 from 17.4) and construction (-24.9 from -16.9).
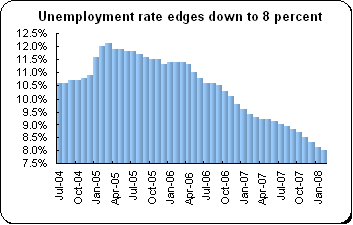 February unemployment rate inched down to 8 percent after the number of unemployed dropped by 75,000. The number of unemployed now stands at 3,336,000. Of the 75,000 drop, 51,000 occurred in the West and dipped 24,000 in the East. Employment data carry a one month lag but a solid 73,000 advance in January payrolls easily eclipsed a 47,000 gain at the end of 2007. February unemployment rate inched down to 8 percent after the number of unemployed dropped by 75,000. The number of unemployed now stands at 3,336,000. Of the 75,000 drop, 51,000 occurred in the West and dipped 24,000 in the East. Employment data carry a one month lag but a solid 73,000 advance in January payrolls easily eclipsed a 47,000 gain at the end of 2007.
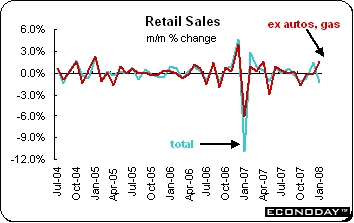 January total retail sales were down 1.3 percent and up 2.1 percent when compared with January a year ago. However, retail sales excluding autos were up 1.6 percent and were up 0.6 percent on the year. Growth was dominated by the non-food sector where sales were underpinned by substantial gains in furniture & household products (4.0 percent), and other assorted goods (4.0 percent). There were also tidy advances in clothing & shoes (2.0 percent) and pharmaceuticals, medical & cosmetics products (1.9 percent). However, sales fell steeply in the food & beverages area (1.9 percent) with non-specialized stores especially soft (down 2.0 percent). January total retail sales were down 1.3 percent and up 2.1 percent when compared with January a year ago. However, retail sales excluding autos were up 1.6 percent and were up 0.6 percent on the year. Growth was dominated by the non-food sector where sales were underpinned by substantial gains in furniture & household products (4.0 percent), and other assorted goods (4.0 percent). There were also tidy advances in clothing & shoes (2.0 percent) and pharmaceuticals, medical & cosmetics products (1.9 percent). However, sales fell steeply in the food & beverages area (1.9 percent) with non-specialized stores especially soft (down 2.0 percent).
France
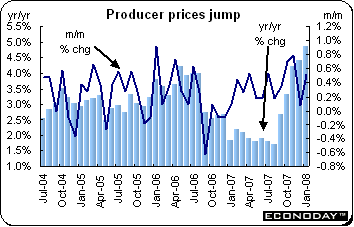 January producer price index was up 0.5 percent and 4.9 percent when compared with last year. Core PPI excluding food and energy was up 0.5 percent and 1.6 percent on the year. The largest sectoral increases were in semi-finished goods (1.0 percent) where mineral costs jumped sharply (3.0 percent) and energy (0.6 percent) which was biased higher by surging electricity, gas & water prices (2.4 percent). Capital goods (0.6 percent) and machines (1.0 percent) also posted above average increases. Within the consumer area, the only major sub-sector to register an increase was household durables (0.8 percent) as both clothing (down 1.4 percent) and drugs & healthcare (down 0.7 percent) saw declines. January producer price index was up 0.5 percent and 4.9 percent when compared with last year. Core PPI excluding food and energy was up 0.5 percent and 1.6 percent on the year. The largest sectoral increases were in semi-finished goods (1.0 percent) where mineral costs jumped sharply (3.0 percent) and energy (0.6 percent) which was biased higher by surging electricity, gas & water prices (2.4 percent). Capital goods (0.6 percent) and machines (1.0 percent) also posted above average increases. Within the consumer area, the only major sub-sector to register an increase was household durables (0.8 percent) as both clothing (down 1.4 percent) and drugs & healthcare (down 0.7 percent) saw declines.
Italy
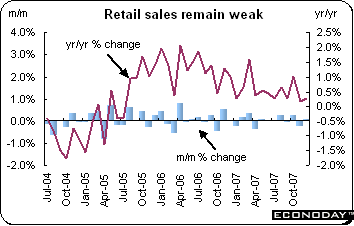 December retail sales edged up 0.1 percent but were down 0.6 percent when compared with December 2006. For calendar 2007, sales were up a meagre 0.5 percent with the bulk of the advance occurring during the first few months. The December increase was concentrated in the food sector which was up 0.1 percent. Non-food demand was unchanged on the month and down 1.1 percent on the year. On the year, all categories outside of food were negative with particularly marked drops registered by computer, telecommunications & phone equipment (2.4 percent), video cassettes & CDs (2.1 percent), hardware household items (1.5 percent) and other products (1.9 percent). December retail sales edged up 0.1 percent but were down 0.6 percent when compared with December 2006. For calendar 2007, sales were up a meagre 0.5 percent with the bulk of the advance occurring during the first few months. The December increase was concentrated in the food sector which was up 0.1 percent. Non-food demand was unchanged on the month and down 1.1 percent on the year. On the year, all categories outside of food were negative with particularly marked drops registered by computer, telecommunications & phone equipment (2.4 percent), video cassettes & CDs (2.1 percent), hardware household items (1.5 percent) and other products (1.9 percent).
United Kingdom
 Fourth quarter gross domestic product was up 0.6 percent and 2.9 percent when compared with the same quarter a year ago. The fastest growing sector on the quarter was government final consumption (0.9 percent), easily outpacing subdued household spending (0.2 percent). Gross fixed capital formation contracted (0.5 percent). Total domestic expenditure rose 0.3 percent versus the fourth quarter or by 3.4 percent on the year. Despite a generally firm pound sterling over the period, net exports improved significantly, adding 0.2 percentage points to quarterly GDP growth. On the output side, the services sector was up 0.6 percent. The increase here continues to be dominated by transport & communication (1.9 percent) while distribution, hotels & catering hardly expanded at all (0.1 percent). Meantime the quarterly increase in goods output producing area edged up 0.1 percent while manufacturing production contracted by 0.1 percent from the third quarter. Fourth quarter gross domestic product was up 0.6 percent and 2.9 percent when compared with the same quarter a year ago. The fastest growing sector on the quarter was government final consumption (0.9 percent), easily outpacing subdued household spending (0.2 percent). Gross fixed capital formation contracted (0.5 percent). Total domestic expenditure rose 0.3 percent versus the fourth quarter or by 3.4 percent on the year. Despite a generally firm pound sterling over the period, net exports improved significantly, adding 0.2 percentage points to quarterly GDP growth. On the output side, the services sector was up 0.6 percent. The increase here continues to be dominated by transport & communication (1.9 percent) while distribution, hotels & catering hardly expanded at all (0.1 percent). Meantime the quarterly increase in goods output producing area edged up 0.1 percent while manufacturing production contracted by 0.1 percent from the third quarter.
Japan
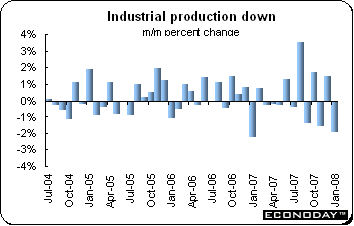 January industrial production dropped 2.0 percent and was up 2.5 percent when compared with the same month a year ago. Declines occurred in electronic parts and devices, transport equipment and general machinery. Commodities that mainly contributed to the decrease are large passenger cars, metal oxide semiconductor IC (Memory) and digital cameras. The slowdown in growth reflects both weak domestic growth and weaker U.S. demand. January industrial production dropped 2.0 percent and was up 2.5 percent when compared with the same month a year ago. Declines occurred in electronic parts and devices, transport equipment and general machinery. Commodities that mainly contributed to the decrease are large passenger cars, metal oxide semiconductor IC (Memory) and digital cameras. The slowdown in growth reflects both weak domestic growth and weaker U.S. demand.
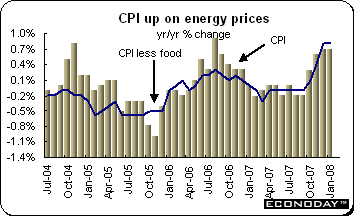 January consumer price index was down 0.2 percent but up 0.7 percent when compared with February 2007. As to be expected, the largest jump was in fuel, light & water charges which were up 0.8 percent on the month and 3.7 percent on the year. Food prices were up 0.6 percent and 0.5 percent on the year. Excluding fresh food only, the CPI was down 0.4 percent on the month and up 0.8 percent on the year. Excluding food and energy the CPI was down 0.6 percent on the month and 0.1 percent on the year. February Tokyo CPI was down 0.3 percent on the month and up 0.4 percent on the year. Excluding fresh food, the Tokyo CPI was down 0.2 percent and up 0.4 percent on the year. January consumer price index was down 0.2 percent but up 0.7 percent when compared with February 2007. As to be expected, the largest jump was in fuel, light & water charges which were up 0.8 percent on the month and 3.7 percent on the year. Food prices were up 0.6 percent and 0.5 percent on the year. Excluding fresh food only, the CPI was down 0.4 percent on the month and up 0.8 percent on the year. Excluding food and energy the CPI was down 0.6 percent on the month and 0.1 percent on the year. February Tokyo CPI was down 0.3 percent on the month and up 0.4 percent on the year. Excluding fresh food, the Tokyo CPI was down 0.2 percent and up 0.4 percent on the year.
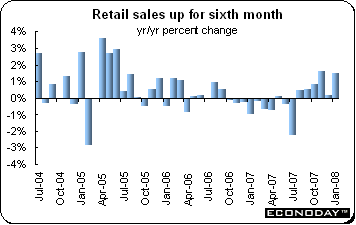 January retail sales were up 1.5 percent when compared with last year. However sales at large scale retail stores were down 1.9 percent on the year. Like household spending, these data are monitored as part of the watch on the frail domestic economy. January retail sales were up 1.5 percent when compared with last year. However sales at large scale retail stores were down 1.9 percent on the year. Like household spending, these data are monitored as part of the watch on the frail domestic economy.
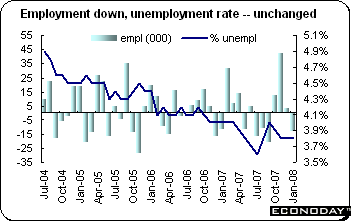 January unemployment rate was 3.8 percent for the third month. Employment declined 13,000 on the month but was up 25,000 when compared with the previous year. The number of unemployed edged up by 2,000. The ratio of job offers to job seekers, an indicator of demand for labor, stood at 0.98 in January. The ratio of new job offers to new job seekers increased to 1.49 from a revised 1.43 in December. The ratio in January shows that 98 jobs were being offered work for every 100 workers seeking employment. The new job offers ratio showed there were 149 new jobs for every 100 people newly seeking work. January unemployment rate was 3.8 percent for the third month. Employment declined 13,000 on the month but was up 25,000 when compared with the previous year. The number of unemployed edged up by 2,000. The ratio of job offers to job seekers, an indicator of demand for labor, stood at 0.98 in January. The ratio of new job offers to new job seekers increased to 1.49 from a revised 1.43 in December. The ratio in January shows that 98 jobs were being offered work for every 100 workers seeking employment. The new job offers ratio showed there were 149 new jobs for every 100 people newly seeking work.
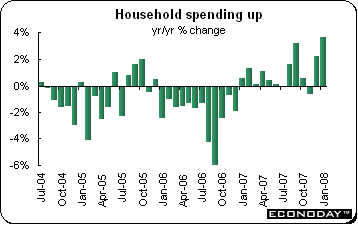 January household spending was up 3.6 percent when compared with last year while spending for workers household spending was up 3.0 percent on the year. Spending for household of two or more people were up for all categories with the exception of food which declined 2.9 percent on the year, furniture & household utensils which were down 1.1 percent and clothing & footware which sank by 5.6 percent. Among the categories where spending increased were transportation & communication which were up 11.2 percent, education which was up 13.6 percent and medical care which increased by 4.6 percent on the year. January household spending was up 3.6 percent when compared with last year while spending for workers household spending was up 3.0 percent on the year. Spending for household of two or more people were up for all categories with the exception of food which declined 2.9 percent on the year, furniture & household utensils which were down 1.1 percent and clothing & footware which sank by 5.6 percent. Among the categories where spending increased were transportation & communication which were up 11.2 percent, education which was up 13.6 percent and medical care which increased by 4.6 percent on the year.
Other Asian indicators
Singapore’s unadjusted consumer price index for January was up 1.3 percent and 6.6 percent when compared with a year ago. Food prices were 1.1 percent higher just before the Lunar New Year while housing costs soared by 4.1 percent.
Thailand’s gross domestic product was up by 5.7 percent in the fourth quarter when compared with the same quarter a year earlier after growing by 4.8 percent in the third. For the year 2007, GDP was up 4.8 percent.
Malaysia's gross domestic product was up 7.3 percent in the fourth quarter when compared with the same quarter a year ago. Services were the biggest contributor to growth, up 9.1 percent. Private consumption increased 11.1 percent while public consumption was up 4.4 percent. Domestic demand expanded 9.8 percent.
Canada
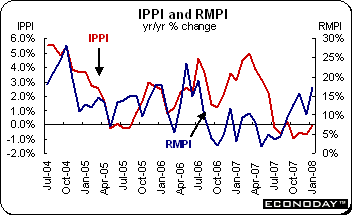 January industrial product price index was up 0.9 percent but was down 0.1 percent when compared with the same month a year ago. The largest gain at the start of the year was posted by primary metal products which jumped 3.5 percent following eight consecutive monthly declines. Other large increases were registered by petroleum & coal products (2.0 percent), fruit & vegetables (1.4 percent) and miscellaneous manufactures (1.3 percent). The exchange rate was less of an issue in the monthly performance this time round with the index adjusted for these effects showing a 0.6 percent increase over December. However, the importance of the appreciation of the Canadian dollar over the year is clearly demonstrated in the annual growth rates where the decline of 0.1 percent unadjusted turns into a 3.9 percent increase once exchange rate effects have been stripped out. Raw material costs jumped 3.4 percent and boosted annual growth in the RMPI to 17.3 percent, its fastest pace since July 2006. Leading the monthly charge were vegetable products (7.8 percent) and ferrous materials (5.9 percent) but there were also sizeable gains posted by mineral fuels (4.4 percent), non-ferrous metals (2.2 percent) and non-metallic minerals (2.5 percent). January industrial product price index was up 0.9 percent but was down 0.1 percent when compared with the same month a year ago. The largest gain at the start of the year was posted by primary metal products which jumped 3.5 percent following eight consecutive monthly declines. Other large increases were registered by petroleum & coal products (2.0 percent), fruit & vegetables (1.4 percent) and miscellaneous manufactures (1.3 percent). The exchange rate was less of an issue in the monthly performance this time round with the index adjusted for these effects showing a 0.6 percent increase over December. However, the importance of the appreciation of the Canadian dollar over the year is clearly demonstrated in the annual growth rates where the decline of 0.1 percent unadjusted turns into a 3.9 percent increase once exchange rate effects have been stripped out. Raw material costs jumped 3.4 percent and boosted annual growth in the RMPI to 17.3 percent, its fastest pace since July 2006. Leading the monthly charge were vegetable products (7.8 percent) and ferrous materials (5.9 percent) but there were also sizeable gains posted by mineral fuels (4.4 percent), non-ferrous metals (2.2 percent) and non-metallic minerals (2.5 percent).
While last week was dominated by Fedspeak, other central banks will be front and center this week. Five central banks will render a wide spectrum of rate decisions this week. The week begins Tuesday with the Bank of Canada and the Reserve Bank of Australia. On Thursday, the Bank of England, the European Central Bank and the Bank of Japan will make their decisions known. Of the five, only the Bank of Canada is expected to lower their key interest rate from 4 percent while the RBA is expected to increase its rate to 7.25 percent. The Bank of England, ECB and the BoJ are expected to leave their key rates unchanged at 5.25 percent, 4 percent and 0.5 percent respectively.
This will be Bank of Japan Governor Toshihiko Fukui and his two deputies’ last monetary policy board meeting — their terms expire on March 19. At this writing, no successors have been named. Rather the appointment is caught up in the increasing friction between the ruling and opposition parties. Both the ruling-coalition-controlled lower house and the opposition-controlled upper house must approve Fukui's successor.
The ECB’s inflation forecasts for the next two years are due to be released at Thursday’s meeting and they are widely expected to be revised upward. That would leave no room for a near term cut in interest rates.
| Central Bank activities |
|
| March 4 |
Canada |
Bank of Canada Interest Rate Announcement |
| March 4 |
Australia |
Reserve Bank of Australia Policy Announcement |
| March 5,6 |
UK |
Bank of England Monetary Policy Meeting, Announcement |
| March 6 |
EMU |
European Central Bank Announcement |
| March 6,7 |
Japan |
Bank of Japan Monetary Policy Announcement |
|
|
|
| Other events |
|
|
| March 9 |
United States |
Daylight Savings Time Begins |
|
|
|
| The following indicators will be released this week... |
| Europe |
|
|
| March 3 |
EMU |
Harmonized Index of Consumer Prices (February, flash) |
|
Italy |
Producer Price Index (January) |
| March 4 |
EMU |
Producer Price Index (January) |
|
|
Gross Domestic Product (Q4.07, preliminary) |
| March 5 |
EMU |
Retail Sales (January) |
| March 6 |
Germany |
Manufacturing Orders (January) |
| March 7 |
Germany |
Industrial Production (January) |
|
|
|
| Asia/Pacific |
|
|
| March 4 |
Australia |
Retail Sales (January) |
| March 5 |
Australia |
Gross Domestic Product (Q4.07) |
| March 6 |
Australia |
Merchandise Trade Balance (January) |
|
|
|
| Americas |
|
|
| March 3 |
Canada |
Monthly Gross Domstic Product (December) |
|
|
Gross Domestic Product (Q4.07) |
| March 7 |
Canada |
Employment, Unemployment (February) |
Anne D Picker is the author of International Economic Indicators and Central Banks.
|
