|
Investors continued to be on edge for a multitude of reasons. The spate of negative numbers regarding the U.S. economy (and those overseas) interspersed with the occasional positive number has more forecasters believing that the U.S. is on the cusp of a recession rather than a period of slow growth. (A recession is commonly defined as two quarters of negative GDP growth). Slow growth can be defined as below trend growth — and in the U.S. that means anything below an annualized rate of 2.7 percent and in the UK, under about 2.5 percent on the year. Investors were also edgy ahead of the Group of Seven financial meeting on Saturday (February 9) in Tokyo as market participants look for new approaches to stem global financial turmoil emanating from the U.S. subprime mortgage crisis. Investors are looking to avert risk and for a safe haven in which to invest. In times of economic uncertainty, it is normal that asset allocation flows shift out of the equity and credit markets and into government debt.
All indexes followed here with the exception of the Kospi and Shanghai composite were down on the week.
|
|
2007 |
2008 |
% Change |
|
Index |
Dec 31 |
Feb 1 |
Feb 8 |
Week |
Year |
| Asia |
|
|
|
|
|
|
| Australia |
All Ordinaries |
6421.0 |
5882.3 |
5723.9 |
-2.7% |
-10.9% |
| Japan |
Nikkei 225 |
15307.8 |
13497.2 |
13017.2 |
-3.6% |
-15.0% |
|
Topix |
1475.7 |
1336.9 |
1287.1 |
-3.7% |
-12.8% |
| Hong Kong |
Hang Seng |
27812.7 |
24123.6 |
23469.5 |
-2.7% |
-15.6% |
| S. Korea |
Kospi |
1897.1 |
1634.5 |
1696.6 |
3.8% |
-10.6% |
| Singapore |
STI |
3482.3 |
3007.8 |
2932.0 |
-2.5% |
-15.8% |
| Shanghai |
Shanghai Composite |
5261.56 |
4320.77 |
4599.7 |
6.5% |
-12.6% |
|
|
|
|
|
|
|
| Europe |
|
|
|
|
|
|
| UK |
FTSE 100 |
6456.9 |
6029.2 |
5784.0 |
-4.1% |
-10.4% |
| France |
CAC |
5614.1 |
4978.1 |
4709.7 |
-5.4% |
-16.1% |
| Germany |
XETRA DAX |
8067.3 |
6968.7 |
6767.3 |
-2.9% |
-16.1% |
|
|
|
|
|
|
|
| North America |
|
|
|
|
|
|
| United States |
Dow |
13264.8 |
12743.2 |
12182.1 |
-4.4% |
-8.2% |
|
NASDAQ |
2652.3 |
2413.4 |
2304.9 |
-4.5% |
-13.1% |
|
S&P 500 |
1468.4 |
1395.4 |
1331.3 |
-4.6% |
-9.3% |
| Canada |
S&P/TSX Comp. |
13833.1 |
13318.4 |
12989.3 |
-2.5% |
-6.1% |
| Mexico |
Bolsa |
29536.8 |
29429.9 |
28185.3 |
-4.2% |
-4.6% |
Mexican markets were closed on Monday February 4, 2008
Markets in China and South Korea were closed from Wednesday February 6 through Friday February 8, 2008
Markets in Hong Kong and Singapore were closed on Thursday February 7 and Friday February 8, 2008
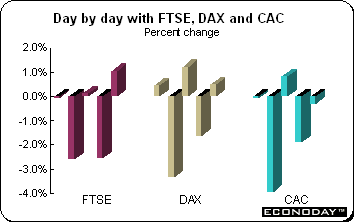
After ending the previous week on a sound positive note, the FTSE, CAC and DAX promptly lost all their gains and then some. Equities continued to be volatile and under heavy pressure as poor European earnings combined with new evidence of U.S. economic weakness frayed investors’ nerves. U.S. data, including the ISM nonmanufacturing index and pending existing home sales, sank more than consensus expectations. European markets also found little comfort in the European Central Bank and Bank of England interest rates decisions. The ECB kept interest rates on hold at 4 percent while the BoE cut by 25 basis points to 5.25 percent. Morning gains were many times undermined in afternoon trading by downward movements in U.S. stocks.
 On Thursday, equities reacted to the policy announcements by the ECB and BoE. The FTSE lost ground after the Bank of England delivered the expected cut in UK interest rates but cautioned on rising inflation. But with a few dealers hoping for a cut of 50 basis points, leading shares declined as the Bank warned of an upside risk for inflation in coming months. While the Bank obviously needed to take action to try and limit the growing downside risks to growth, its scope to cut interest rates aggressively is limited by significant inflationary pressures. In Europe, carmakers’ stocks were lower after the ECB’s decision to keep the main refinancing rate at 4 percent. On Thursday, equities reacted to the policy announcements by the ECB and BoE. The FTSE lost ground after the Bank of England delivered the expected cut in UK interest rates but cautioned on rising inflation. But with a few dealers hoping for a cut of 50 basis points, leading shares declined as the Bank warned of an upside risk for inflation in coming months. While the Bank obviously needed to take action to try and limit the growing downside risks to growth, its scope to cut interest rates aggressively is limited by significant inflationary pressures. In Europe, carmakers’ stocks were lower after the ECB’s decision to keep the main refinancing rate at 4 percent.
All three indexes were down last week. Like those in Asia, the FTSE, CAC and DAX have double digit declines in 2008 — 10.4 percent for the FTSE and 16.1 percent for both the CAC and DAX.
ECB keeps the status quo — at least for now
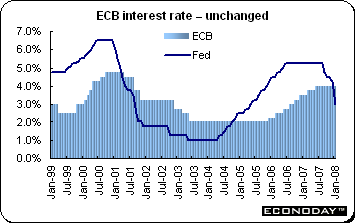 As universally expected, the European Central Bank governing council left its key interest rate at 4 percent for the ninth month. ECB president Jean Claude Trichet remains unswervingly committed to fighting inflation, in spite of expectations that eurozone growth will slow along with the rest of the global economy. This presents a dilemma for the bank. The flash estimate of the harmonized index of consumer prices showed that the annual rate of eurozone inflation climbed to 3.2 percent in January — the highest level since the data series started in 1997 and the fifth successive month that inflation has come in above the ECB’s 2 percent price stability target. A major concern is the risk of second-round inflation effects — particularly given that the eurozone unemployment rate held at a record low of 7.2 percent in December. Overall economic sentiment has dipped to its lowest for two years, while consumer confidence — affected by the recent turbulence in financial markets — fell to its worst level since November 2005. As universally expected, the European Central Bank governing council left its key interest rate at 4 percent for the ninth month. ECB president Jean Claude Trichet remains unswervingly committed to fighting inflation, in spite of expectations that eurozone growth will slow along with the rest of the global economy. This presents a dilemma for the bank. The flash estimate of the harmonized index of consumer prices showed that the annual rate of eurozone inflation climbed to 3.2 percent in January — the highest level since the data series started in 1997 and the fifth successive month that inflation has come in above the ECB’s 2 percent price stability target. A major concern is the risk of second-round inflation effects — particularly given that the eurozone unemployment rate held at a record low of 7.2 percent in December. Overall economic sentiment has dipped to its lowest for two years, while consumer confidence — affected by the recent turbulence in financial markets — fell to its worst level since November 2005.
The ECB’s stance contrasts sharply with the Federal Reserve’s aggressive interest rate cuts and the Bank of England’s more moderate approach. In his monthly press conference that followed the governing council meeting, Trichet acknowledged the gloomier economic outlook and softened his hard line stance on rate moves. He did nothing to correct financial market expectations for a 25 basis point cut in April or May. He gave no indication about the timing of any interest rate changes but softened considerably his tone compared with that he took after the January ECB meeting when he warned of a possible pre-emptive interest rate increase to head-off inflationary threats posed by wage deals. Trichet warned that a U.S.-style fiscal stimulus package is not warranted in the eurozone.
Bank of England lowers interest rates again
The Bank of England’s monetary policy committee lowered its key interest rate by 25 basis points to 5.25 percent. It last lowered its interest rate at its December 2007 meeting. Although now lower by 50 basis points, the Bank still has the highest interest rate among G7 countries. Initial fourth quarter growth estimates were still on the robust side, but recent data have indicated that the economy may be slowing faster than anticipated as a combination of past rate increases take hold and the global credit crunch and slowdown shows signs of impacting key sectors of the economy such as housing. The Bank has an inflation target of 2 percent.
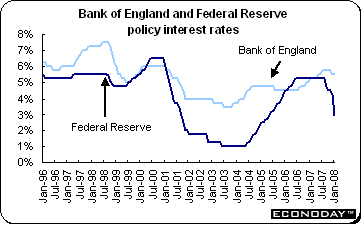 Both the foreign exchange and stock markets swooned because the Bank did not cut further, while sterling slumped suggesting that the rate cut had not been priced in. Many analysts were disappointed that the Bank was still concerned about risks of inflation remaining too high for comfort — but investors took the rate cut as a better signal of the Bank’s future moves than its more cautious words. The MPC gave no indication of future rate moves, pledging to “balance the risk that a sharp slowing in activity pulls inflation below the target in the medium term against the risk that elevated inflation expectations keep inflation above target”. In their statement they also noted that the prospects for output growth abroad had deteriorated and the disruptions in global financial markets continued. It noted that credit conditions for households and businesses were tightening while growth in consumer spending had eased. Both the foreign exchange and stock markets swooned because the Bank did not cut further, while sterling slumped suggesting that the rate cut had not been priced in. Many analysts were disappointed that the Bank was still concerned about risks of inflation remaining too high for comfort — but investors took the rate cut as a better signal of the Bank’s future moves than its more cautious words. The MPC gave no indication of future rate moves, pledging to “balance the risk that a sharp slowing in activity pulls inflation below the target in the medium term against the risk that elevated inflation expectations keep inflation above target”. In their statement they also noted that the prospects for output growth abroad had deteriorated and the disruptions in global financial markets continued. It noted that credit conditions for households and businesses were tightening while growth in consumer spending had eased.
Analysts noted that the Bank’s statement was less dovish than some had hoped and contained veiled warnings that inflation remains a concern. It noted that higher energy and food prices were likely to raise inflation in the future while a weaker pound would raise the price of imports. Analysts said that on balance, the Bank’s statement appeared to be a warning that further cuts were unlikely to come quickly.
Stocks continued to edge lower last week. Markets were closed in China, Hong Kong, Singapore and South Korea for most of the week. Despite the short week, both Shanghai and South Korea managed to post a gain while the remaining indexes were lower once again. All indexes followed here are down over 10.5 percent so far this year.
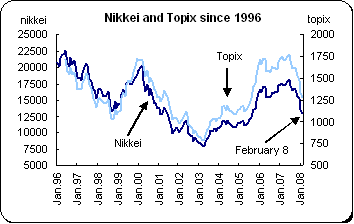 Japanese stocks were down three of five days last week. Poor economic data from both the U.S. and Japan were a drag on the market as were disappointing earnings. Earlier in the week, the shockingly weak U.S. ISM non-manufacturing survey sent U.S. stocks plummeting and world stocks following them down. On Friday, Japanese stocks needed no outside influence to end the week on a down note thanks to lackluster December machinery orders data and confusion over suspension of trading in the key March Topix futures contract. Stocks declined after core private-sector machinery orders were down a seasonally adjusted 3.2 percent. Machinery orders, which are a closely watched gauge of corporate capital spending, were down 4 percent in 2007 from the year before — the first decline in five years. The data suggest capital investment, which accounts for 15 percent of gross domestic product, may take a turn for the worse. Japanese stocks were down three of five days last week. Poor economic data from both the U.S. and Japan were a drag on the market as were disappointing earnings. Earlier in the week, the shockingly weak U.S. ISM non-manufacturing survey sent U.S. stocks plummeting and world stocks following them down. On Friday, Japanese stocks needed no outside influence to end the week on a down note thanks to lackluster December machinery orders data and confusion over suspension of trading in the key March Topix futures contract. Stocks declined after core private-sector machinery orders were down a seasonally adjusted 3.2 percent. Machinery orders, which are a closely watched gauge of corporate capital spending, were down 4 percent in 2007 from the year before — the first decline in five years. The data suggest capital investment, which accounts for 15 percent of gross domestic product, may take a turn for the worse.
Although open only two days last week, Chinese shares soared more than 8 percent Monday after optimistic statements by government officials eased concerns about an economic slowdown and the impact of recent severe winter weather. The Shanghai Composite index, which had been down 30 percent from the high it reached in October, rose 8.1 percent. Investors were cheered by the approval of two new equity investment funds and the lifting of some restrictions on bank credit. They were also buoyed by front-page statements from senior officials in several state-run newspapers that played down the potential economic impact of the snow storms that have hit parts of central and eastern China in recent weeks.
Reserve bank of Australia
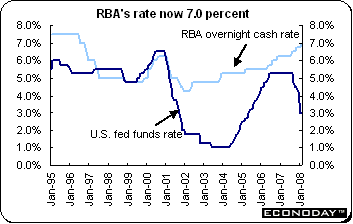 As expected, the Reserve Bank of Australia increased its cash rate target by 25 basis points to 7 percent, an 11 year high. The primary reason for the action was to dampen inflationary pressures and slow the robust economy that after 16 years of continuous expansion is starting to hit capacity constraints, notably for labor. Fear of a wage spiral remains just that, a fear. But with inflation trends remaining firm on the back of higher food and energy prices, the RBA will need to remain vigilant. The RBA has been under pressure to increase rates after core inflation breached the bank's 3 percent target for a second quarter, forcing the RBA to make its third rate increase in six months even after global equity markets have plunged. Underlying inflation accelerated to 3.8 percent in the fourth quarter from a year earlier. Analysts expect another rate increase in the second quarter. As expected, the Reserve Bank of Australia increased its cash rate target by 25 basis points to 7 percent, an 11 year high. The primary reason for the action was to dampen inflationary pressures and slow the robust economy that after 16 years of continuous expansion is starting to hit capacity constraints, notably for labor. Fear of a wage spiral remains just that, a fear. But with inflation trends remaining firm on the back of higher food and energy prices, the RBA will need to remain vigilant. The RBA has been under pressure to increase rates after core inflation breached the bank's 3 percent target for a second quarter, forcing the RBA to make its third rate increase in six months even after global equity markets have plunged. Underlying inflation accelerated to 3.8 percent in the fourth quarter from a year earlier. Analysts expect another rate increase in the second quarter.
Australia is the first developed economy to raise borrowing costs after Federal Reserve Chairman Ben S. Bernanke cut the fed funds target rate to 3 percent. This marks the bank's 11th increase since May 2002, which has lifted the rate from 4.25 percent. Central banks across Asia and Europe face challenges balancing the threat of a global economic slowdown against signs of quickening inflation as commodity prices soar. The gap between the Australian and U.S. benchmark rates widened to 4 percentage points, the largest in more than three years. That may drive demand for Australia's currency, which has climbed 17 percent against the U.S. dollar in the past year as investors flock to the nation's higher-yielding assets.
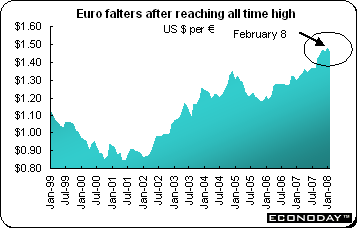 After flirting with a record high on Monday, the euro sank against the dollar after a survey suggested activity in the eurozone service sector slowed to 50.6, its weakest level since July 2003 and readings for Germany, Italy and Spain plunged below 50, indicating contraction. Only France bucked the trend of the big economies. Analysts said investors seem to have concluded that a lot of the bad news concerning the U.S. economy was already priced into the dollar. They also said that contagion in the eurozone from a U.S. downturn had not fully been recognized by the currency market. The figures fuelled speculation that the European Central Bank would have to abandon its hawkish stance on interest rates. And so it proved on Thursday when the ECB, as expected, kept interest rates on hold at 4 percent. Rather than warning of a preemptive strike on inflation, ECB president Trichet warned of the downside risks to growth posed by financial market turbulence and a slowdown in the eurozone’s major trading partners. The euro sold off sharply on the news, and analysts said they expected the trend to continue. After flirting with a record high on Monday, the euro sank against the dollar after a survey suggested activity in the eurozone service sector slowed to 50.6, its weakest level since July 2003 and readings for Germany, Italy and Spain plunged below 50, indicating contraction. Only France bucked the trend of the big economies. Analysts said investors seem to have concluded that a lot of the bad news concerning the U.S. economy was already priced into the dollar. They also said that contagion in the eurozone from a U.S. downturn had not fully been recognized by the currency market. The figures fuelled speculation that the European Central Bank would have to abandon its hawkish stance on interest rates. And so it proved on Thursday when the ECB, as expected, kept interest rates on hold at 4 percent. Rather than warning of a preemptive strike on inflation, ECB president Trichet warned of the downside risks to growth posed by financial market turbulence and a slowdown in the eurozone’s major trading partners. The euro sold off sharply on the news, and analysts said they expected the trend to continue.
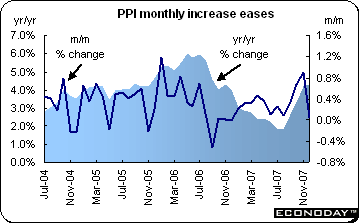 December producer prices excluding construction rose 0.1 percent after soaring 0.9 percent in November. The PPI was up 4.3 percent when compared with the same month a year ago. Core PPI was up 0.1 percent and a muted 3.1 percent on the year. Most sectors were quite subdued with monthly gains of only 0.1 percent registered in capital goods, durable consumer goods and energy. Intermediate goods fell 0.1 percent leaving non-durable goods as the sole area to post an above average gain of 0.4 percent. December producer prices excluding construction rose 0.1 percent after soaring 0.9 percent in November. The PPI was up 4.3 percent when compared with the same month a year ago. Core PPI was up 0.1 percent and a muted 3.1 percent on the year. Most sectors were quite subdued with monthly gains of only 0.1 percent registered in capital goods, durable consumer goods and energy. Intermediate goods fell 0.1 percent leaving non-durable goods as the sole area to post an above average gain of 0.4 percent.
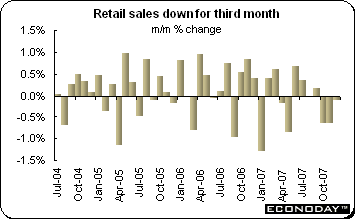 December retail sales contracted for the third month in a row. Sales declined 0.1 percent and were down 2.0 percent when compared with the same month a year ago. Food, drinks & tobacco sales were unchanged on the month and down 2 percent on the year. Nonfood sales edged down 0.1 percent and dropped 1.9 percent on the year. Among member states, retail sales in Spain were down 1 percent on the month while Germany edged down 0.1 percent but France was up 0.9 percent. December retail sales contracted for the third month in a row. Sales declined 0.1 percent and were down 2.0 percent when compared with the same month a year ago. Food, drinks & tobacco sales were unchanged on the month and down 2 percent on the year. Nonfood sales edged down 0.1 percent and dropped 1.9 percent on the year. Among member states, retail sales in Spain were down 1 percent on the month while Germany edged down 0.1 percent but France was up 0.9 percent.
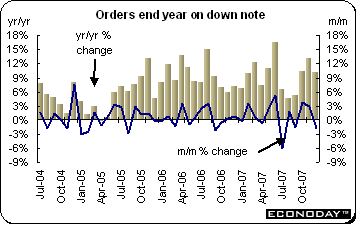 December manufacturers’ orders were down 1.7 percent but up 10.2 percent when compared with December 2006. Domestic orders were down 0.5 percent but were up 7.3 percent on the year while overseas orders dropped 2.8 percent but were up 13.2 percent on the year. All of the major sectors posted monthly declines with the previously booming capital goods area suffering the worst (2.7 percent). Declines elsewhere were led by consumer and durable goods (0.7 percent) with basics, which have typically risen rather more slowly during the upswing, falling the least (0.5 percent). December manufacturers’ orders were down 1.7 percent but up 10.2 percent when compared with December 2006. Domestic orders were down 0.5 percent but were up 7.3 percent on the year while overseas orders dropped 2.8 percent but were up 13.2 percent on the year. All of the major sectors posted monthly declines with the previously booming capital goods area suffering the worst (2.7 percent). Declines elsewhere were led by consumer and durable goods (0.7 percent) with basics, which have typically risen rather more slowly during the upswing, falling the least (0.5 percent).
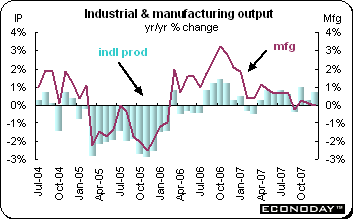
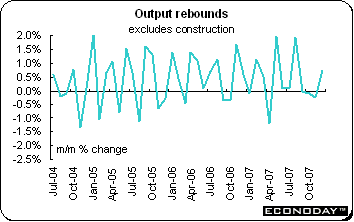 December industrial production was up 0.8 percent and 4.9 percent when compared with the same month a year ago. The monthly increase was the largest since August (1.9 percent) and reflected solid gains in most sectors. Manufacturing was up 0.9 percent with intermediates (3.2 percent) and consumer goods (2.3 percent) even more robust, the latter enjoying sizeable increases in both durables (3.5 percent) and non-durables (2.1 percent). Production of capital goods fell 2.0 percent but with orders in the sector still especially firm, a recovery should be seen very soon. Energy was off 1.3 percent but construction was up 0.9 percent. December industrial production was up 0.8 percent and 4.9 percent when compared with the same month a year ago. The monthly increase was the largest since August (1.9 percent) and reflected solid gains in most sectors. Manufacturing was up 0.9 percent with intermediates (3.2 percent) and consumer goods (2.3 percent) even more robust, the latter enjoying sizeable increases in both durables (3.5 percent) and non-durables (2.1 percent). Production of capital goods fell 2.0 percent but with orders in the sector still especially firm, a recovery should be seen very soon. Energy was off 1.3 percent but construction was up 0.9 percent.
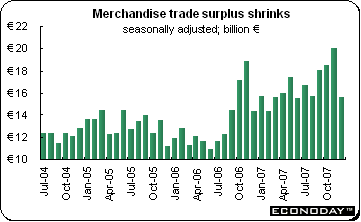 December merchandise trade surplus declined to €15.7 billion, the lowest reading since February 2007. For the calendar year as a whole, a surplus of €199.4 billion was up more than 25 percent on the previous year. For 2007, total exports climbed 8.5 percent with non-EU nations up 4.1 percent while total imports were up 5.0 percent with non-EU countries down 1.0 percent. In December alone, imports were up strongly with a 5.3 percent nominal monthly gain that more than offset a 3.0 percent drop in November. Exports, on the other hand, fell 1.2 percent, a disappointing second consecutive decline following the 0.5 percent dip in mid-quarter. December merchandise trade surplus declined to €15.7 billion, the lowest reading since February 2007. For the calendar year as a whole, a surplus of €199.4 billion was up more than 25 percent on the previous year. For 2007, total exports climbed 8.5 percent with non-EU nations up 4.1 percent while total imports were up 5.0 percent with non-EU countries down 1.0 percent. In December alone, imports were up strongly with a 5.3 percent nominal monthly gain that more than offset a 3.0 percent drop in November. Exports, on the other hand, fell 1.2 percent, a disappointing second consecutive decline following the 0.5 percent dip in mid-quarter.
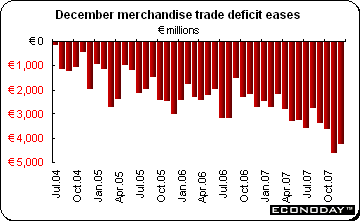 December merchandise trade deficit was €4.3 billion, a slight improvement from the revised November gap of €4.6 billion. Exports dropped 0.3 percent while imports were down by 1.2 percent. The red ink for the year as a whole still widened out to a record €39.2 billion, up nearly 39 percent from 2006. With growth in imports (5.4 percent) over the January-December period nearly twice that of exports (3.0 percent) the deterioration in the overall international trade position will ensure that local politicians continue to make noises about the excessive strength of the euro. Trade was in broad balance with the U.S. but in sizeable deficit with the then other 12 EMU members (€1.6 billion) and Asia (€1.8 billion). December merchandise trade deficit was €4.3 billion, a slight improvement from the revised November gap of €4.6 billion. Exports dropped 0.3 percent while imports were down by 1.2 percent. The red ink for the year as a whole still widened out to a record €39.2 billion, up nearly 39 percent from 2006. With growth in imports (5.4 percent) over the January-December period nearly twice that of exports (3.0 percent) the deterioration in the overall international trade position will ensure that local politicians continue to make noises about the excessive strength of the euro. Trade was in broad balance with the U.S. but in sizeable deficit with the then other 12 EMU members (€1.6 billion) and Asia (€1.8 billion).
 December industrial production edged down 0.1 percent and was up 0.6 percent when compared with last year. Manufacturing output was down 0.2 percent and was unchanged on the year. Within manufacturing, there were sizeable monthly declines in coke and petrol output (1.0 percent), metals (0.8 percent), textiles & clothing (1.2 percent) and other (1.0 percent). Food & drink declined rather more modestly (0.3 percent). The only gainers among the major categories were chemicals & fibres (0.6 percent) and engineering (0.6 percent), the latter being one of only two sub-sectors still showing positive annual growth (1.4 percent). Within industrial production, output was up for electricity, gas & water (1.7 percent) and oil & gas extraction (1.2 percent). December industrial production edged down 0.1 percent and was up 0.6 percent when compared with last year. Manufacturing output was down 0.2 percent and was unchanged on the year. Within manufacturing, there were sizeable monthly declines in coke and petrol output (1.0 percent), metals (0.8 percent), textiles & clothing (1.2 percent) and other (1.0 percent). Food & drink declined rather more modestly (0.3 percent). The only gainers among the major categories were chemicals & fibres (0.6 percent) and engineering (0.6 percent), the latter being one of only two sub-sectors still showing positive annual growth (1.4 percent). Within industrial production, output was up for electricity, gas & water (1.7 percent) and oil & gas extraction (1.2 percent).
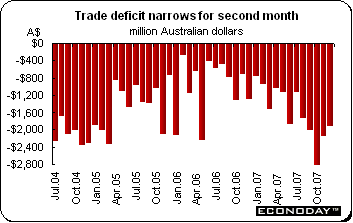 December goods and services trade deficit improved to A$1.936 million from A$2.162 million in November. Exports were up 1.3 percent while imports edged up 0.1 percent. Exports were up 4.3 percent when compared with December 2006 while imports jumped by 7.4 percent. Exports for rural goods were up 9 percent while non-rural and other goods exports barely edged upward. Services exports were up 1 percent. On the import side, capital goods imports were up 3 percent and consumption goods were up 1 percent. However intermediate and other goods imports were down 3 percent while services imports were up 2 percent. December goods and services trade deficit improved to A$1.936 million from A$2.162 million in November. Exports were up 1.3 percent while imports edged up 0.1 percent. Exports were up 4.3 percent when compared with December 2006 while imports jumped by 7.4 percent. Exports for rural goods were up 9 percent while non-rural and other goods exports barely edged upward. Services exports were up 1 percent. On the import side, capital goods imports were up 3 percent and consumption goods were up 1 percent. However intermediate and other goods imports were down 3 percent while services imports were up 2 percent.
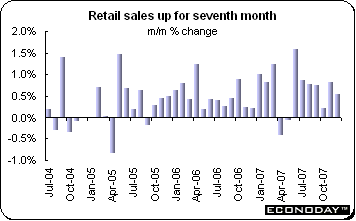 December retail sales were up 0.5 percent and 8.4 percent when compared with last year. This was slightly lower than the 0.9 percent monthly gain expected by analysts. Sales in November were up by 0.8 percent. Sales of household goods jumped 1.8 percent after climbing 0.9 percent in November. Recreational goods were up 1.4 percent almost offsetting the 1.6 percent decline in November. Food retailing was up for the second month, increasing by 0.7 percent in December after a 0.5 percent rise in November. Hospitality & services edged up 0.4 percent after jumping by 1.9 percent in November. Clothing & soft goods declined 0.9 percent after increasing by 0.8 percent in the preceding month. Continued interest rate increases have done little to dampen consumer spending thus far. December retail sales were up 0.5 percent and 8.4 percent when compared with last year. This was slightly lower than the 0.9 percent monthly gain expected by analysts. Sales in November were up by 0.8 percent. Sales of household goods jumped 1.8 percent after climbing 0.9 percent in November. Recreational goods were up 1.4 percent almost offsetting the 1.6 percent decline in November. Food retailing was up for the second month, increasing by 0.7 percent in December after a 0.5 percent rise in November. Hospitality & services edged up 0.4 percent after jumping by 1.9 percent in November. Clothing & soft goods declined 0.9 percent after increasing by 0.8 percent in the preceding month. Continued interest rate increases have done little to dampen consumer spending thus far.
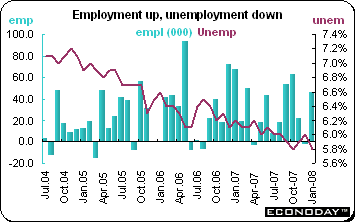 January employment jumped by 46,400 jobs while the unemployment rate dropped to 5.8 percent (matching the 33 year low seen in October 2007) from 6 percent in the previous month. There was no change in the participation rate (67.7 percent) but the employment rate climbed 0.1 percent to 63.8 percent, a new all time high. The latest gains in payrolls reflected broad based advances across a number of industries and, moreover, were concentrated in full-time jobs which climbed 64,300. Part time employment fell 17,900. In addition, the increase in payrolls was fully accounted for by the private sector where jobs jumped an impressive 72,800. This was in marked contrast to much of 2007 where the public and self-employment sectors dominated. Also unusually, employment growth was driven by the goods producing area which gained some 44,100 jobs compared with the meager 2,300 new posts added in services. Within the goods producing sector, manufacturing gained 17,500, construction was up by 19,500 and agriculture was up 14,200. Utilities rose more modestly with a 5,700 gain while the only decline occurred in natural resources (12,900). Services were underpinned by professional, scientific & technical services (30,200) but growth here was undermined by drops in trade (26,500), information, culture & recreation (27,600) and accommodation & food (10,900). January employment jumped by 46,400 jobs while the unemployment rate dropped to 5.8 percent (matching the 33 year low seen in October 2007) from 6 percent in the previous month. There was no change in the participation rate (67.7 percent) but the employment rate climbed 0.1 percent to 63.8 percent, a new all time high. The latest gains in payrolls reflected broad based advances across a number of industries and, moreover, were concentrated in full-time jobs which climbed 64,300. Part time employment fell 17,900. In addition, the increase in payrolls was fully accounted for by the private sector where jobs jumped an impressive 72,800. This was in marked contrast to much of 2007 where the public and self-employment sectors dominated. Also unusually, employment growth was driven by the goods producing area which gained some 44,100 jobs compared with the meager 2,300 new posts added in services. Within the goods producing sector, manufacturing gained 17,500, construction was up by 19,500 and agriculture was up 14,200. Utilities rose more modestly with a 5,700 gain while the only decline occurred in natural resources (12,900). Services were underpinned by professional, scientific & technical services (30,200) but growth here was undermined by drops in trade (26,500), information, culture & recreation (27,600) and accommodation & food (10,900).
Once again, spasms of fear regarding the possibility of a U.S. recession have led investors to sell equities. Economic data have truly been moving markets. And this was especially true last week, when the ISM nonmanufacturing index and the PMI services indexes in Europe sank from previous levels. Credit fears have combined with those of economic origin to send investors fleeing for the nearest safe haven — government bonds.
The Reserve Bank of Australia, Bank of England and the European Central Bank all did the expected. The RBA increased their key rate to 7 percent while the Bank of England lowered its key rate to 5.25 percent and the ECB kept its key rate at 4 percent.
This week, European investors will see growth estimates for the fourth quarter for the first time when the EMU and many of its members release their flash estimates of GDP. First estimates for the UK and the U.S. were released last month. Perhaps the data will allay some of investors’ worst fears.
| Central Bank activities |
|
| February 13 |
UK |
Bank of England Inflation Report |
| February 15 |
Japan |
Bank of Japan Policy Meeting and Announcement |
| The following indicators will be released this week... |
| Europe |
|
|
| February 11 |
France |
Industrial Production (December) |
|
Italy |
Industrial Production (December) |
|
UK |
Producer Input and Output Prices (January) |
|
|
Merchandise Trade Balance (December) |
| February 12 |
Germany |
ZEW Business Survey (February) |
|
UK |
Consumer Price Index (January) |
| February 13 |
EMU |
Industrial Production (December) |
|
UK |
Labor Market Report (January) |
| February 14 |
EMU |
Gross Domestic Product (Q4.07 flash) |
|
Germany |
Gross Domestic Product (Q4.07 flash) |
|
France |
Gross Domestic Product (Q4.07 flash) |
| February 15 |
EMU |
Merchandise Trade Balance (December) |
| Asia/Pacific |
|
|
| February 13 |
Japan |
Corporate Goods Price Index (January) |
| February 14 |
Japan |
Gross Domestic Product (Q4.07 preliminary) |
|
Australia |
Employment, Unemployment (January) |
| Americas |
|
|
| February 14 |
Canada |
Merchandise Trade Balance (December) |
| February 15 |
Canada |
Manufacturers Shipments (December) |
Anne D Picker is the author of International Economic Indicators and Central Banks.
|
