
 Risk concerns rattle investors
By Anne D. Picker, Chief Economist, Econoday
Friday, November 16, 2007

International Perspective will be taking off next week to celebrate
Thanksgiving. IP will return on November 30, 2007.
Happy holiday from all of us at Econoday!
Equity trading patterns continued to reflect investor attitudes towards risk aversion. These attitudes were tested by persistent credit concerns despite some encouraging news on leading investment bank write downs. Investors are no longer optimistic that the current credit uncertainties will settle down soon. Recent mixed economic data about the Japanese, European and American economies has fed into investor unease as well. In September investors were inclined to regard bad economic news as good news, reasoning that it would prompt central banks to cut interest rates. But the continued strength of oil and food prices is keeping inflation higher than desired in many countries. This is turn is making it more difficult for monetary policy to be accommodative — especially in countries with inflation targeting. A major focus globally is on the U.S. economy and the ripple effects a slowdown there would have on European and Asian economies. Asia/Pacific equity indexes along with those in the UK, Europe and Canada were down on the week. U.S. markets however, were positive. The Nikkei, Topix and CAC are below their December 31, 2006 levels.
|
|
2006 |
2007 |
% Change |
|
Index |
Dec 29 |
Nov 9 |
Nov 16 |
Week |
Year |
| Asia |
|
|
|
|
|
|
| Australia |
All Ordinaries |
5644.3 |
6607.4 |
6526.1 |
-1.23% |
15.62% |
| Japan |
Nikkei 225 |
17225.8 |
15583.4 |
15154.6 |
-2.75% |
-12.02% |
|
Topix |
1681.1 |
1494.4 |
1471.7 |
-1.52% |
-12.46% |
| Hong Kong |
Hang Seng |
19964.7 |
28783.4 |
27614.4 |
-4.06% |
38.32% |
| S. Korea |
Kospi |
1434.5 |
1990.5 |
1926.2 |
-3.23% |
34.28% |
| Singapore |
STI |
2985.8 |
3599.7 |
3441.0 |
-4.41% |
15.24% |
| Europe |
|
|
|
|
|
|
| UK |
FTSE 100 |
6220.8 |
6304.9 |
6291.2 |
-0.22% |
1.13% |
| France |
CAC |
5541.8 |
5524.2 |
5523.6 |
-0.01% |
-0.33% |
| Germany |
XETRA DAX |
6596.9 |
7812.4 |
7612.3 |
-2.56% |
15.39% |
| North America |
|
|
|
|
|
|
| United States |
Dow |
12463.2 |
13042.7 |
13176.8 |
1.03% |
5.73% |
|
NASDAQ |
2415.3 |
2627.9 |
2637.2 |
0.35% |
9.19% |
|
S&P 500 |
1418.3 |
1453.7 |
1458.7 |
0.35% |
2.85% |
| Canada |
S&P/TSX Comp. |
12908.4 |
13869.8 |
13530.4 |
-2.45% |
4.82% |
| Mexico |
Bolsa |
26448.3 |
29158.9 |
29631.6 |
1.62% |
12.04% |
The FTSE, CAC and DAX ended lower for the third week as subprime issues continued to weigh on investors. The DAX, the hardest hit of the trio, lost 2.6 percent. The FTSE saw gains from the first three days of the week disappear on Thursday and Friday as angst reemerged on the part of investors as they awaited closure on Northern Rock (Friday was the last day for bidders to file their rescue proposals) and along with more bad news from the banking sector on losses accrued from the subprime debacle. While Wednesday’s quarterly Inflation Report from the Bank of England initially encouraged investors with the prospect of lower interest rates, the gloomier growth prospects did not help going forward.
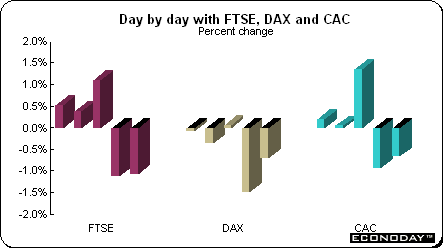
European stocks declined paced by banks, carmakers and technology companies. Investors here also voiced their concerns on credit market losses and its potential negative impact on growth by selling equities.
Bank of England Inflation Report gloomy
In its quarterly Inflation Report, the Bank of England said that it expects a marked slowdown in growth even with two potential interest rate cuts — but said that there is little chance of recession next year. Tighter credit conditions are likely to put pressure on consumption growth as households increase their net saving, while declining commercial property prices are likely to weigh on real estate development.
Bank watchers said that the report opened the door to rate cuts simply because its economic forecasts were so pessimistic. The monetary policy committee believes growth will slow sharply as a result of tighter credit conditions for households and companies. This will hit consumption as households decide to save more and will reduce the growth of business investment and take its toll on the construction industry, especially if property prices fall. The committee was also concerned about the global outlook. The MPC expects a U.S. slowdown to be balanced by rapid growth in Asia and continued high commodity prices. The report says it will focus on whether the U.S. housing slowdown is spreading and whether Asia appears to remain robust. Any signs that emerging economies are vulnerable to slowing U.S. import demand are likely to be crucial here for cutting rates faster. A potential drawback of lower interest rates is that the projected rise in inflation over the coming months could become embedded in higher household and company expectations of price increases.
Asian/Pacific equities continued to follow trading patterns in the U.S. Stocks in Australia, Japan and Hong Kong were down for the second week while stocks in South Korea and Singapore declined for a third week. Investors here as elsewhere are concerned that losses related to defaulting U.S. home loans will cut demand for exports. In Japan, stocks from construction machinery makers and banks to toy and auto manufacturers were hit when Bank of Japan Deputy Governor Toshiro Muto said growth could be threatened if the U.S. housing slump spreads. Stocks in Hong Kong were hit hard by investor concerns that the People’s Bank of China will increase interest rates for a sixth time this year after growth in factory and property spending accelerated. The STI, down 4.4 percent, was last week’s big loser in this region, followed by the Hang Seng. The Hang Seng fluctuated day-to-day in a rather spectacular way — it lost over 1,100 points on both Monday and Friday but gained over 1,300 points on Wednesday ending the week with a net loss of 4.1 percent.
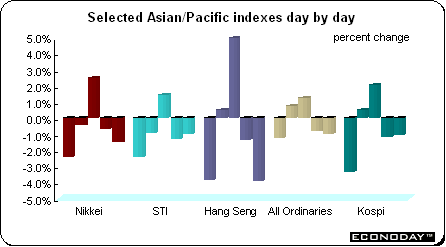
The Nikkei continued to decline thanks in part to the yen's rapid rise relative to other major currencies and weakness in other Asian equities. On Friday, the index was just above the 15,000 threshold at one point due to anxieties stemming from overseas stock market declines and foreign exchange market fluctuations. In addition to weak U.S. equities, lackluster Asian equities elsewhere combined with the yen's rise into the 109 zone during the day dampened investor sentiment. The yen's rise especially pulled export-oriented auto and high-tech issues down, while lingering fears of further fallout from the U.S. subprime mortgage market crisis weighed on financial issues.
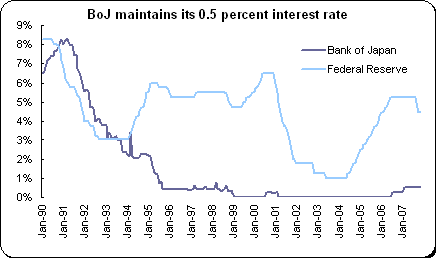
Bank of Japan — still waiting
As expected, the Bank of Japan left its key interest rate at 0.5 percent amid concern that the economy will slow. A combination of slower growth in the U.S. which will have a negative impact on exporters, higher energy prices and the turmoil in the financial markets all played a part in the decision. The rate has been unchanged since February of this year. Among the major economies, Japan has experienced the least impact from escalating oil prices on retail prices thus far. But if oil prices hold near their current levels, inflation is expected to climb from just below zero where it is now into positive territory. While the Bank still promises a rate increase in the normalization process, the economy has not been strong enough to allow them to do so. The Bank of Japan has reduced its growth forecast for the fiscal year ending March 31, 2008 to 1.8 percent from 2.1 percent in part because of the drop in construction.
During last week the yen, staged a broad rally and hit an 18-month high to the dollar as weaker equities provoked an unwinding of carry trades in which low-yielding currencies are sold to fund purchases of higher-yielding assets. But as Friday drew to a close, yen strength ebbed and the currency was virtually unchanged on the week. The dollar was firmer against the euro and pound sterling as investors were reluctant to sell the U.S. currency given the uncertainty over the credit market. Sterling was also a casualty as UK economic data and the Bank of England's quarterly Inflation Report cemented expectations for lower interest rates in coming months.
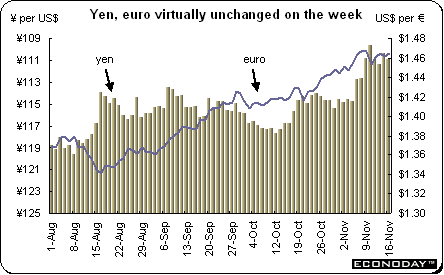
The Japanese government has never been shy about managing the yen’s value. Last week, Japan’s Prime Minister Yasuo Fukuda said the yen was appreciating too fast and warned traders and investors not to make speculative moves on the currency. He also said traders and investors should take care to avoid intervention from the Japanese government. The yen retreated after the prime minister’s statement. The yen had rallied strongly as rising risk aversion saw investors unwind carry trades, in which low-yielding currencies such as the yen are sold to finance the purchase of riskier, higher-yielding assets elsewhere.
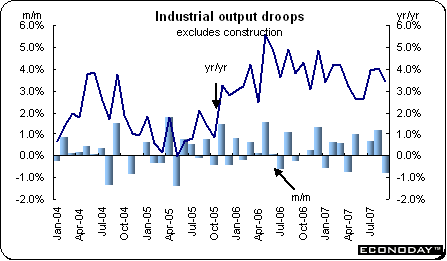
EMU — September industrial output dropped 0.7 percent but was up 3.5 percent when compared with last year. Most major production categories were down with consumer durables (down 3.4 percent) performing the worst followed by intermediates (down 1.3 percent). Consumer non-durables were not far behind (down 1.2 percent) and capital goods little better (down 1.0 percent). The sole area to register an increase was energy (up 0.6 percent). Among the countries reporting, the only gains of any note were in the Netherlands (2.8 percent), Portugal (0.9 percent) and Finland (0.8 percent). Outside of Germany (0.2 percent), the big four states all posted declines with France (1.1 percent) and Italy (1.0 percent) especially weak.
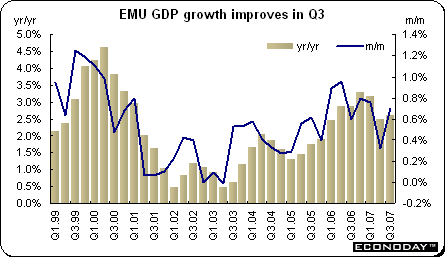
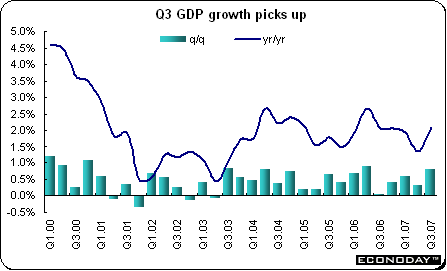
Third quarter flash gross domestic product was up 0.7 percent and 2.6 percent when compared with the same quarter a year ago. As with all flash releases, no detail was available. However, based on national data, private consumption continued to be the engine of growth. On a country-by-country basis, the Netherlands (up 1.8 percent on the quarter) recorded the fastest growth of those nations that have reported followed by Austria (up 0.8 percent). Germany, France and Spain were up 0.7 percent while Italy and Belgium were up 0.4 percent.
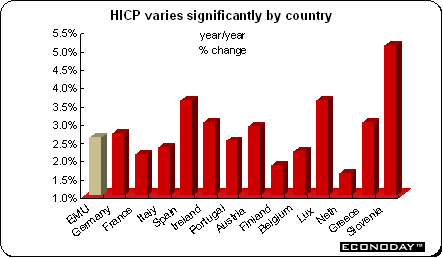
October harmonized index of consumer prices jumped 0.5 percent and was up 2.6 percent when compared with the same month a year ago. The annual rate is the highest since September 2005 and is above the ECB’s 2 percent inflation ceiling. Core HICP which excludes food, alcohol, tobacco and energy, edged up 0.3 percent and was up 1.8 percent on the year. Food prices were up 1.2 percent and 3.8 percent on the year while energy climbed 0.6 percent and 5.5 percent on the year. The other major categories posted below average gains or outright declines.
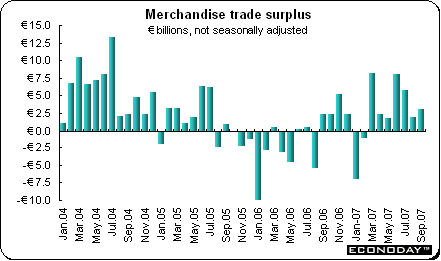
September seasonally adjusted merchandise trade surplus was €3.95 billion, down somewhat from an upwardly revised €4.5 billion in the previous month. Exports slipped 0.4 percent on the month in contrast to upward creep of 0.1 percent in imports but over the year, still remain dominant at 4.0 percent and 3.0 percent respectively. The broad figures mask very different underlying trends as the various EMU countries face the sharp euro appreciation with varying degrees of success. Therefore, positive annual export growth in Germany (1.6 percent) contrasts with declines in France (1.3 percent) and Italy (1.0 percent). Individual trade balances tell a similar story with Germany comfortably in the black but France almost flat and Italy in deficit. On an unadjusted basis, the trade surplus was €3.1 billion, up from the previous month’s €1.9 billion reading.
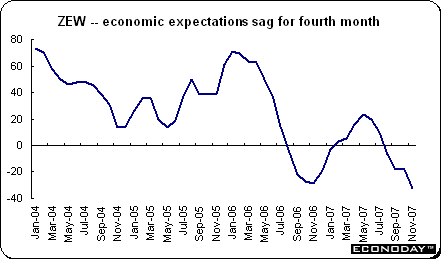
Germany — October ZEW economic expectations sank from minus 18.1 to minus 32.5. The good news was that current economic sentiment essentially remained flat (70.0 after 70.2). Credit concerns, an expected marked slowdown in the U.S. economy and worries about further rises in oil prices have combined with ongoing gains by the euro to undermine confidence in the future. The expectations index is now below the levels seen shortly before the hike in VAT at the start of the year and the subsequent collapse in consumer spending. The nature of the ZEW survey makes it particularly susceptible to shifts in financial market sentiment. Nonetheless, both the current and expectations components have been trending south for several months now.
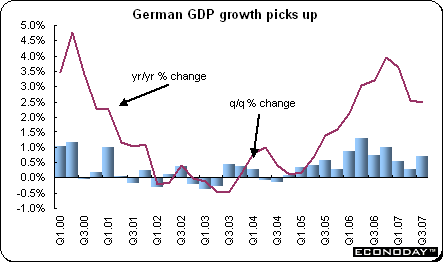
Third quarter flash gross domestic product was up an estimated 0.7 percent and 2.5 percent when compared with the same quarter a year ago. Being the flash report, there are few details available on the component breakdown but it is probable that domestic demand had driven the expansion with investment in both construction and equipment notably firm.
France — Third quarter flash gross domestic product was up 0.7 percent and 2.1 percent when compared with the same quarter a year ago. The quarterly gain was led by domestic demand which was up 0.6 percent. Gross fixed capital formation was up 0.4 percent with business increasing by 0.5 percent and households by 0.4 percent on the quarter.
Italy — Third quarter flash gross domestic product was up 0.4 percent and 1.9 percent when compared with the same quarter last year. As ever with the flash estimates, few details are made available but ISTAT confirmed that both industry and services helped to push the economy forward in the third quarter while agriculture contracted.
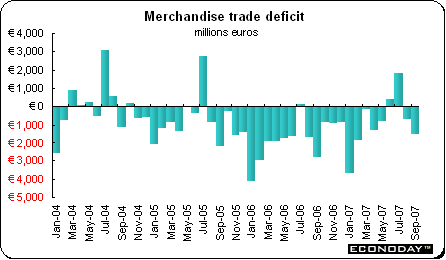
September merchandise trade deficit swelled to €1.5 billion from €687 million in August. Exports were up 0.2 percent while imports dropped 1.3 percent. When compared with last year, exports were up 4.3 percent while imports declined 0.2 percent.
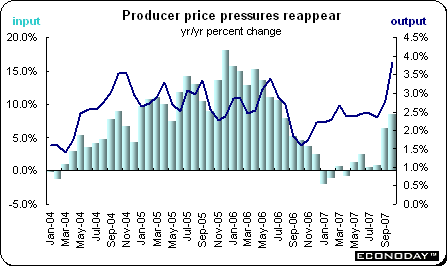
United Kingdom — October producer output prices were up 0.6 percent and 3.8 percent when compared with last year. Core output prices which exclude food, drink, tobacco and energy were up 0.3 percent on the month and 2.3 percent on the year. Gasoline prices soared 2.4 percent thanks to an increase in fuel duties. Food product prices were up 1.4 percent on the month, mainly due to a 5.8 percent jump in dairy prices and 2.4 percent advance in the cost of fresh bread. Producer input prices were up 1.8 percent and 8.6 percent on the year. The biggest factor in the monthly advance was energy prices as crude oil jumped 6.7 percent. Core input prices were up 3.0 percent on the year.
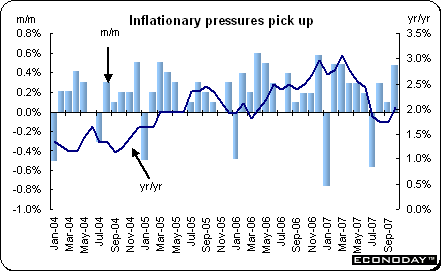
October consumer price index jumped 0.5 percent and was up 2.1 percent when compared with the same month a year ago. However core CPI which excludes food, drink, tobacco and energy was up 0.3 percent and 1.5 percent on the year. The climb back above target in the overall CPI was, once again, driven by higher charges for gasoline and food. Food and non-alcoholic beverages prices jumped 1.5 percent and 4.7 percent on the year while gasoline prices jumped 2.7 percent. Among the other major sectors, transport prices jumped another 0.9 percent on the month but there were notable drops in furniture and household equipment (1.2 percent) and communication (0.4 percent).
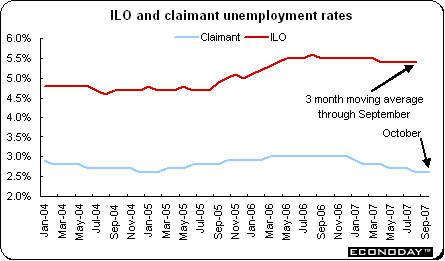
October claimant count unemployment declined by 9,900 and the claimant unemployment rate remained at 2.6 percent. The ILO measure of joblessness for the three months ending in September was up by 6,000, but left the unemployment rate unchanged at 5.4 percent. The increase in the number of unemployed compares with a 45,000 drop in the previous quarter and, in contrast to the claimant count data, ILO employment was up by 69,000.
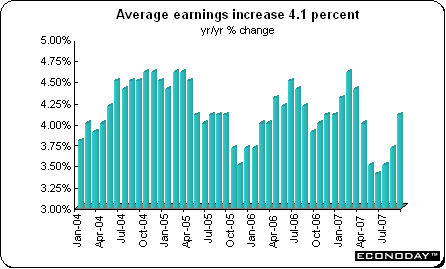
Average earnings for the three months ending in September was up 3.7 percent when compared with the same three months last year. For the month of September, earnings were up 4.1 percent on the year. The pick-up was in large part a function of the timing of bonus payments in the summer which artificially depressed the headline rate in recent months. Excluding bonuses, earnings growth held steady at 3.7 percent. Most of the pick-up stemmed from developments in the private service sector where the headline pay growth rate jumped to 4.7 percent from 4.1 percent. In manufacturing earnings were up 3.0 percent and were up 3.0 percent in the public sector.
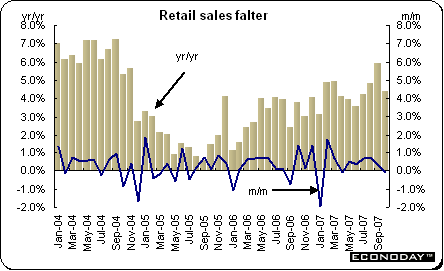
October retail sales edged down 0.1 percent and were up 4.4 percent when compared with last year. This followed a weaker revised September which now shows a 0.3 percent gain rather than the originally estimated gain of 0.6 percent. All major categories with the exception of non-store retailing and repair were down on the month. Overall non-food purchases dipped 0.1 percent led by a 0.5 percent drop in clothing & footwear. Household goods were flat while other stores eased 0.2 percent. Food sales were down 0.4 percent. The volatile nature of the monthly data means that October alone should be treated carefully but the deceleration in household spending shown here is consistent with a suite of other indicators all telling the same story.
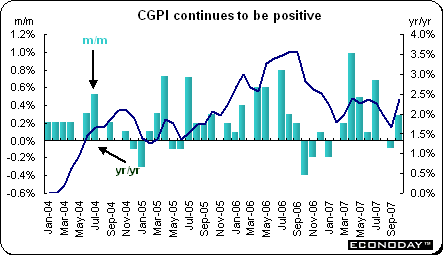
Japan — October corporate goods price index was up 0.3 percent and 2.4 percent when compared with last year. Petroleum & fuel products prices were up 3.8 percent on the month and 11.1 percent on the year. Most price categories were up on the year with the exception of electrical machinery, lumber & wood and precision instruments. While for the most part the CGPI has recorded price increases, they have yet to filter through to consumer prices were the CPI continues to be at or below zero.
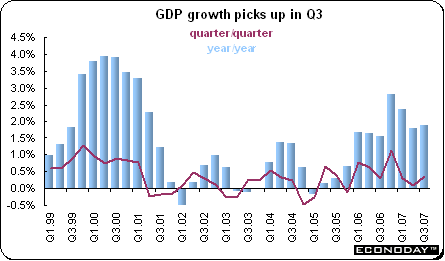
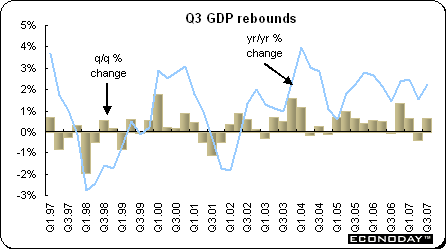
Third quarter gross domestic product was up 0.6 percent on the quarter and 2.1 percent when compared with the same quarter a year ago. GDP grew at an annualized rate of 2.6 percent. Second quarter GDP was revised to a decline of 0.4 percent on the quarter from the previous estimate of a decline of 0.3 percent. Private consumption was up 0.4 percent on the quarter after dropping 0.5 percent in the second quarter. Private residential investment, the largest drag on growth, sank 7.8 percent on the quarter after dropping 1.4 percent in the second quarter after the government enforced stricter rules for obtaining building permits in response to a 2005 scandal involving faked earthquake-engineering data. Private non-residential investment rebounded and was up 1.7 percent after dropping 2.1 percent in the second quarter. Net exports or the difference between exports and imports was a major contributor to growth. Exports rose 2.9 percent and imports gained 0.5 percent from the second quarter.
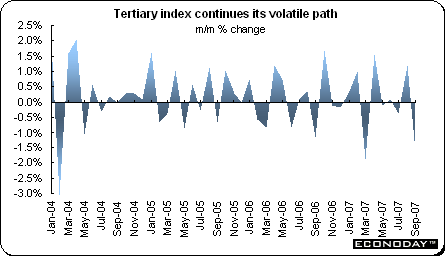
September tertiary industry index dropped 1.6 percent but remained 1.6 percent above the same month a year ago. Six of the major industry groups declined while five recorded gains. Those declining included wholesale & retail trade, finance & insurance, information & communications, services, transport, eating & drinking places & accommodations. Industries that were up on the month included medical, health care & welfare, learning support, compound services, electricity, gas, heat supply & water and real estate. The service sector employs more than half of Japan's workforce, and spending on services such as retailing, dining and travel is closely tied to changes in income and consumer confidence.
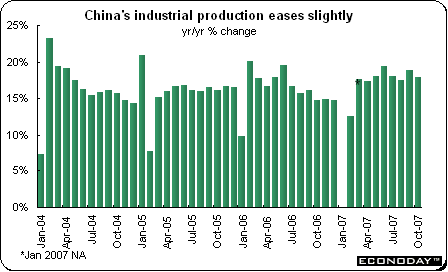
China — October industrial output was up 17.9 percent — down from September’s torrid pace of 18.9 percent — when compared to the same month a year ago. For the first nine months of the year, output was up 18.5 percent when compared with the same months in 2006. Raw steel production was up 13.5 percent after increasing 17.5 percent in September. Cement product was up 9.6 percent, down from 12.8 percent in the prior month. Automobile output rose 24.3 percent in October from a year earlier. Computer, telecommunications and electronic equipment production climbed 18.9 percent.
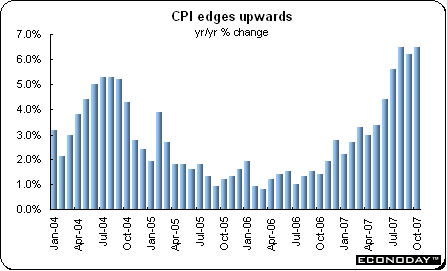
October consumer price index was up 6.5 percent when compared with the same month a year ago. Urban CPI was up 6.1 percent while the rural CPI was up 7.2 percent. Once again food prices remained a source of worry. Overall food prices soared by 17.6 percent after rising 16.9 percent in September. Meat prices in particular were up 38.3 percent on the year — but this gain follows three months of prices increases over 40 percent. Other than food, prices were mixed with those for clothing, transportation & communication and recreation & education declining and those for durable consumer goods, health care, housing, utilities and rent increasing.
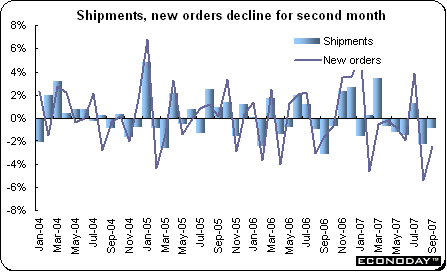
Canada — September factory shipments dropped 0.9 percent but were up 1.2 percent when compared with the same month a year ago. The decline reflected broad-based drops among the major sub-categories with the general weakness underlined by a 2.5 percent drop in new orders and a 1.3 percent slide in backlogs. Despite the dip in sales, lower inventories ensured that the inventory-to-sales ratio held steady at 1.31 months. Only six of the 21 industries recorded increased sales with a 16.5 percent bounce in autos helping transportation equipment (8.1 percent) to lead the way. Excluding autos, sales were down a much more significant 2.7 percent. The other main winner was aerospace which saw sales increase 3.8 percent. Losses were most marked in the computer & electronic equipment sector (11.9 percent) followed by wood product manufacturers (4.9 percent) which continue to be hit by strike activity in Western Canada. Industrial unrest also affected the paper production sector where sales slumped 6.0 percent.
Inflation and growth data dominated economic releases last week, and while price data proved worrisome in Europe, it was not the case in the U.S. Flash third quarter gross domestic product data showed that growth had picked up in the major countries of the eurozone and in Japan. In central banking news, the Federal Reserve announced an enhanced communications policy of quarterly economic projections. It previously released its forecasts during the chairman’s semi-annual Congressional testimony. In addition, the projections would extend for three years rather than two. In Japan, the Bank of Japan continued to refrain from changing its key interest rate from 0.5 percent.
This next week will be quiet given the U.S. Thanksgiving Day holiday on Thursday. However, on Tuesday, the dominant event will be the first release of the new Fed forecast. Undoubtedly it will make up for the dearth of other new economic news during the week.
| Central Bank activities |
|
| November 20 |
United States |
FOMC Minutes Released |
|
|
FOMC Forecast Released |
|
|
|
| The following indicators will be released this week... |
| Europe |
|
|
| November 20 |
Germany |
Producer Price Index (October) |
| November 22 |
Germany |
Gross Domestic Product (Q3.07 final) |
| November 23 |
France |
Consumption of Manufactured Goods (October) |
|
UK |
Gross Domestic Product (Q3.07 second estimate) |
|
|
|
| Asia/Pacific |
|
|
| November 21 |
Japan |
Merchandise Trade Balance (October) |
|
|
All Industry Activity Index (September) |
|
|
|
| Americas |
|
|
| November 20 |
Canada |
Consumer Price Index (October) |
| November 21 |
Canada |
Retail Sales (September) |
| Central Bank activities |
|
| November 28 |
United States |
Federal Reserve Beige Book |
| The following indicators will be released this week... |
| Europe |
|
|
| November 27 |
Germany |
Ifo Business Survey (November) |
| November 28 |
EMU |
M3 Money Supply (October) |
| November 29 |
Germany |
Unemployment Rate (November) |
|
Italy |
Producer Price Index (October) |
| November 30 |
EMU |
Gross Domestic Product (Q3.07 preliminary) |
|
|
Harmonized Index of Consumer Prices (November flash) |
|
EU |
Economic Sentiment (November) |
| Asia/Pacific |
|
|
| November 28 |
Japan |
Retail Sales (October) |
| November 29 |
Japan |
Industrial Production (October) |
| November 30 |
Japan |
Consumer Price Index (October, November) |
|
|
All Household Spending (October) |
|
|
Unemployment (October) |
| Americas |
|
|
| November 29 |
Canada |
Industrial Product Price Index (October) |
|
|
Raw Materials Price Index (October) |
| November 30 |
Canada |
Monthly Gross Domestic Product (September) |
![[Econoday]](images/econoday_logo_slim.gif)
Important Legal Notice: Econoday has attempted to verify the information contained in this calendar. However, any aspect of such info may change
without notice. Econoday does not provide investment advice, and does not represent that any of the information or related analysis is accurate or complete at any time.
Consensus Data Sources: Econoday Consensus Survey and Market News
|
| |
| Legal Notices | ©Copyright 1998-2024 Econoday, Inc. |
powered by ![[Econoday]](images/logo.gif)
|
| |
|
Econoday Suggestion Box: We welcome your ideas on how we can serve you better.
|
|