
 A Fed vigil
By Anne D. Picker, Chief Economist, Econoday
Friday, September 14, 2007

It seems as though just as the markets calm and investors regain those positive thoughts, something happens and we need to start again. After the sell off on Monday thanks to the continuing negative reaction to the U.S. employment situation report, several days of calm ensued and investors added to their portfolios ahead of the expected Fed interest rate cut. Some investors truly were seeing the glass as half full and were hoping that the worst of the credit crunch was over. They were wrong. But this time, the rude awakening took place Friday in the UK. The Bank of England went to the assistance of Northern Rock, the fourth largest mortgage lender.
However, on the week, the star performer was Hong Kong Hang Seng, which soared 3.8 percent to a new record high and is now up about 25 percent from its December 2006 close. The record close came before Friday's announcement by the People's Bank of China that it had raised interest rates to dampen inflation.
Crude oil soared over $80 a barrel during the week despite the decision by the Organization of Petroleum Exporting Countries (OPEC) to increase production by 500,000 barrels a day ahead of the heating season. Wheat also hit a record high on fears of a global shortage, but trimmed some of its gains on profit taking.
On the week, 11 of 14 indexes followed here were up despite investor unease. The Topix and Kospi were down 0.8 percent and Bolsa lost 0.5 percent.
|
|
2006 |
2007 |
% Change |
|
Index |
Dec 29 |
Sep 7 |
Sep 14 |
Week |
Year |
| Asia |
|
|
|
|
|
|
| Australia |
All Ordinaries |
5644.3 |
6296.5 |
6315.7 |
0.30% |
11.90% |
| Japan |
Nikkei 225 |
17225.8 |
16122.2 |
16127.4 |
0.03% |
-6.38% |
|
Topix |
1681.1 |
1557.0 |
1544.7 |
-0.79% |
-8.11% |
| Hong Kong |
Hang Seng |
19964.7 |
23982.6 |
24898.1 |
3.82% |
24.71% |
| S. Korea |
Kospi |
1434.5 |
1884.9 |
1870.0 |
-0.79% |
30.36% |
| Singapore |
STI |
2985.8 |
3489.0 |
3536.4 |
1.36% |
18.44% |
|
|
|
|
|
|
|
| Europe |
|
|
|
|
|
|
| UK |
FTSE 100 |
6220.8 |
6191.2 |
6289.3 |
1.58% |
1.10% |
| France |
CAC |
5541.8 |
5430.1 |
5538.9 |
2.00% |
-0.05% |
| Germany |
XETRA DAX |
6596.9 |
7436.6 |
7497.7 |
0.82% |
13.66% |
|
|
|
|
|
|
|
| North America |
|
|
|
|
|
|
| United States |
Dow |
12463.2 |
13113.4 |
13442.5 |
2.51% |
7.86% |
|
NASDAQ |
2415.3 |
2565.7 |
2602.2 |
1.42% |
7.74% |
|
S&P 500 |
1418.3 |
1453.6 |
1484.3 |
2.11% |
4.65% |
| Canada |
S&P/TSX Comp. |
12908.4 |
13651.2 |
13846.4 |
1.43% |
7.27% |
| Mexico |
Bolsa |
26448.3 |
30252.8 |
30096.0 |
-0.52% |
13.79% |
Thanks to hefty increases mid-week, the FTSE, CAC and DAX managed respectable gains last week. Stocks sank on both Monday and Friday. On Monday, it was continued reaction to the previous Friday’s employment situation report in the U.S. On Friday, equities sank after the Bank of England agreed to provide emergency funds to Northern Rock plc (the UK’s fourth largest home lender) to ease a liquidity squeeze. The Bank said it would provide Northern Rock with a short-term credit line to keep it operating. Indexes also were weighed down by China's decision to raise interest rates for the fifth time since March, and by a report showing U.S. retail sales rose less than economists estimated in August.

Early in the week optimism was boosted by reports that some financing for a key merger had gone through. And energy and mineral company shares were up thanks to record high crude oil prices along with higher prices for copper. Bank and other financial stocks also managed to stage a partial recovery on expectations of a FOMC rate cut on September 18. After last Friday’s employment report, the weekly U.S. jobless claims report garnered extra attention — claims were up less than anticipated in what proved to be good news for equities.
After a volatile week, with rather large swings in both intra- and interday trading, only the Kospi and Topix declined on the week. Stocks were down on Monday as Asian markets staged a delayed reaction to the previous Friday’s U.S. employment report. Also dampening equities was the larger than expected downward revision of Japan’s second quarter gross domestic product report. The decline was mainly due to the revision to corporate investment, which was revised down to a 1.2 percent decline from a 1.2 percent gain. But the indexes quickly recovered on Tuesday in response to a steadying of equities elsewhere and as investors focused on a Federal Reserve interest rate reduction that they anticipate for September 18.

The Hang Seng, after two days of indecision, soared ahead for the last three days of the week, and set new record highs as well. Investors focused on the much anticipated U.S. interest rate cut. The Hong Kong dollar is pegged to its U.S. counterpart and any reduction in interest rates in the U.S. is immediately passed on to Hong Kong investors. On Friday, Hong Kong stocks closed at a record high for a third straight session on expectations of a U.S. interest rate cut and on strong bids for a government land auction. Property stocks led the gainers.
Stocks in Japan spiked sharply in an initial reaction to the news that Prime Minister Shinzo Abe would be stepping down after less than year. On Wednesday, the political uncertainty surrounding the resignation pressured Japanese markets. However, stocks proved to be resilient as the week ended with major gains on Friday. Tokyo stocks advanced, led by exporters that were boosted by a weaker yen. Japan's financial markets will be closed on Monday for a national holiday.
People’s Bank of China increases interest rates again
The People’s Bank of China increased its policy interest rate for the fifth time since March in its attempts to curb inflation and dampen stock and real estate speculation. The increase of 27 basis points brought the interest rate to a nine-year high of 7.29 percent. The PBoC had last increased rates less than a month ago. At the same time the one year deposit rate will increase to 3.87 percent from 3.6 percent. China continues to be flooded with cash thanks to its huge international trade surplus that has pushed up consumer prices at twice the PBoC’s target. Besides raising rates, the Bank has increased reserve requirements on seven occasions this year. China's action contrasts with efforts of other central banks that are trying to boost liquidity because of a credit squeeze in the U.S. The European Central Bank and Bank of Japan delayed planned interest-rate increases while the Federal Reserve is expected to cut rates at its meeting this week.

The U.S. dollar declined to new record lows against the euro, dropping as low as $1.3927 in intraday trading. The prospect of a U.S. interest rate cut has reduced the attractiveness of the dollar. While U.S. interest rates are expected to decline, rhetoric from the European Central Bank continues to hint at the possibility of interest rate increases. The spread between interest rates in the U.S. and the EMU could narrow this week by as much as 50 basis points. The current U.S. fed funds target rate is 5.25 percent while the ECB’s key rate is 4.25 percent. Although the dollar has been sliding gradually, the current impetus stems from the subprime debacle which has led forecasters to lower their estimates of U.S. economic growth. The stronger euro could benefit consumers because some imports will be cheaper. Companies could benefit as well because many commodities such as oil and metals as well as many raw materials are priced in dollars. On the other hand, it should be tougher on exports because goods will be more expensive in destination countries such as the U.S.

The yen continues to fluctuate against the dollar and euro. Last week, the yen was down against both currencies as investors’ appetite for risk increased. The unexpected resignation of Prime Minister Shinzo Abe raised doubts anew of whether the Bank of Japan would boost interest rates again this year. And the larger than anticipated downward revision to GDP does not help the BoJ who would like to normalize the interest rate structure. In the past, the BoJ has been unwilling to move in times of political turmoil and is now expected to wait and see before making any move. The BoJ's key overnight lending rate of 0.5 percent is the lowest among major economies. The low rate has encouraged investors to borrow in Japan to finance carry trade transactions where they borrow in countries with low interest rates and invest in higher-yielding assets elsewhere. Higher borrowing costs in Japan would decrease the profitability of the trade.

The Canadian dollar or loonie continues to approach parity with its U.S. counterpart. The last time the Canadian currency equaled one U.S. dollar was November 1976. Lower U.S. interest rates would make the Canadian currency more appealing because of the narrowing of the interest rate spread between the two countries. Currently, the U.S. fed funds target is 5.25 percent while the Bank of Canada’s target rate is 4.5 percent. The loonie was also helped by surging crude oil and other commodity prices.

EMU — July industrial output was up 0.6 percent and up 3.6 percent when compared with last year. Compared with the second quarter average, July production was up a healthy 0.8 percent while the three month moving average showed a respectable 0.5 percent increase. Underpinning the recovery was the capital goods sector which posted a monthly gain of 1.0 percent supported by a 0.5 percent rise in intermediates and a 0.3 percent increase in non-durable consumer goods. Consumer durables output edged down 0.1 percent while energy edged up 0.1 percent. Among the larger EMU states, France posted an impressive 1.6 percent increase but Germany only edged up 0.1 percent and Spanish output fell 0.3 percent.

August harmonized index of consumer prices was up 0.1 percent and 1.7 percent when compared with last year for the lowest inflation rate since October 2006. The easing was concentrated in energy. Core HICP (excluding food, drink, tobacco and energy) was up 0.2 percent and 1.9 percent on the year. Indeed, simply excluding the energy, HICP inflation was flat at 2.0 percent and so already at the upper limit of the ECB pain threshold. Among the major categories the largest declines were posted by energy (0.9 percent), transport (0.5 percent) and health (0.4 percent). The most significant gains were in clothing (0.7 percent) and alcohol & tobacco (0.5 percent).

France — July industrial production excluding construction was up 1.3 percent and 2.6 percent when compared with last year and a marked improvement over June. All of the major sectors posted respectable increases except the consumer sector which contracted 0.1 percent on the back of sharply lower clothing & leather production (3.8 percent) and food & agriculture where output was flat. Leading the overall advance was the previously depressed auto sector where production surged 4.7 percent followed by semi-finished goods (1.7 percent) and capital goods (1.0 percent). Energy rose 0.6 percent and construction 0.4 percent.

July merchandise trade balance widened to €3.3 billion from €3.1 billion in June. Over the first seven months of the year, the deficit stands at €19.3 billion, up 19 percent from the €16.2 billion shortfall posted over the same period in 2006. In the unadjusted data, total exports excluding military products were essentially flat on the month with a welcome 4.6 percent bounce in consumer goods offset by smaller falls among a number of the other sectors. The largest contribution to a 0.7 percent total imports increase was provided by energy products which advanced some 6.8 percent. As usual, the most prominent bilateral deficit was registered with Germany, followed by Belgium/Luxembourg and Ireland. Significant surpluses were achieved with Spain, the UK and Greece. Bilateral trade with the U.S. was in broad balance.

Italy — Second quarter gross domestic product was confirmed at an increased of 0.1 percent on the quarter and 1.8 percent when compared with the same quarter a year ago. This was the slowest quarterly pace since the fourth quarter of 2005 and the most sluggish annual pace since the third quarter of 2006. Private consumption rose 0.6 percent on the quarter while government consumption and capital investment both were up 0.1 percent, the latter supported by a 9.9 percent surge in transportation that just offset declines of 0.3 percent and 1.3 percent in machinery and construction. Exports shrunk 1.0 percent and imports 0.3 percent, causing net exports to subtract 0.2 percentage points from the bottom line. Inventories also contracted to reduce GDP growth by 0.1 percentage point. The GDP deflator was up 0.8 percent on the quarter and 2.4 percent on the last year.

July industrial production declined 0.4 percent — the third month out of four — and the weakest since September 2006. Industrial production is down 0.3 percent when compared with the same month last year. By category, the worst performer was intermediates which dropped 1.5 percent followed by a smaller 0.5 percent drop in energy. Capital goods were up 0.3 percent while consumer goods were up a respectable enough 0.5 percent, this followed a 1.5 percent nosedive in June. Within the key consumer sector, the reluctance to purchase big ticket items was underlined by a combined slump of some 3.7 percent in the last two months.

United Kingdom — August producer output prices edged up 0.1 percent and were up 2.5 percent when compared with last year. This was the weakest monthly gain since November 2006 and in the main reflected modest gains in food and transport costs. Excluding food, drink, tobacco and gasoline, the core index was up 0.2 percent and 2.4 percent on the year. Producer input prices were down 1.1 percent but up 0.6 percent on the year. Primarily responsible for the decline was a 5.3 percent drop in crude oil prices, helped to a lesser degree by drops in fuel (1.9 percent) and imported metals (1.3 percent). Excluding food, drink, tobacco and petrol, the core index rose 0.1 percent last month but even then the annual increase is still a comparatively subdued 1.7 percent.

July merchandise trade deficit widened significantly to £7.1 billion as an expansion in the bilateral red ink with the non-EU bloc easily more than offset an improvement in net exports with the EU states. Both volumes of exports (3.6 percent) and imports (4.1 percent) grew sharply over the month. However, excluding oil and erratics the shortfall also widened slightly to £6.6 billion from £6.4 billion.

Average earnings for the three months ending in July accelerated to 3.5 percent from 3.4 percent when compared with the same three months a year ago. For July alone, earnings jumped from a subdued 3.3 percent to 3.8 percent on the year. The increase appears to have been mainly due to a timing issue with bonus payments in the financial sector. This was responsible for the jump in private sector earnings growth by a full percentage point to 4.2 percent. However, earnings in the public sector actually decelerated to 2.7 percent from 3.1 percent.

August claimant count unemployment rate was 2.6 percent, down from an upwardly revised 2.7 percent in July. This is the lowest rate since April 2005. The dip occurred despite a smaller than anticipated 4,200 drop in the number of unemployed which reduced the level of the claimant count to 852,900, also the lowest since April 2005. This was the 11th consecutive monthly drop in joblessness but the pace of decline has slowed significantly from the 14,000 average monthly decline registered in the second quarter. That said, a 20,300 increase in vacancies over the latest three months suggest that the demand for labor is still relatively high. Indeed, it may be that part of the reason for softening in the unemployment downtrend is a diminishing pool of skilled workers. The ILO measure of unemployment was 5.4 percent, as expected, in the three months to July. The unemployment level was 1.65 million over the period. Full-time employment was up 105,000 over the latest three months while part-time payrolls dropped 21,000. All of the recent growth in payrolls has occurred in the private sector.

Japan — Second quarter gross domestic product was revised downward to a decline of 0.3 percent from an increase of 0.1 percent. When compared with the same quarter last year, GDP was revised downward to an increase of 1.6 percent from the original estimate of a 2.3 percent gain. On an annualized basis GDP was down 1.2 percent after an originally estimated increase of 0.5 percent. GDP last declined in the first quarter of 2003 when it declined by 0.4 percent on the quarter. The GDP deflator declined 0.3 percent. All components either remained unchanged or were revised downward. Domestic demand was revised from an increase of 0.1 percent to a decline of 0.3 percent on the quarter. Private consumption was revised downward from an increase of 0.2 percent to a decline of 0.4 percent. Private nonresidential investment also was revised downward from an increase of 1.2 percent to a decline of 1.2 percent.

August corporate goods price index was unchanged on the month and up 1.9 percent when compared with last year. Prices for petroleum and coal products were up while nonferrous metals prices were down. Wholesale prices have increased for more than three years but have had little impact on consumer prices as producers have been unable to pass these increases onto their customers.
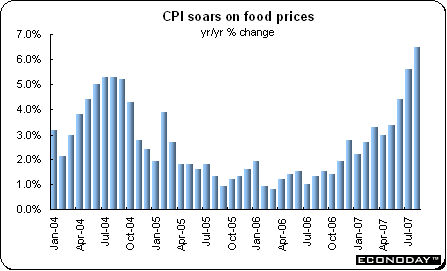
China — August consumer price index accelerated for the fourth month and soared 6.5 percent from a year earlier after jumping 5.6 percent in July. Food prices, which make up about a third of CPI, jumped 18.2 percent, accelerating from July's 15.4 percent gain. Meat and poultry price increases accelerated to 49 percent on the year from July's 45 percent. Fresh vegetables were up 23 percent compared with July's 19 percent increase. Food prices have been surging in large part on sky-high pork prices due to an outbreak of a deadly pig disease that has shrunk supplies of pork, while flooding has raised vegetable prices. Nonfood prices were up 0.9 percent, unchanged from July's increase.
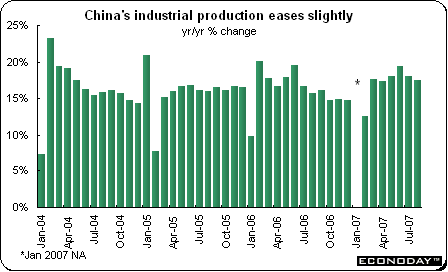
August industrial production eased for the second month increasing by 17.5 percent from a year earlier after the government increased taxes on exports. For the first eight months, industrial production rose 18.4 percent from a year earlier. That compares with the 16.6 percent gain for all of 2006. Automobile output climbed 21.7 percent, slowing from a 32.7 percent increase in July. Cement production was up 13.3 percent after an 11.6 percent gain. Steel products output was up 23.7 percent, almost the same as July’s 23.9 percent growth.
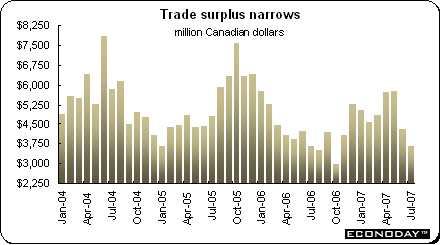
Canada — July merchandise trade surplus narrowed to C$3.7 billion as a 1.4 percent monthly gain in exports was more than offset by a 3.5 percent jump in imports. The bilateral surplus with the U.S. shrunk to C$6.5 billion, helped in no small way by the 8.0 percent appreciation of the local currency against the U.S. dollar since April. The surplus with the EU narrowed by 1.4 percent but increased with other OECD countries. Underpinning the surge in imports was a 14.1 percent leap in the automotive sector, backed up by a 2.8 percent increase in machinery and equipment and a 3.8 percent advance in other consumer goods. The largest decline was registered in energy products (10.6 percent) with smaller declines posted in forestry products (2.0 percent) and agriculture & fishing products (0.4 percent). Within total exports, the only significant drop was in energy (6.6 percent) led by weakness in natural gas & electricity. However, marked increases were achieved by industrial goods & materials (6.6 percent) and automotive products (7.1 percent).
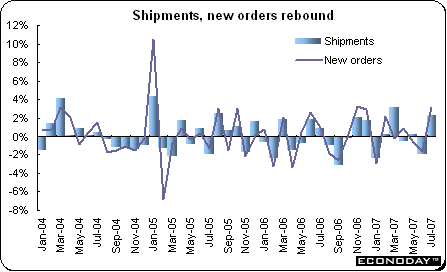
July factory shipments rebounded strongly with a gain of 2.3 percent that more than reversed a larger revised 2.0 percent slide in June. In volume terms the increase was even more impressive, up 4.3 percent. New orders also jumped, up 3.2 percent while unfilled orders gained 2.9 percent. With inventories edging up just 0.2 percent, the inventory/shipments ratio fell back to the 1.26 months, returning to the level seen every month since April, apart from June. Underpinning the rise in shipments at the start of the quarter was a 17.6 percent increase in auto manufacturers that signalled a return to more normal levels for the industry following summer shutdowns. Excluding this sector, shipments would have been up a much more modest 0.4 percent. In addition, petroleum and coal products rose 3.2 percent, the fifth increase in the last six months. On the negative side, primary metals were down 2.6 percent, albeit in part due to labour disputes.
Last week saw a revival in equities as investors continued to adjust their portfolios. On Friday however, subprime concerns moved to the UK after the Bank of England revealed it had provided emergency funding for the mortgage lender Northern Rock. Equities and the pound sterling dropped as analysts immediately decided that British interest rates had reached their ceiling at 5.75 percent.
Two central banks meet this week — the Federal Reserve and the Bank of Japan. With the FOMC, the debate has centered on the size of the interest rate cut rather than whether they would lower their fed funds target from 5.25 percent.
With the Bank of Japan, the issue is complex. The consensus at this writing is that the BoJ will leave their key interest rate unchanged at 0.5 percent. The Bank has been eager to normalize interest rate policy after years of deflation. However, consumer prices remain stubbornly just below the break even level making it difficult for the Bank to forge ahead. And the downward revisions to second quarter gross domestic product present a picture of a weak economy. The political ramifications of Prime Minister Abe’s resignation and the appointment of his successor only add to the uncertain picture surrounding Japan and its economy. The new prime minister is slated to be selected September 23.
| Central Bank activities |
|
| September 18 |
United States |
FOMC Meeting |
| September 18,19 |
Japan |
Bank of Japan Monetary Policy Meeting |
|
|
|
|
|
|
| The following indicators will be released this week... |
| Europe |
|
|
| September 17 |
EMU |
Merchandise Trade Balance (July) |
| September 18 |
Germany |
ZEW Business Survey (September) |
|
UK |
Consumer Price Index (August) |
| September 19 |
Germany |
Producer Price Index (August) |
| September 20 |
UK |
Retail Sales (August) |
|
|
|
| Asia/Pacific |
|
|
| September 18 |
Japan |
Tertiary Sector Index (July) |
| September 21 |
Japan |
All Industry Sector Index (July) |
|
|
|
| Americas |
|
|
| September 19 |
Canada |
Consumer Price Index (August) |
![[Econoday]](images/econoday_logo_slim.gif)
Important Legal Notice: Econoday has attempted to verify the information contained in this calendar. However, any aspect of such info may change
without notice. Econoday does not provide investment advice, and does not represent that any of the information or related analysis is accurate or complete at any time.
Consensus Data Sources: Econoday Consensus Survey and Market News
|
| |
| Legal Notices | ©Copyright 1998-2024 Econoday, Inc. |
powered by ![[Econoday]](images/logo.gif)
|
| |
|
Econoday Suggestion Box: We welcome your ideas on how we can serve you better.
|
| 
