
 August is over!
By Anne D. Picker, Chief Economist, Econoday
Friday, August 31, 2007

Choppy trading dominated the last week of August as credit market woes continued to rattle investors. Market turbulence has diverted attention away from economic data in recent weeks, but now with the markets somewhat calmer, investors will look carefully for any fallout on the real economy. Along that vein, certain economic data got close scrutiny while others did not. For example, U.S. gross domestic product growth which was revised upward for the second quarter did not garner as much attention as the weekly jobless report that showed an increase in those registering claims. And earlier in the week, the second quarter Case-Shiller home price index showed a decline of 3.2 percent on the year, exacerbating investor nerves and prompting them to consider the impact of the subprime mortgage crisis on the wider economy.
At week’s end tensions increased as investors awaited a speech by Fed Chairman Ben Bernanke and remarks by U.S. president George Bush about a government plan to help strapped home owners. Asian investors rushed into equities in Friday’s trading convinced that the U.S. president would bail out home owners in the subprime mess. Trading was light in the morning as many investors waited for hints from Bernanke as to the central bank's future monetary policy. But buying accelerated following media reports that Bush planned to outline a subprime mortgage rescue initiative Friday. This lifted major Asian stock indexes sharply higher toward the end of the day's trading.
Stocks climbed in Europe and the Americas on Friday as well, thanks to a pledge by President Bush to help people who have fallen behind in their mortgage payments. Analysts hope that the Bush plan will prevent a decline in consumer confidence. Bush said he will let the Federal Housing Administration, which insures mortgages for low- and middle- income borrowers, guarantee loans for delinquent borrowers, allowing them to avoid foreclosure and refinance at more favorable rates. He also promised to tighten safeguards against predatory lending.
Indexes extended gains after a report showed consumer spending in the U.S. rose more than forecast in July and inflation cooled, a signal the economy was expanding at the start of the third quarter before credit markets deteriorated. The data were followed by Bernanke who said the central bank will do what's necessary to limit damage that may arise from a deepening housing recession.
All indexes followed here were up on the week. The All Ordinaries, Hang Seng, DAX, Dow, Nasdaq and the S&P 500 were up for the month of August. All indexes are up for the year with the exception of the Nikkei and Topix.
|
|
2006 |
2007 |
% Change |
|
Index |
Dec 29 |
Aug 24 |
Aug 31 |
Week |
Month |
Year |
| Asia |
|
|
|
|
|
|
|
| Australia |
All Ordinaries |
5644.3 |
6087.2 |
6248.3 |
2.65% |
0.98% |
10.70% |
| Japan |
Nikkei 225 |
17225.8 |
16249.0 |
16569.1 |
1.97% |
-3.94% |
-3.81% |
|
Topix |
1681.1 |
1585.9 |
1608.3 |
1.41% |
-5.74% |
-4.33% |
| Hong Kong |
Hang Seng |
19964.7 |
22921.9 |
23984.1 |
4.63% |
3.45% |
20.13% |
| S. Korea |
Kospi |
1434.5 |
1791.3 |
1873.2 |
4.57% |
-3.11% |
30.59% |
| Singapore |
STI |
2985.8 |
3369.5 |
3392.9 |
0.70% |
-4.36% |
13.63% |
|
|
|
|
|
|
|
|
| Europe |
|
|
|
|
|
|
|
| UK |
FTSE 100 |
6220.8 |
6220.1 |
6303.3 |
1.34% |
-0.89% |
1.33% |
| France |
CAC |
5541.8 |
5569.4 |
5662.7 |
1.68% |
-1.54% |
2.18% |
| Germany |
XETRA DAX |
6596.9 |
7507.3 |
7638.2 |
1.74% |
0.71% |
15.78% |
|
|
|
|
|
|
|
|
| North America |
|
|
|
|
|
|
| United States |
Dow |
12463.2 |
13378.9 |
13357.7 |
-0.16% |
1.10% |
7.18% |
|
NASDAQ |
2415.3 |
2576.7 |
2596.4 |
0.76% |
1.97% |
7.50% |
|
S&P 500 |
1418.3 |
1479.4 |
1474.0 |
-0.36% |
1.29% |
3.93% |
| Canada |
S&P/TSX Comp. |
12908.4 |
13520.3 |
13660.5 |
1.04% |
-1.50% |
5.83% |
| Mexico |
Bolsa |
26448.3 |
30041.5 |
30347.9 |
1.02% |
-1.02% |
14.74% |
| Markets in the UK were closed on Monday, August 27, 2007 |
|
|
|
The FTSE, DAX and CAC were up last week, despite heavy losses on Tuesday. For the FTSE, Tuesday’s loss followed a six-day recovery rally as new fears resurfaced over potentially wider implications of the subprime lending crisis. But Wednesday was another day and equities in Europe and the UK rebounded on the heels of a recovery in financial stocks as crises worries abated some. Strong corporate news also helped to fuel better sentiment among investors. However, worries about the global economic outlook returned Wednesday after release of the Fed's FOMC minutes where the Fed acknowledged that troubled conditions on world credit markets “might require a policy response.” This was several weeks before it reduced its discount interest rate to improve liquidity in the credit markets.

On Friday, stocks were helped by both the Bush and Bernanke speeches as well as promising U.S. data. Bernanke reiterated that the central bank will do what is necessary to limit damage that may arise from a deepening housing recession. A report showed consumer spending in the U.S. was up more than forecast in July and inflation cooled as measured by the Fed’s favored price measure, the PCE price index. This was interpreted as a signal the economy was expanding at the start of the third quarter before credit markets deteriorated. The FTSE, CAC and DAX were up 1.3 percent, 1.7 percent and 1.7 percent respectively for the week. For the month of August, the DAX was up 0.7 percent while the FTSE lost 0.9 percent and the CAC was down 1.5 percent.
Anticipating relief for the beleaguered U.S. mortgage market, equities in the Asia/Pacific area ended the week and the month on a positive note. All six indexes followed here were up on the week, but only the Hang Seng and the All Ordinaries were up for the month of August. The losses for the remaining indexes ranged from 3.1 percent (Kospi) to 5.7 percent (Topix). For the eight months of 2007, the Nikkei and Topix are down 3.8 percent and 4.3 percent respectively. The Kospi has gained 30.6 percent so far this year while the Hang Seng has increased by 20.1 percent. The STI is up 13.6 percent while the All Ordinaries trails with a gain of 10.7 percent.

Trading was choppy during the week with investors incurring the largest losses on Wednesday after overnight declines (Tuesday) in U.S. stock market averages. But on Thursday stock markets across Asia rebounded after the region's currencies stabilized in the previous trading session. Caution continued to prevail as investors focused on the health of the U.S. economy — and its implications for the region which is still dependent on exports to the U.S. — and ahead of a major speech by Fed Chairman Ben Bernanke on Friday and belief that the Fed would reduce interest rates at or before their next FOMC meeting on September 18. Bernanke, in a letter to a senator, repeated his prior assertion that the Fed is “prepared to act as needed” should market disruptions threaten the economy. He repeated the same in his Jackson Hole Wyoming speech Friday morning.
Although the yen and euro were volatile from day to day, the change on the week was negligible for both currencies. The yen was up while the euro inched downward on the week. The yen fluctuated on investor attitudes towards risk. When investors became risk averse, they sold yen and the currency rose in value. When stocks fall currency investors tend to pare back carry trades — in which low-yielding currencies such as the yen are sold to finance the purchase of riskier, higher-yielding assets elsewhere. The value of the yen fluctuated inversely to movements in the stock market. When stocks rose, the yen fell as investors were attracted to riskier investments. Similarly, when stocks dropped, the yen rose as investors bailed out of their riskier positions.

EMU — M3 money supply for the three months ending in July was 11.1 percent when compared with the same three months a year earlier, up from 10.9 percent for the preceding three months. The preferred moving average measure of broad money has now accelerated on an annual basis every month since September 2006 with the only exception being June, when the pace remained unchanged from May. July itself was a record high and in large part reflected faster growth in lending to the private sector, which at 10.9 percent reached its highest level since November 2006.

July unemployment rate was 6.9 percent for the second month, equalling the lowest level seen since the series began in 1993. Among the countries reporting, jobless rates were stable in Germany (6.4 percent), the Netherlands (3.4 percent), Portugal (8.2 percent) and Slovenia (5.1 percent). There was a small decline in France (8.5 percent from 8.6 percent), while Belgium (7.5 percent from 7.4 percent) and Ireland (4.7 percent from 4.4 percent) both saw increases.

August flash harmonized index of consumer prices was up 1.8 percent when compared with last year and unchanged from July. As with all flash estimates, no details are provided. The full release will appear on September 14.

EU — August economic sentiment reading was 110.0, down from July’s 111.0 level. Among the principal sectors, retail sector sentiment edged up a notch to 4 but confidence in construction fell to minus 2 from 0 and in services to 20 from 21. Industry confidence was unchanged (4) but, disappointingly, confidence in the key consumer sector fell, albeit by just one point to minus 3.

Germany — August Ifo business conditions index edged down to 105.8 from 106.4 in July. The dip reflected a decline in the expectations component (100.4 from 101.7) that more than offset an essentially unchanged current conditions index (111.5 from 111.3). Among the major sectors, sentiment in manufacturing dropped from 23.5 to 21.5 and in construction from minus 15.3 to minus 17.5 but edged higher in retail from minus 5.4 to minus 4.2 and in wholesale from 8.0 to 8.1. IFO remains quite optimistic about the economy over the remainder of 2007 and repeated that for now, local exporters can live with current exchange rate levels.

August unemployment declined 15,000 but left the jobless rate at 9 percent for the second month. Payrolls were up by a solid enough 39,000 after the July increase of 43,000 and vacancies again edged a little higher, 2,000 versus July 1,000. The entire drop in unemployment in August was concentrated in the West which saw a decline of 22,000 compared with a 7,000 increase in the East. The data are broadly consistent with the ILO report released earlier which, though for July, showed an impressive 18th consecutive rise in employment to support another dip in the unemployment rate to just 6.2 percent.

July retail sales excluding cars and gasoline stations were up 0.3 percent and down 1.5 percent when compared with the same month a year ago. Retail sales including autos were up 0.5 percent but were down 2.4 percent on the year. In the last 12 months, non-food sales have managed a modest 1.2 percent increase but the food sector has tumbled 3.5 percent.

France — July unemployment rate remained at 8 percent for the second month. The number of jobless was unchanged from a month earlier at 2.206 million, according to the ILO definition which excludes jobseekers who did any work during the month. This was 240,000 below the level a year earlier. The report was in line with market expectations.

Italy — June retail sales were up 0.1 percent and 0.7 percent when compared with last year. Both food and non-food sectors registered monthly gains of 0.1 percent leaving the former a mere 1.2 percent above the June 2006 level and non-food a very disappointing 0.2 percent higher. Over the quarter as a whole non-food sales were flat and food up just 0.1 percent versus the previous period. Over the year to date, only the shoes and leather articles sector shows annual growth in excess of 1.5 percent while pharmaceuticals and other products show declines of 0.2 percent and 0.7 percent respectively.

July producer price index was up 0.4 percent and 2.1 percent when compared with last year. The monthly gain was led by energy goods which jumped 0.9 percent and outside of which, the PPI would have risen 0.3 percent. Among the other major sectors, intermediate goods were up 0.2 percent, consumer goods up 0.3 percent while capital goods were flat. Over the year, the main downward forces on the index have been coke & petroleum products (2.1 percent) and minerals (1.5 percent). The largest boosts have been provided by metals (6.8 percent), wood & furniture (5.1 percent) and food, beverages & tobacco (3.3 percent).

Japan — July retail sales sank 2.2 percent after dropping 0.4 percent in June when compared with the previous year. However, sales on the month were up a healthy 3.6 percent, the first monthly increase since March. Large scale retail stores plummeted 3.8 percent on the year. The consumer continues to be the weak link in Japan’s recovery.

July preliminary industrial production was down 0.4 percent but up 2.0 percent when compared with the same month a year ago. Analysts had expected an increase of 0.5 percent on the month. The industries that contributed to the decrease were transport equipment, chemicals excluding drugs and fabricated metals. Shipments declined 1.2 percent but were up 3.1 percent on the year.

July unemployment rate edged down to a nine-year low of 3.6 percent from 3.7 percent in June. The number of unemployed people declined for the 20th straight month, down 340,000 when compared with a year ago.

August Tokyo consumer price index was up 0.5 percent but down 0.2 percent when compared with the previous year. Core CPI excluding only fresh food was up 0.3 percent unchanged on the year. July national CPI was down 0.1 percent and unchanged on the year. The consensus forecast was for a decline of 0.1 percent on the year. Core July CPI excluding only fresh food was down 0.1 percent on the month and on the year. When excluding both food and energy, the CPI was down 0.2 percent on the month and 0.5 percent on the year. Prices were down for most of the major categories with the exception of housing and education which were unchanged on the month, transportation & communication which were up 0.6 percent, and reading & recreation, up 0.2 percent).

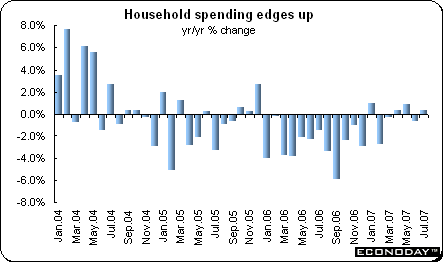
July worker household expenditures disappointed once again but were up 0.4 percent when compared with the previous year. In real terms, expenditures were up 0.5 percent. Analysts had expected expenditures to increase 1.2 percent. Expenditures for two or more person households declined. They were down 0.2 percent in nominal terms and down 0.1 percent in real terms.
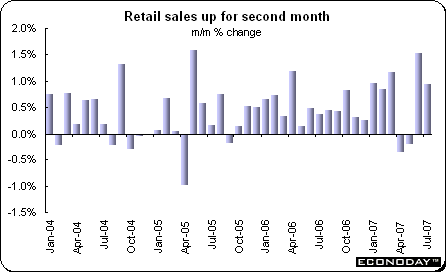
Australia — June retail sales were up 0.9 percent and were up 7.4 percent when compared with the same month a year ago. All major categories were up on the month with the exception of household goods which was down 0.7 percent and hospitality & services which was down 0.3 percent. Food sales were up 0.9 percent while department store sales soared by 5.7 percent. Retail sales increased for a second month as income-tax cuts, rising wages and jobs growth prompted consumers to spend more. Household disposable incomes are growing strongly and spending is supported by cash bonuses and tax cuts announced in the government's May budget.
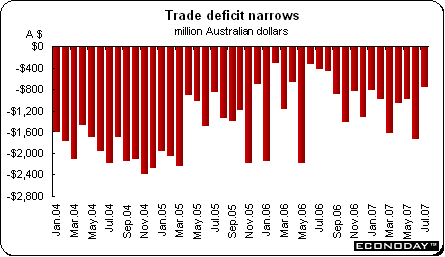
July merchandise trade deficit narrowed to A$756 million, from the June deficit of A$1,737 million as overseas shipments rebounded from transport disruptions caused by storms in the previous month. Exports were up 2.3 percent while imports dropped 2.9 percent. Non-rural and other goods exports were up 3 percent. Rural goods exports were also up 3 percent. Services exports were up 1 percent. Imports of capital goods sank 10 percent while intermediate & other goods dropped 3 percent.
Canada — July industrial product price index fell 0.7 percent. Leading the decline was the strength of the Canadian dollar along with a 3.9 percent drop in primary metals prices which followed two consecutive monthly increases. On an annual basis the IPPI edged down 0.3 percent for the first drop in 23 months. Also aiding the dip last month were falls in pulp and paper products (0.7 percent), machinery & equipment (0.5 percent), motor vehicles (0.8 percent) electrical & communications (0.5 percent) and chemicals (1.6 percent). Sizeable gains among the major sectors were limited to lumber & wood (0.9 percent) and petroleum & coal (0.8 percent). Excluding gasoline and coal, the IPPI fell 0.9 percent while excluding exchange rate effects the index would have fallen by less than half the headline pace at 0.3 percent.
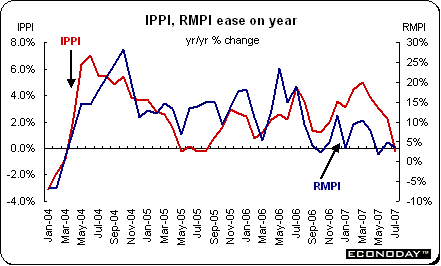
July raw materials price index soared a hefty 3.9 percent monthly — the largest gain so far in 2007. Underpinning the surge was a 9.5 percent leap in mineral fuels, itself largely due to an 11.9 percent increase in crude oil costs. Excluding this sector the RMPI would have risen a much more modest 0.9 percent. Conversely, prices for animals and animal products fell 1.9 percent versus June and there was also a 0.6 percent easing in non-ferrous metals. However, reflecting the erratic nature of the basket, lead prices soared by some 29.1 percent. Despite the monthly gain, over the 12 months to July the RMPI was up 3.5 percent, still well down on the 4.9 percent pace seen in the previous month.
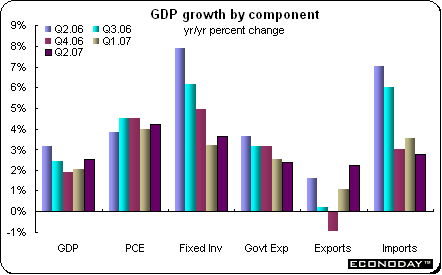
Second quarter gross domestic product was up 0.8 percent and 2.5 percent when compared with last year. On an annualized basis, GDP was up 3.4 percent. The increase reflected gains in consumer spending and investment expenditures as well as a rise in inventories and, despite the buoyancy of the C$, stronger exports too. Among the major output groups, services grew 0.9 percent and the goods producing sector 0.3 percent. Industrial output rose 0.4 percent while manufacturing was up for the first quarter since the end of 2005. Against this there were declines in oil & gas exploration, accommodation & food services, agriculture and forestry. Among the expenditure groups, consumer spending grew 1.2 percent and machinery & equipment jumped 1.5 percent. Business investment in nonresidential structures was up 0.5 percent with building investment up a solid 2.2 percent. Government spending increased by 0.6 percent. Perhaps most impressive, however, was a 0.7 percent increase in total exports while, on the back of strong domestic demand, imports climbed 1.6 percent.
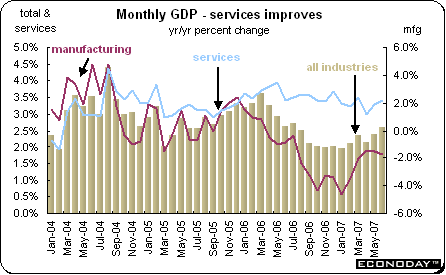
June monthly gross domestic product was up 0.2 percent and 2.6 percent when compared with last year. The goods producing side expanded by 0.3 percent following a 0.1 percent contraction in May while services were up 0.2 percent after a strong 0.5 percent increase previously. Industrial production more than reversed the 0.2 percent May drop with a solid 0.4 percent increase but manufacturing disappointed with a 0.4 percent drop led by a 0.8 percent slide in durable goods that more than offset a 0.3 percent increase in nondurables. Retail trade was also soft, posting a 0.6 percent contraction but the energy sector did well, rising some 1.5 percent.
Last week saw equity markets stabilize somewhat as fears continued to be calmed by the Federal Reserve, and on Friday by President Bush. The plethora of data was a mixed bag with many of the sentiment indexes declining, but not by as much as had been feared. The German Ifo declined slightly while consumer confidence in the U.S. was also down — but it could have been worse.
The U.S. celebrates Labor Day on Monday, traditionally the last day of summer. Next week will bring interest rate decisions from the Banks of Canada and England, the Reserve Bank of Australia and the European Central Bank. Until August’s turmoil, several of the banks were expected to increase rates, now none of them are despite keeping the semblance of maintaining their options. Important economic data are being released next week as well, including the U.S. and Canadian employment reports. In Australia, second quarter GDP growth will finally be available.
| Central Bank activities |
|
| September 5 |
Canada |
Bank of Canada Monetary Policy Announcement |
| September 5 |
Australia |
Reserve Bank of Australia Monetary Policy Announcement |
| September 5,6 |
UK |
Bank of England Monetary Policy Meeting |
| September 6 |
EMU |
European Central Bank Monetary Policy Meeting and Announcement |
|
|
|
| The following indicators will be released this week... |
| Europe |
|
|
| September 4 |
EMU |
Gross Domestic Product (Q2.07, first release) |
|
|
Producer Price Index (July) |
|
Italy |
Merchandise Trade (July) |
| September 5 |
EMU |
Retail Sales (July) |
| September 6 |
Germany |
Manufacturers Orders (July) |
| September 7 |
Germany |
Industrial Production (July) |
|
|
Merchandise Trade (July) |
|
|
|
| Asia/Pacific |
|
|
| September 5 |
Australia |
Gross Domestic Product (Q2.07) |
| September 6 |
Australia |
Employment, Unemployment (August) |
|
|
|
| Americas |
|
|
![[Econoday]](images/econoday_logo_slim.gif)
Important Legal Notice: Econoday has attempted to verify the information contained in this calendar. However, any aspect of such info may change
without notice. Econoday does not provide investment advice, and does not represent that any of the information or related analysis is accurate or complete at any time.
Consensus Data Sources: Econoday Consensus Survey and Market News
|
| |
| Legal Notices | ©Copyright 1998-2024 Econoday, Inc. |
powered by ![[Econoday]](images/logo.gif)
|
| |
|
Econoday Suggestion Box: We welcome your ideas on how we can serve you better.
|
| 
