
 Are investors ignoring risk'
By Anne D. Picker, Chief Economist, Econoday
Friday, May 18, 2007

Global Markets
Investor risk appetite showed no sign of diminishing last week as global equity markets climbed to fresh highs. The reason for the rally is that equities continue to be stirred up by merger and acquisition news in the U.S. and abroad. There was relatively little immediate impact from China’s announcement on Friday of measures aimed at cooling its economy and alleviating trade tensions with the U.S. ahead of talks between the two countries this week. After Asian/Pacific markets were closed on Friday, the Peoples Bank of China increased their key interest rates and its bank reserve requirement ratio and widened the band on allowable currency fluctuations.
The positive showing by world stock markets this week came as a persistent flow of merger and acquisition news and broadly positive earnings announcements offset higher oil prices. There was also some better news on the inflation front as U.S. consumer prices were up modestly and eurozone inflation remained below the European Central Bank's 2 percent target.
In the U.S., the Dow set a succession of record highs during the week while the S&P 500 stands within a whisker of its lifetime high of 1527.46 recorded in March 2000. Takeovers helped push the Dow to its ninth record this month on Friday. Announced mergers and acquisitions involving U.S. companies this year total $993 billion, 62 percent more than at the same time last year. For the week, only the Nikkei, Topix and Nasdaq lost ground.
Global Stock Market Recap
| |
|
2006 |
2007 |
% Change |
| |
Index |
December 29 |
May 11 |
May 18 |
Week |
Year |
| Asia |
|
|
|
|
|
|
| Australia |
All Ordinaries |
5644.3 |
6297.3 |
6319.7 |
0.4% |
12.0% |
| Japan |
Nikkei 225 |
17225.8 |
17553.7 |
17399.6 |
-0.9% |
1.0% |
| |
Topix |
1681.1 |
1723.1 |
1695.7 |
-1.6% |
0.9% |
| Hong Kong |
Hang Seng |
19964.7 |
20468.2 |
20904.8 |
2.1% |
4.7% |
| S. Korea |
Kospi |
1434.5 |
1603.6 |
1612.3 |
0.5% |
12.4% |
| Singapore |
STI |
2985.8 |
3446.9 |
3512.4 |
1.9% |
17.6% |
| |
|
|
|
|
|
|
| Europe |
|
|
|
|
|
|
| UK |
FTSE 100 |
6220.8 |
6565.7 |
6640.9 |
1.1% |
5.3% |
| France |
CAC |
5541.8 |
6050.6 |
6101.1 |
0.8% |
10.1% |
| Germany |
XETRA DAX |
6596.9 |
7479.3 |
7607.5 |
1.7% |
15.3% |
| |
|
|
|
|
|
|
| North America |
|
|
|
|
|
| United States |
Dow |
12463.2 |
13326.2 |
13556.5 |
1.7% |
8.8% |
| |
NASDAQ |
2415.3 |
2562.2 |
2558.5 |
-0.1% |
5.9% |
| |
S&P 500 |
1418.3 |
1505.9 |
1522.8 |
1.1% |
7.4% |
| Canada |
S&P/TSX Comp. |
12908.4 |
14003.8 |
14105.3 |
0.7% |
9.3% |
| Mexico |
Bolsa |
26448.3 |
30058.8 |
30676.3 |
2.1% |
16.0% |
Europe and the UK
The FTSE, DAX and CAC registered healthy gains last week, reversing the previous week’s losses and then some. The FTSE was up 1.2 percent while the CAC gained 0.8 percent and the DAX, 1.7 percent. Mergers — real and rumored almost daily — were enough to send stocks soaring. Even though many rumors are proving unfounded, investors are buying first and asking questions later — sometimes to be burned when the mergers do not materialize. Globalization has widened the pool of potential buyers while debt is relatively cheap and private equity firms have deep pockets. More of the FTSE’s 100 stocks are being targeted as merger prospects than two years ago, when bidding activity was largely confined to the small and mid-cap sector. That is partly because private equity firms are aiming at bigger companies than they did at that time. Only the top tier of companies is considered immune.

Cyprus and Malta have been given official approval to join the eurozone by the European Commission and the European Central Bank. The ECB gave both countries a favorable assessment on the economic and legal criteria for membership, covering measures such as inflation, public finances and central bank independence. The eurozone currently has 13 members. The entry of Cyprus and Malta, two of the EU’s smallest members, will have little economic impact on the rest of the eurozone — their combined GDP is about 0.3 percent of existing eurozone GDP. But it will increase by two to 21 the membership of the ECB's policy governing council. The two central bank governors will, in theory, carry as much weight as the president of Germany's Bundesbank.
Bank of England Inflation Report
The Bank of England released its latest Inflation Report mid-week. Analysts opined that it signaled more interest rate increases in the future to restrain inflation after accelerating economic growth drove unemployment to the lowest since October 2005. The Bank continues to see upside risks to inflation which, according to their forecasts, will exceed its 2 percent inflation target in two years unless interest rates continue to increase. The bank made little change to its growth forecasts over the next two years. They expect the economy to grow near 3 percent through 2008 and then slow gradually to just below that level in 2009.
The Bank’s monetary policy committee increased Interest rates to a six-year high of 5.5 percent earlier this month in an attempt to bring inflation back to 2 percent from a decade-high of 3.1 percent in March. The bank is scrutinizing whether the strength of economic growth is encouraging companies to increase both prices and wages.
Asia/Pacific
Equity markets continued their synchronized movements from day to day with the exception of stocks in Japan, which continue to be more negative. Asian stocks rallied Monday on prospects of a deluge of Chinese funds after Beijing authorities relaxed their rules on overseas investing. Hong Kong had its best trading session in nearly a year on speculation that those shares best known to mainland investors would be the most attractive. China's Securities Regulatory Commission posted the following warning on its website — “Investors should be fully aware that there exists no stock on earth whose prices only surge and never slump. The fact that Chinese investors continue to ignore such warnings from the central bank and regulatory bodies carries dangerous implications for local and overseas markets.” But sentiment was positive, and the Hang Seng index soared 2.5 percent, hitting a record in the process while H shares or Chinese shares listed in Hong Kong, gained 5.4 percent. Elsewhere, Asian/Pacific markets were generally strong.

The seesaw movement continued Tuesday as equities reversed direction, with all those followed here except the Hang Seng giving up Monday’s gains and then some. Japanese stocks lost ground after core private sector machinery orders (excluding volatile orders from electric utilities and for ships) — a leading indicator for corporate capital spending — sank 4.5 percent in March after plunging 4.9 percent in February. These orders declined 5.8 percent and 4.2 percent in March and February respectively when compared with last year. Stocks were up again on Wednesday after a major forecaster said that economic and profit growth in Asia would exceed the rest of the world.
Earnings announcements peaked in Japan last week with as many as 301 companies reporting in a single day according to the Nikkei newspaper. Profit and dividend increases among companies that have reported have generally been above expectations.
On Thursday, Asian/Pacific stocks ended mostly higher for the second day, but Japan edged lower after first quarter gross domestic product data failed to impress investors. As expected, the Bank of Japan left its key interest rate at 0.5 percent. But Japanese exporter shares gained after U.S. factory production rose more than expected. Stocks limped to a close on Friday as Japanese stocks recovered from the peak of the earnings season while profit taking left other indexes on the negative side. Despite Friday’s losses, all but Japanese stocks were up on the week.
Bank of Japan
As universally expected, the Bank of Japan Monetary Policy Board voted unanimously to maintain its current target for the overnight call rate at 0.5 percent. The Bank’s key rate has been at this level since February. The BoJ had abandoned its zero interest rate policy in July 2006 when rates were increased for the first time in six years. The Bank has repeatedly said interest rates would be gradually adjusted in response to growth and inflation while at the same time, maintaining its ‘accommodative’ policy by keeping short-term interest rates at very low levels. But at the same time they warned that low rates can not continue forever because they could trigger ‘excessive economic behavior’ and hurt growth.

In his press conference following the policy meeting, BoJ Governor Toshihiko Fukui said that the central bank could increase interest rates even while consumer prices are falling if it confirms that the economy will stay on a sustained growth track assuming price stability. Fukui noted that the propensity for prices to react to economic growth in industrial nations including Japan and the U.S. has weakened as many firms compete in fast-moving globalized markets.
Peoples Bank of China surprises markets
The Peoples Bank of China surprised analysts after Asian/Pacific markets were closed for the week Friday. Interest rates were increased by 27 basis points to 6.57 percent from 6.39 percent. It was the second increase this year. Reserve requirements, which were increased for the fifth time in 2007, now stand at 11.5 percent and just 1.5 percent below the historical high of 13 percent reached in 1998. The PBoC also widened its daily trading band for the renminbi or yuan to 0.5 percent from 0.3 percent. The moves were widely interpreted to be aimed at Washington and stock market speculators in China. The interest rate increase was directed towards the domestic market which has escalated from bullishness about the Shanghai stock market to a frenzy. The government had been expected to introduce measures designed to cool the speculative fever.

Although an interest rate increase had been widely expected and the market had been becoming increasingly used to regular reserve requirement increases, speculation about a band widening had largely dissipated since last year against the backdrop of the yuan's slow, gradual crawl higher against the dollar. The band widening means that the yuan will be allowed to rise or fall by 0.5 percent in a day around the central parity versus the previous 0.3 percent fluctuation limit. The PBoC stressed that the move does not imply that the yuan will now appreciate sharply against the dollar. The Bank increased deposit rates by 27 basis points but its lending rate only by 18 basis points in an attempt to lure household deposits out of the market and back into the banking system.
Currencies
The yen was down once again last week as dismal machinery orders and weak gross domestic product data exerted downward pressure on the currency. In Friday’s Asian and European trading, the yen rallied briefly after the Chinese monetary policy moves were announced. The yen is often seen as a proxy currency to its Chinese counterpart. The yen however ebbed downward once again in U.S. trading. Earlier in the week, the yen touched a lifetime low against the euro and a three-month low against the dollar after soft Japanese gross domestic product data and weak machine orders cemented expectations that any Japanese interest rate increase was still some way away. Yen-carry trades were back as weak Japanese GDP data gave investors a reason to continue selling the currency. Low Japanese interest rates have led investors to fund the purchase of riskier high-yielding assets with yen.

The dollar continues to be weak as it hit fresh multi-year lows against many European currencies and continues to depreciate against a growing number of emerging market currencies. The dollar rallied Thursday as surprising strength in the jobs market weakened the case for a near-term cut in U.S. interest rates. Jobless claims sank to their lowest level in over a year helping the dollar to increase to a one-week high against the euro and a three-month peak against the yen. However the rally did not last long and the dollar once again slipped against the euro. On the week the euro barely edged down.

Indicator scoreboard
EMU — March industrial output was up 0.4 percent and 3.7 percent when compared with last year. Both intermediate goods and energy production were up 0.5 percent on the month. Intermediate goods were up 6.4 percent on the year while energy good output was down 7.3 percent. Capital goods production was unchanged on the month and up 6.4 percent on the year. Consumer durables declined by 0.2 percent while consumer nondurables gained 0.7 percent on the month.

First quarter flash gross domestic product was up 0.6 percent and 3.1 percent when compared with last year. This was weaker than fourth quarter 2006 growth of 0.9 percent and 3.3 percent on the year. As with all flash estimates, no detail is available. German and Spanish growth estimates were stronger than expected while French GDP was slightly weaker than anticipated and Italy recorded the weakest growth of the four big EMU economies.

April harmonized index of consumer prices was up 0.6 percent and 1.9 percent when compared with the same month last year. This was the eighth straight month that the HICP has been below the ECB’s 2 percent target. Core HICP, which excludes, food, alcohol, tobacco and energy, was up 0.5 percent on the month and 1.9 percent on the year. All component prices were up on the month with the exception of communications and recreation & culture. On the year, prices jumped 9.2 percent for education, 3.7 percent for alcohol and tobacco, and 3.1 percent for hotels and restaurants.

Germany — First quarter gross domestic product was up 0.5 percent and 3.6 percent when compared with the same quarter a year ago. Fourth quarter 2006 growth was revised upward to 1 percent from 0.9 percent. The stronger than expected growth belied predictions that the January 1, 2007 VAT increase would hamper the expansion. As with all flash estimates, no detail is available.

April producer price index was up 0.1 percent and 1.6 percent when compared with last year. Excluding energy, the PPI was up 0.5 percent and 2.9 percent on the year. Energy prices were down 0.8 percent on the month and 1.9 percent on the year. Consumer goods prices were up 0.2 percent and 2.7 percent on the year. Manufacturing production prices were up 0.6 percent and 2.5 percent on the year.

France — First quarter gross domestic product was up 0.5 percent and 2 percent when compared with last year. With this release France finally shifted from using constant (fixed) 2000 prices in their quarterly national accounts to chained prices with a reference year of 2000. France has thus become the last major European Union country to adopt chain-linked volume data in their quarterly national accounts as required by Eurostat's European System of Accounts (ESA95). Household consumption was a drag on growth, expanding by 0.3 percent and 0.9 percent on the year. Business fixed investment was up 1.4 percent and 3.9 percent while household investment was up a meager 0.2 percent and 0.6 percent on the year.

United Kingdom — April producer output prices were up 0.5 percent and 2.5 percent when compared with last year. The ONS said that much of the rise in factory gate inflation last month was the result of increases in petrol, tobacco and alcohol prices. Core output prices, which exclude food, drink, petrol and tobacco, were up 0.1 percent and 2.3 percent on the year. Input prices were up 0.7 percent but down 0.2 percent on the year.

April consumer price index was up 0.3 percent and 2.8 percent when compared with last year. Declining gas and electricity bills played a key part in the CPI’s decline from March when the index was up 0.5 percent on the month and 3.1 percent on the year. However, without the reductions in gas and electric bills, the CPI would have been up more than 3 percent on the year. Core CPI, which excludes energy, food and alcoholic beverages, was up 1.8 percent on the year. The retail price index was up 0.5 percent and 4.5 percent one the year. The CPI remains significantly above the Bank of England’s inflation target of 2 percent. The RPI excluding mortgage interest payments (RPIX) was also up 0.5 percent on the month and 3.6 percent on the year.

Average earnings for the three months ending in March when compared with a year ago were up 4.5 percent, slightly lower than the 4.6 percent recorded in the previous three months. Excluding bonuses, earnings were up 3.7 percent for the same period. For the month of March, average earnings were up a benign 3.8 percent on the year after jumping by 5.2 percent in February.

April claimant count unemployment was down for the seventh consecutive month, dropping by 15,700. At the same time, the claimant unemployment rate edged down to 2.8 percent from 2.9 percent in March. However, using the International Labour Organisation methodology, unemployment was up by 13,000 for the three months ending in March. The ILO unemployment rate remained at 5.5 percent. Employment during the same period fell 55,000, with working age employment at 74.3 percent, down 0.2 percentage points from the previous three months.

April retail sales edged down 0.1 percent and were up 4.2 percent when compared with the same month a year ago. Sales data for March were revised upward to an increase of 0.5 percent from the originally reported increase of 0.3 percent. The main contributor to the decline was a drop of 0.5 percent at predominantly non-food sales. Household goods stores sales sank 3 percent on the month. However, non-store sales, which includes mail order and internet sales, soared 2.5 percent on the month and 17.5 percent on the year. Food sales edged up 0.2 percent and were up 2.3 percent on the year.

Asia/Pacific
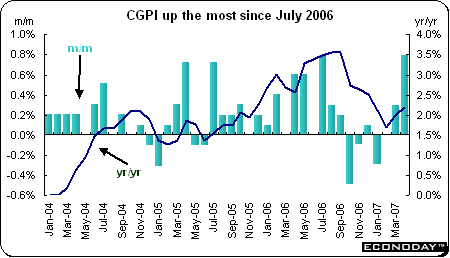
Japan — April corporate goods price index was up 0.8 percent and 2.2 percent when compared with last year. Manufacturing industry products prices were up 0.8 percent and 2.2 percent as well. All categories except transportation equipment were up on the month. Ceramic, stone & clay and electrical machinery & equipment were unchanged on the month. Prices for commodities such as non-ferrous metals and fuel oil were up while prices for electric power, gas & water were down.
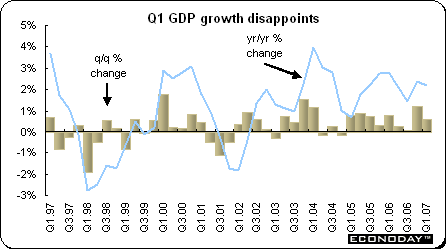
First quarter gross domestic product was up 0.6 percent and 2.2 percent when compared with the same quarter a year ago. GDP grew 2.4 percent on an annualized basis, a substantially slower rate than the fourth quarter’s 5 percent annualized gain. Q1 on the quarter growth was weaker than the fourth quarter thanks to declines in corporate capital investment and housing construction. On the plus side were strong export gains and firm private consumption. Unusually mild winter weather boosted sales of spring clothing, restaurant sales and tourism except ski resorts. Private consumption which accounts for about 55 percent of GDP was up 0.9 percent on the quarter while private non-residential investment declined by 0.9 percent. Private residential investment was down 0.3 percent. The GDP deflator declined 0.2 percent on the year.
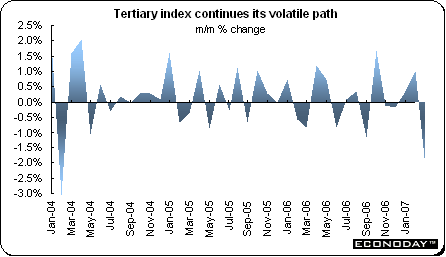
March tertiary activity index sank 2.2 percent. This is the first monthly drop since December 2006. The index was up 0.9 percent on the year. Activity slowed for information & communications, wholesale & retail trade, services, transport, health care and finance & insurance. Only electric & gas supplies and eating & drinking places were up on the month. The service sector employs more than half of Japan's workforce, and spending on services such as retailing, dining and travel is closely tied to changes in income and consumer confidence.
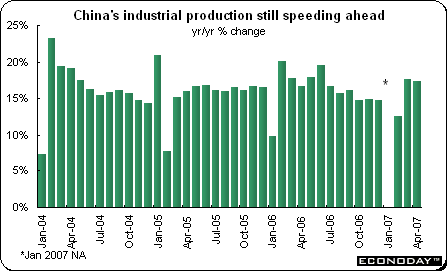
China — April industrial production was up 17.4 percent when compared with the same month a year ago. This was marginally slower than March’s 17.6 percent and lower than the 18.5 percent rate for January and February combined. However, industrial output continues to grow above 2006 levels. Steel sector output was up 20.9 percent and autos, 18.6 percent. The data cover output by state and non state-owned companies with annual revenue of over 5 million yuan.
Americas
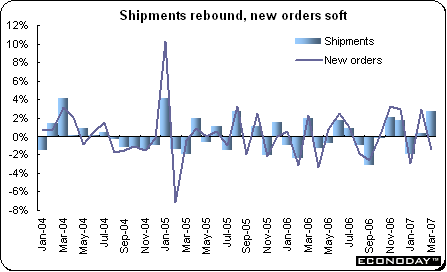
Canada — March manufacturers’ shipments jumped by 2.8 percent and were up 1.3 percent when compared with last year. February shipments had been disrupted by the combination of a rail strike and a refinery fire in Ontario. Shipments advanced in 15 of 21 manufacturing sectors, representing about 78 percent of total output. Both durable and non-durable goods were up, 3.3 percent and 2.2 percent respectively. The durable goods increase was due to strong automotive and aerospace production. Unfilled factory orders, an indicator of probable future shipments, was up 0.2 percent on the month and 10.4 percent on the year. New orders slipped 1.4 percent and were up 1.3 percent on the year.
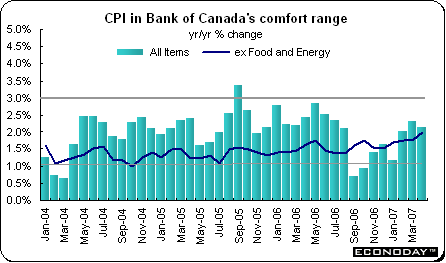
April consumer price index was up 0.4 percent and 2.2 percent when compared with last year. Higher house prices along with increases in gasoline and food contributed to the increase. Core CPI which excludes food and energy was up 0.2 percent and 2 percent on the year. The Bank of Canada core CPI which excludes eight volatile components was up 0.2 percent and 2.5 percent on the year. The Bank of Canada has an inflation control target range of 1 percent to 3 percent.
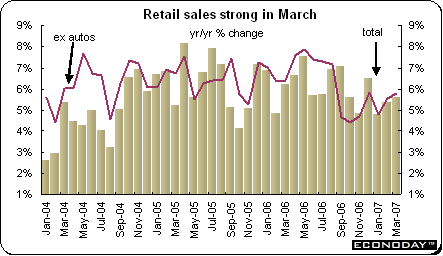
March retail sales soared 1.9 percent and were up 5.6 percent when compared with last year. Excluding autos, sales jumped 1.1 percent and 5.8 percent on the year. Seven of eight retail sectors were up on the month. Only general merchandise sales edged down, by 0.2 percent. Overall automotive sector sales (which includes gasoline stations) rebounded by 3.8 percent after two months of declines. Clothing and accessories sales were up 1.5 percent while shoe, clothing accessories & jewelry stores were up 0.7 percent after declining for two months. Food & beverage store sales were up 0.8 percent while pharmacies & personal care store sales climbed 0.6 percent. Total retail sales adjusted for price changes were up by 1.4 percent.
Bottom line
A plethora of GDP estimates were released last week and investors got a first look at first quarter growth data. Both the EMU and Germany surprised on the high side while Japan disappointed on the low side. As expected, the Bank of Japan left their policy rate at 0.5 percent. However, the Peoples Bank of China did the unexpected by announcing three policy moves at the same time after Asian/Pacific markets had already closed for the week. This led to a muted reaction.
Next week should be a relatively quiet week with no major central bank meetings scheduled and few data releases scheduled in Europe. Rather the key numbers will come from Japan culminating in the latest news on inflation on Friday (local time, Thursday night on the U.S. east coast).
Looking Ahead: May 21 through May 25, 2007
| The following indicators will be released this week... |
| Europe |
|
|
| May 22 |
EMU |
Merchandise Trade Balance (March) |
| |
Germany |
ZEW Business Survey (May) |
| May 24 |
Germany |
Gross Domestic Product (Q1.07 revised) |
| May 25 |
France |
Manufactured Products Consumption (April) |
| |
UK |
Gross Domestic Product (Q1.07 revised) |
| |
|
|
| Asia |
|
|
| May 23 |
Japan |
All Industry Activity Index (March) |
| May 24 |
Japan |
Merchandise Trade Balance (April) |
| May 25 |
Japan |
Consumer Price Index (April, May) |
Anne D Picker is the author of International Economic Indicators and Central Banks.


|

