
 Q1 ends on mixed note
By Anne D. Picker, Chief Economist, Econoday
 Friday, March 30, 2007 Friday, March 30, 2007

Global Markets
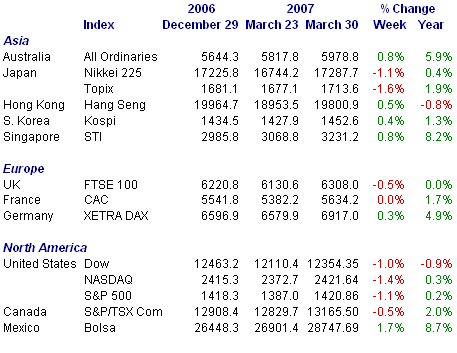
Equities were mixed in the last week of first-quarter trading. Investors absorbed mixed economic data and testimony from Federal Reserve Chairman Ben Bernanke in addition to higher crude oil prices as a new Iranian hostage crisis emerges. Merger speculation was a positive. International investors focused on U.S. economic data and did not always like what they saw. However, they were cheered on Thursday (despite climbing oil prices) when revised fourth quarter U.S. gross domestic product data were stronger-than-forecast and claims for unemployment benefits declined unexpectedly. However, equities retreated and the U.S. dollar declined after the U.S. administration announced new levies on Chinese imports.
Concern over slow U.S. growth and a sharp decline in Chinese stocks in February took the luster off of a rally that had sent many of the indexes listed below to six-year highs. The indexes have resumed their upward trajectory as M&A activity helped stocks recoup. However, only the Bolsa has regained the lofty heights of the third week of February.
The Bolsa, DAX, STI, Kospi, Hang Seng and all ordinaries gained last week while the remaining indexes tracked below were down. For the month, only the Topix and Nikkei were down. For the first quarter, the Dow and Hang Seng were down and therefore, below their 2006 year end levels.
Global Stock Market Recap
Europe and the UK
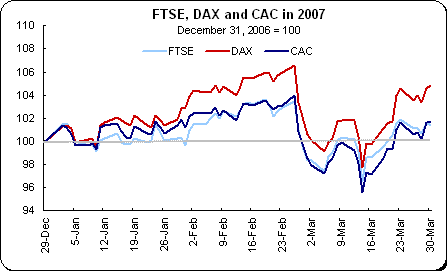
The DAX was up 0.3 percent last week while the CAC was virtually unchanged and the FTSE retreated 0.6 percent. However, both March and the first quarter were positive for the three. While the indexes have made progress in recovering the late February losses, they still have a way to go. Stocks were pressured negatively by climbing crude oil prices on the heels of the UK-Iran hostage crisis and the political uncertainties that surround it. But a positive pull came from merger and acquisition prospects that have come to the fore and offset some of the losses. Investors continue to fret over U.S. growth prospects and particularly the housing sector. They are concerned about the housing slowdown's impact on the overall economy as the ripple effects work their way through the economy and on the slowdown’s impact on the mortgage market, already feeling the pinch from the sub-prime market’s travails. The graph below shows the performance of the three indexes in the first quarter.
Asia/Pacific
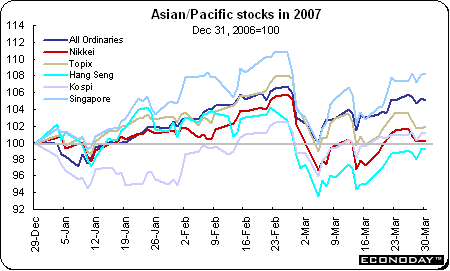
Four of the six Asian/Pacific indexes followed here were positive at the end of last week with only the Nikkei and Topix ending in the red both for the week and month. The two indexes were up on Friday thanks to positive economic data on consumer spending. And investors also were pleased that industrial production did not decline as much as expected. But it was too little to offset the losses that occurred earlier in the week. The yen played a major role in equity trading — when it appreciated in value, stocks were down, and when it sank, stocks were up.
With the first quarter of 2007 now history, the graph below shows the indexes’ relative performance during the quarter. The steady climb for the first eight weeks of the year was followed by a sharp decline. The indexes have made fairly stable progress in regaining the losses but none have recouped their February highs. However, only the Hang Seng was down on the quarter.
Land prices in Japan were up for the first time in 16 years in 2006 in the latest sign that deflation is fading away. Demand for office space is on the increase in metropolitan areas as well. Commercial land prices in Japan's three biggest cities rose 8.9 percent in 2006. Commercial land in and around the three largest cities of Tokyo, Osaka and Nagoya were up for a second straight year after gaining 1 percent in 2005. Land prices nationwide were up as gains in the three cities compensated for drops elsewhere. Japan's commercial and residential land values are still half the levels reached in 1988. Residential land prices increased 2.8 percent.
Bank of Japan Governor Toshihiko Fukui said that he is monitoring land prices after a report showed gains of as much as 46 percent in parts of Tokyo last year. Governor Fukui told lawmakers that consumer prices were firming because of the sustainability of economic growth. He said that the price declines in February and March were because of cheaper oil rather than poor growth prospects.
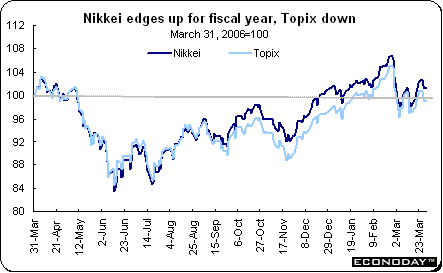
The Nikkei was barely gained during the fiscal year that just ended while the Topix ended on the negative side. The Nikkei was up 1.3 percent, the Topix down 0.8 percent.
Americas
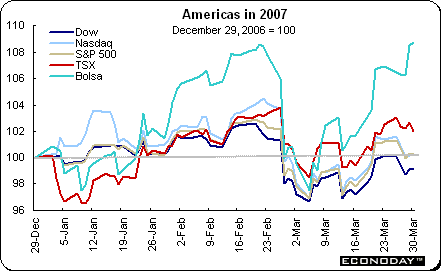
The Dow was down in the first quarter of 2006 while the S&P and Nasdaq held on to meager gains. The Dow was down 0.9 percent while the S&P and Nasdaq gained 0.2 percent and 0.3 percent respectively. The story was more cheerful elsewhere. The Bolsa has surpassed its previous high on February 19th — the only index here to do so. The S&P/TSX composite is up 2 percent in the quarter.
Currencies
Both the yen and euro were higher last week against the U.S. dollar. The yen reached a nine-day high as the softer U.S. economy and tension between Iran and the U.K. led investors to pare their carry-trade positions. Early in March the yen touched a three-month high when investors trimmed carry trades after the global stock slide. Investors have been borrowing in Japan (and in Switzerland, another low interest rate country) where the overnight interest rate is 0.5 percent to invest in countries where rates are higher. For example, the U.S. and UK have a key interest rate of 5.25 percent while in Australia it is 6.25 percent.
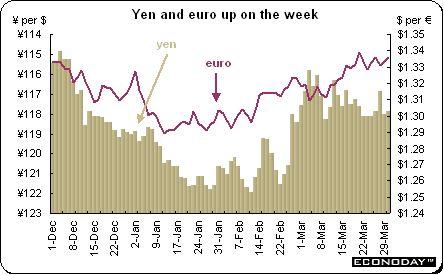
The euro was up against the U.S. dollar as economic data for the eurozone showed continued growth. Unemployment continues to decline while sentiment remains upbeat. The dollar had initially strengthened on Friday after the Chicago-NAPM business barometer was up more than forecast. But later the dollar reversed direction against both the euro and yen after the U.S. imposed tariffs on imports from China. Traders sold the dollar on speculation that the new taxes would reduce trade flows with China.
Indicator scoreboard
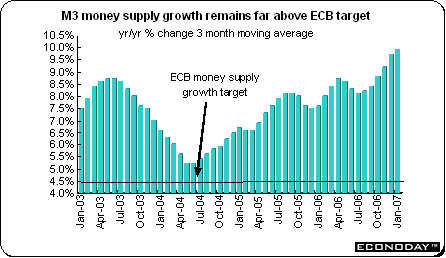
EMU — M3 money supply growth for the three months ended in February was up 9.9 percent when compared with the same three months a year ago. The three month moving average is the measure preferred by the ECB. M3 money supply growth has a growth reference rate of 4.5 percent. February M3 was up 0.7 percent and 10 percent on the year.
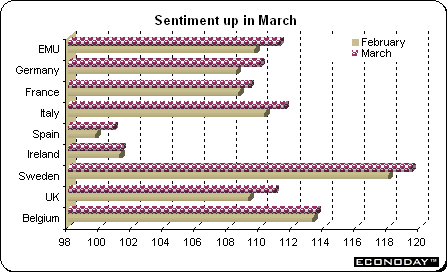
March economic sentiment improved to 111.2 from 109.7 in February. Services sentiment climbed to 22 from 20 in the previous month while consumer sentiment edged up to minus 4 from minus 5 and retail sentiment increased to 5 from 3. The expected price trends index among consumers — an indicator watched closely by the ECB — declined to 18 from 20 in the previous month. Germany, France, Italy, Spain all recorded higher overall sentiment.
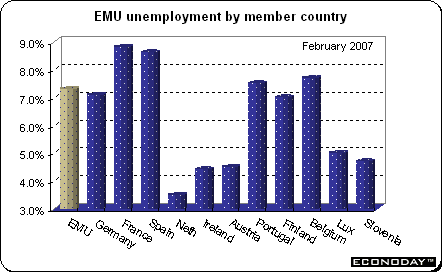
February unemployment rate edged down to 7.3 percent from 7.4 percent in January. The February reading reflects a drop from 8.2 percent in February 2006. Unemployment was down in Germany, France, Belgium and Portugal.
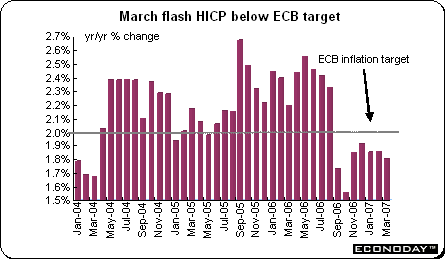
March flash harmonized index of consumer prices was up 1.9 percent when compared with the same month a year ago. This was the seventh month that the HICP was below the ECB’s 2 percent inflation ceiling. As with all flash reports, no details were available.
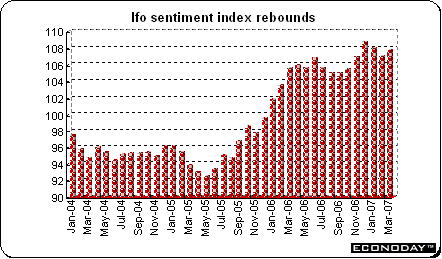
Germany — March Ifo sentiment index climbed to 107.7 from 107 in the previous month. Both the current conditions and expectations indexes were up for the month. Manufacturing sentiment rebounded after February's dip. However, both wholesale and construction sentiment were down. Retail sentiment improved while services remained unchanged.
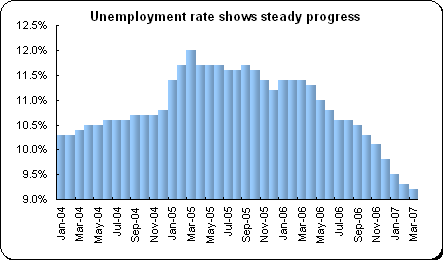
March unemployment rate dropped to 9.2 percent from 9.3 percent in February. This is the lowest unemployment rate since May 2001. The number of people out of work declined by 65,000 on a seasonally adjusted basis. Unemployment in the East edged down to 15.2 percent from 15.4 percent while in the West, the unemployment rate dipped to 7.6 percent from 7.8 percent in the previous month.
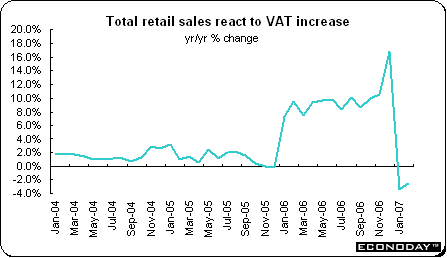
February preliminary total retail sales were up 1.3 percent but down 2.5 percent when compared with February 2006. Excluding autos and gasoline stations, retail sales were up 0.9 percent and down 1.6 percent on the year. Household appliances & furniture sales increased 3.6 percent while cosmetics & pharmaceutical products were up 2.2 percent on the year. Food, beverages & tobacco sales dropped 4.2 percent. The preliminary data are based on results from six of the larger German states, representing some 76 percent of the country's total retail sales.
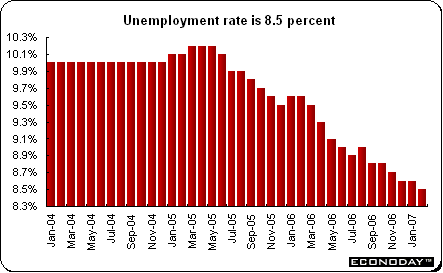
France — February unemployment rate eased to 8.4 percent from 8.5 percent in the previous month. This is the lowest employment rate since June 1983 as measured by International Labour Organisation methodology. The number of unemployed dropped by 25,000. A law that makes it easier for small companies to fire employees along with measures to encourage the unemployed to take jobs and a five-year plan subsidizing some jobs and apprenticeships has contributed to the drop in the jobless rate, which in March 2004 was at 10 percent.
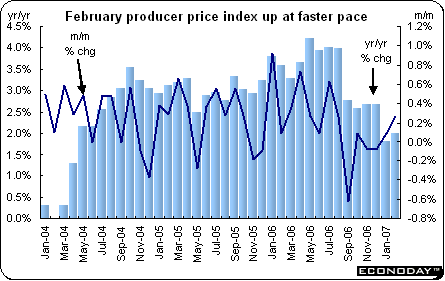
February producer price index was up 0.3 percent and 2 percent when compared with last year. Excluding food and energy, the PPI edged up 0.1 percent but jumped 2.9 percent on the year. Energy prices were up 0.7 percent on the month after dropping 1.8 percent in January. Energy prices were down 1.5 percent on the year. Food & agriculture prices were up 0.4 percent and 2.6 percent on the year. Capital goods prices were up 0.3 percent on the month while auto sector prices declined 0.2 percent on the month.
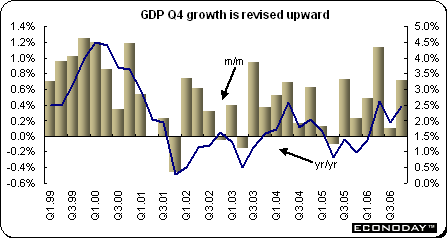
Fourth quarter gross domestic product was revised upward to a gain of 0.7 percent from 0.6 percent when compared with the previous quarter. GDP was up 2.5 percent when compared with a year ago. The upward revision was due primarily to stronger than original estimates for private consumption and business investment. Business investment was revised up to a 2.1 percent gain from 1.1 percent as originally estimated. Household consumption was revised to an increase of 0.5 percent from the earlier estimate of 0.4 percent.
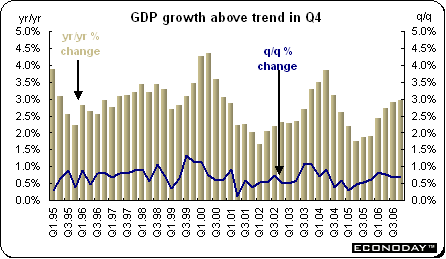
United Kingdom — Final fourth quarter 2006 gross domestic product was revised down slightly on the quarter to 0.7 percent from the previous estimate of 0.8 percent. GDP remained up 3 percent when compared with the same quarter a year ago. The service sector, up 0.9 percent, was the main growth driver as activity in the transport, storage and communications sectors picked up. Manufacturing output was flat, while mining and quarrying contracted by 0.6 percent.
Asia
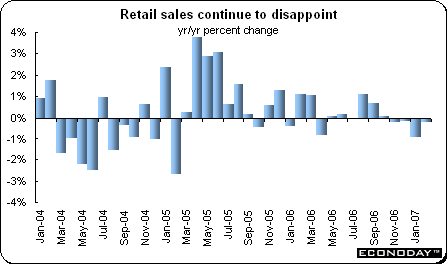
Japan — February retail sales dropped 0.2 percent from a year earlier for the fourth straight month of declines. The reading indicates that consumer spending remains sluggish. Sales at department stores and supermarkets, which account for more than 15 percent total retail sales, rose a combined 0.5 percent on the year after adjustment for the change in the number of stores — the first increase in five months.
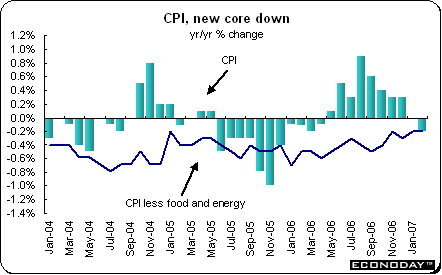
March Tokyo consumer price index was up 0.3 percent but unchanged when compared with the same month a year ago. Core CPI excluding only fresh food was up 0.3 percent and down 0.1 percent on the year. The core excluding both fresh food and energy was up 0.4 percent but down 0.3 percent on the year. February nationwide CPI dropped 0.5 percent and was down 0.2 percent on the year. Core CPI excluding fresh food was down 0.3 percent and 0.1 percent on the year while the core that excludes energy as well was down 0.3 percent both on the month and on the year.
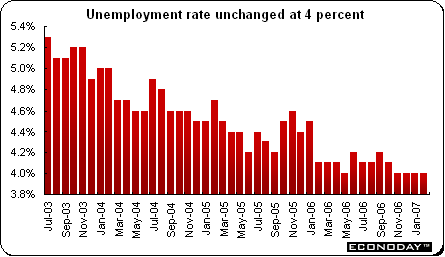
February unemployment rate remained at 4 percent for the fourth month — an eight year low. The ministry also said the total number of jobless fell for the 15th straight month, decreasing by 70,000 from the same month a year earlier to 2.7 million. The jobs-to-applicants ratio, which shows how many jobs are available to a job seeker, fell to 1.05 in February from 1.06 a month earlier. The number reached a 14 year-high of 1.09 in July and jobs have outnumbered applicants for more than a year.
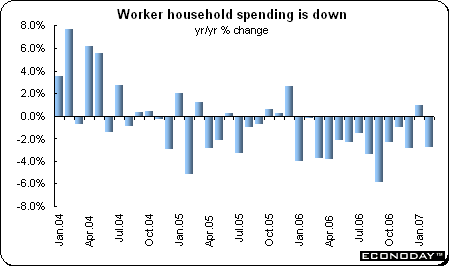
February overall household spending was up 1.3 percent when compared with last year but spending for households headed by wage earners was down 2.7 percent on the year. Consumer spending accounts for over 50 percent of the economy. The propensity for wage earners to consume, a ratio that measures the amount of disposable income that went to household spending, dropped to 72.3 percent when compared with last year.
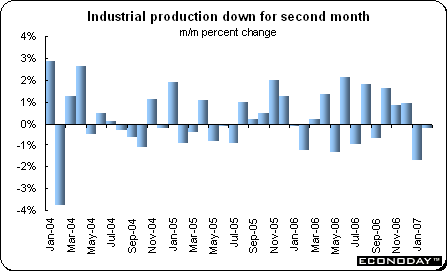
February industrial production declined 0.2 percent and was up 0.4 percent when compared with the same month a year ago. The main reason for the output drop was a 2.8 percent dive in electronic device production, led by semiconductors and active liquid crystal displays.
Americas
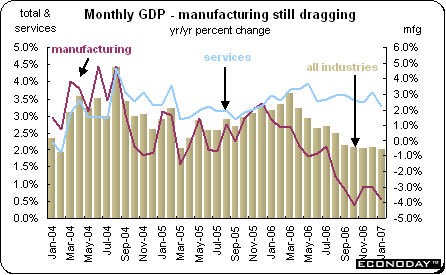
Canada — January monthly gross domestic product edged up 0.1 percent and was up 2 percent when compared with the same month a year ago. Energy output was up 1.5 percent led by higher natural gas production and a rebound in oil and gas exploration. Construction, forestry and financial services, also posted increases. However, these gains were partly offset by declines in manufacturing, retail trade and in some tourism-related industries. Manufacturing output declined 1 percent after expanding rapidly the previous two months. Motor vehicles and parts production accounted for much of the decline. Excluding motor vehicles and parts, the manufacturing sector grew 0.1 percent. Nine of the 21 major manufacturing groups accounting for 50 percent of total manufacturing value added declined in January.
February industrial product price index was up 0.9 percent and 4.4 percent when compared with last year. Energy and primary metal prices were the main factors pushing up the prices for manufactured goods and raw materials. Petroleum and coal prices were up 4.6 percent while primary metal products increased by 2.9 percent on the month. The monthly increase to the IPPI was slowed by price declines for autos and lumber & other wood products, both down 0.3 percent.
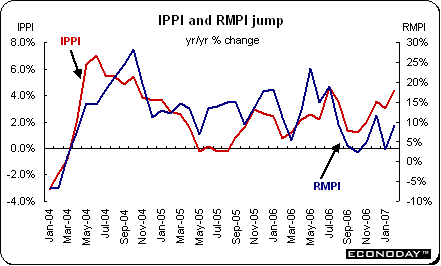
February raw materials price index jumped 2.6 percent and 9.1 percent on the year. All raw material groups posted gains, except for non-ferrous metals. Mineral fuels prices led the way increasing by 5.5 percent. The price for crude oil rose 6.8 percent while the price for natural gas declined 0.9 percent as a result of excess supply. Without mineral fuels, the RMPI would have increased 0.2 percent on the month and 21.5 percent on the year. Year over year, natural gas prices declined for an eighth month in a row, with reserves reaching record levels.
In February the value of the Canadian dollar against its U.S. counterpart was up 0.4 percent. Without the effect of the exchange rate, the total IPPI would have risen 1.0 percent instead of 0.9 percent. On the year, the value of the Canadian dollar fell 1.9 percent against the U.S. dollar. If the impact of the exchange rate had been excluded, producer prices would have been up 3.9 percent rather than their actual increase of 4.4 percent.
Bottom line
Investors were inundated by new economic information last week. At best the data were mixed, especially for the U.S. and Japan. In the U.S., housing data were poor while at the same time, GDP for the fourth quarter was revised up. And Fed Chairman Ben Bernanke sought to clarify the FOMC statement of the previous week. The result is a matter of opinion.
This week begins the monthly rounds of central bank meetings with the Bank of England and the Reserve Bank of Australia. While both are expected to increase their key interest rates from 5.25 percent and 6.25 percent respectively, it is uncertain that the increases will occur in April.
Looking Ahead: April 2 through April 6, 2007

Anne D Picker is the author of International Economic Indicators and Central Banks.
Now available at Econoday.com.


|

