Recap of US Markets
STOCKS
An unexpected spike in the CPI weighed on the stock market Friday even though the rise was mostly due to a surge in energy prices. The core CPI was in line with recent trends. Corporate earnings were generally favorable, but obviously not good enough to preserve gains early in the week. Mergers and acquisitions were on everyone's mind - particularly after the Cingular-ATT Wireless deal was announced. As the number of competitors in the wireless industry diminishes through M&A, industry profits are likely to improve. This allowed several of the wireless phone service providers to see some price appreciation.
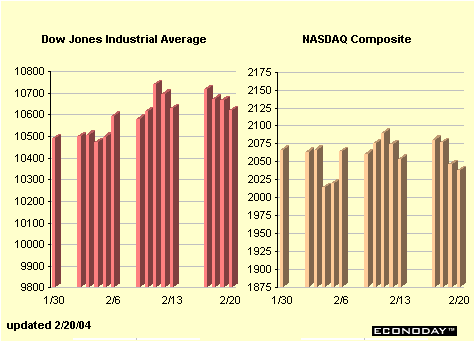
In an interesting about face, the Nasdaq composite index saw greater deterioration in the past week than the Dow industrials. The Dow is now 1.6 percent higher than at year end, while the Nasdaq composite is up 1.7 percent. The Nasdaq is down 5.4 percent from its near term peak on Jan. 26. In contrast, the Dow is only off 1.1 percent from its recent peak a week ago.
BONDS
Bond investors were not prepared for the 0.5 percent spike in the CPI on Friday and this led to a little jump in bond yields across the maturity spectrum. Otherwise, 10-year note yields have held in a tight trading range over the past two weeks. Even with the Friday spike, 2-year note yields are still down from early February.

Bond investors are closely monitoring movements in the foreign exchange value of the dollar. If Asian central banks buy dollars to prevent currency appreciation, they will also be buying Treasury securities - and that will help keep yields down. However, if the dollar stops depreciating, Asian central banks that want to stay aligned with the dollar won't need to buy dollars and won't be buying Treasury securities either. The dollar will remain at center stage in the Treasury market in the upcoming week.

Markets at a Glance
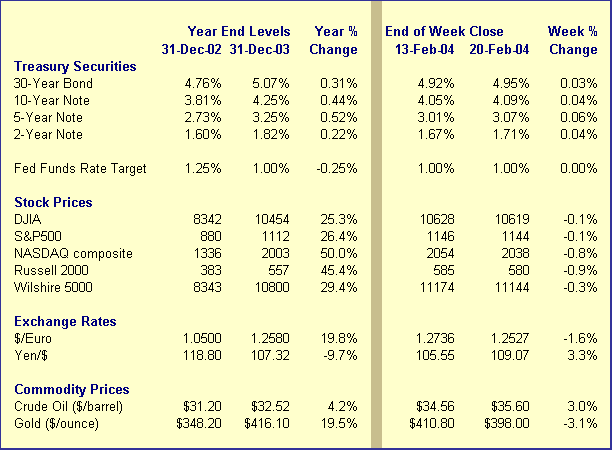
Weekly percent change column reflects percent changes for all components except interest rates. Interest rate changes are reflected in simple differences.
The Economy
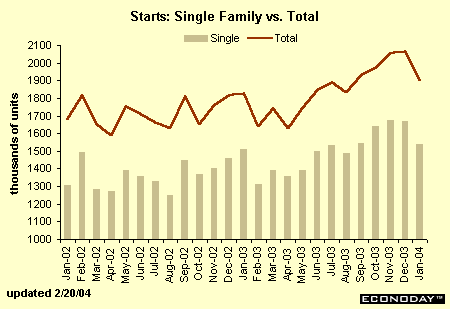
January housing drops
Housing starts dropped 7.9 percent in January to a 1.90 million unit rate, recording the first decline since August. Declines were sharpest in the Northeast and the Midwest, which were particularly hit by extreme temperatures and severe snowstorms. Single-family construction declined 7.8 percent for the month, and construction of multi-family units likewise posted an 8 percent drop. Not since 2000 have starts posted a decline in January, a reflection of this January's extremely bad weather.
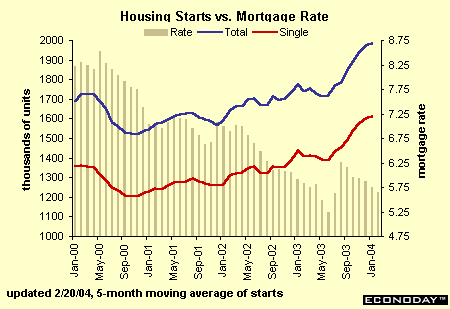
It is certainly possible that housing activity is starting to moderate. The monthly survey from the National Association of Homebuilders pointed to a decline in January and February. However, mortgage rates are continuing to trend down again. In the three weeks of February, average mortgage rates on 30-year fixed rate loans fell back to their lowest levels since July 2003. The January decline may be overstating the weakness a bit. The chart below depicts the 5-month moving average for housing starts (total and single family) which shows the rising trend is still intact. According to the Census Bureau, which compiles and releases these data, it takes five months to reveal the trend in housing starts. Notice that the chart above, depicting actually monthly levels, is quite volatile.
It is worth noting that new home sales declined in both November and December, and that the months' supply of unsold new homes was on the rise. Typically, that would signal a moderation in starts of single-family homes. But lower mortgage rates will ensure that housing activity remains relatively healthy over the next couple of months as potential homebuyers begin anticipating a switch to rising interest rates.
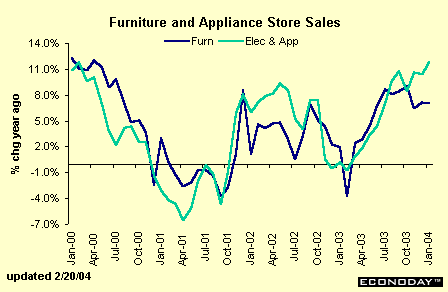
In the meantime, consumer spending on furniture and home furnishings has already moderated. However, spending at electronics and appliance stores continued to grow at a robust pace through January 2004.
Production jumps!
The index of industrial production jumped 0.8 percent in January after posting no growth in December. To a large extent, production benefited from a spurt in utilities output stemming from January's severe weather. Manufacturing rose 0.3 percent and mining edged up 0.1 percent for the month. Monthly growth can be volatile; the chart below shows 3-month moving average changes for total production, manufacturing, mining and utilities. Even the 3-month average can't hide the fact that utilities production fluctuates sharply! Otherwise, note the 0.5 percent per month gains in total and manufacturing production over the past few months. That is certainly promising after the weakness in 2002 and early 2003.
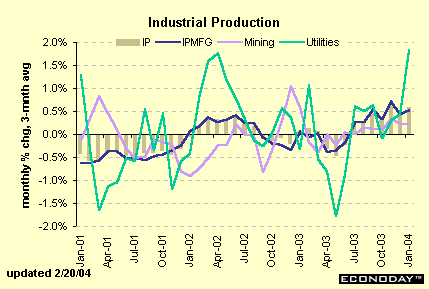
Among major market groups, consumer goods and business equipment production both posted healthy gains in January - offsetting the weakness encountered in December. Production of construction supplies also rose in January after remaining flat in December. Materials production increased twice as fast as the previous month and is up 3.5 percent from a year ago. It is the strongest year-over-year gain among the major production groups and perhaps a bit of a leading indicator. Materials are used in production before supplies and products.
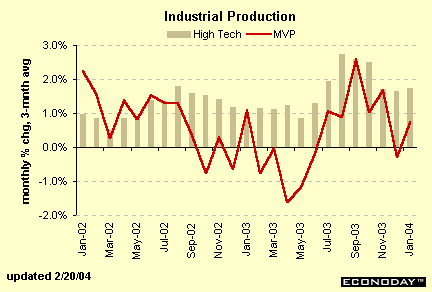
Among various sectors, high tech goods production remains robust - rising 2.6 percent in January after posting "smaller" gains of 1.3 percent in the two previous months. The chart below compares monthly gains in high tech industries to motor vehicles and parts. Once again, we use the 3-month moving average to smooth out monthly fluctuations that obscure the underlying trend. In fact, auto and light truck assemblies can fluctuate dramatically even after smoothing! Notice that high tech industries have posted solid production gains for the past two years.
January CPI spikes on energy prices
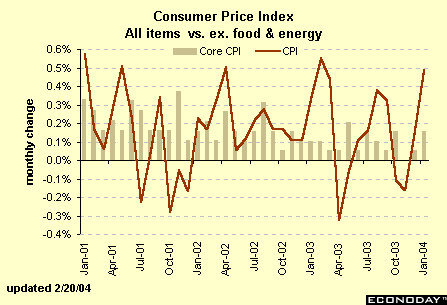
The consumer price index jumped 0.5 percent in January after a more modest 0.2 percent rise in December and outright declines in October and November. Energy prices were behind the dramatic moves in each of the months - including a 4.7 percent spurt in January. Food & beverage prices dipped 0.1 percent reflecting a drop in beef prices due to the mad cow scare. Education costs increased more rapidly in January, as did tobacco prices. Apparel costs declined, as usual. Housing and transportation prices accelerated because of higher fuel costs. Otherwise, car prices dipped and shelter prices were stable.
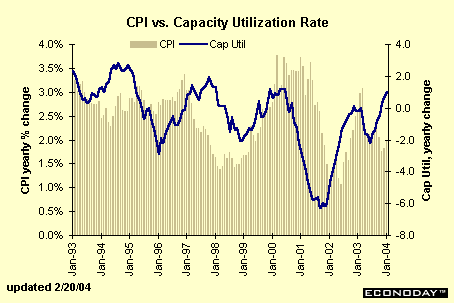
St. Louis Federal Reserve President William Poole said Friday that the risk of disinflation has diminished. While Fed officials don't focus on the total CPI because of the significant volatility inherent in food and energy prices, the core component of the CPI has posted solid gains the past several months. While there is no danger that inflationary pressures will accelerate any time soon, it is likely that the direction of inflation rates will head up rather than down. The chart below compares year-over-year percent changes in the CPI to the year-over-year changes in the capacity utilization rate. While it is true that the capacity utilization rate is just now starting to come out of its funk, there is no question that a strong relationship does exist between inflationary pressures and rising capacity utilization rates. In the past 10 years, increases in capacity utilization have led CPI acceleration by roughly one year. Based on the improvement in the utilization rate that began in mid-2003, one would expect inflation acceleration in roughly 6 - 9 months. Granted, inflation rates are currently low, but Fed officials will need to start worrying about the possibility of acceleration soon.
The Bottom Line
While housing starts dropped in January, probably due to colder-than-normal temperatures coupled with snowstorms across the country, industrial production accelerated sharply in January. The New York Fed's empire state manufacturing survey along with the Philadelphia Fed's business outlook survey both point to continued strength in manufacturing activity in February. This bodes well for industrial production.
The Bureau of Labor Statistics had scheduled to release the producer price index for January, along with a conversion to NAICS industry classifications (from the old SIC classification) this past week, but the data were not ready and the release was postponed.
The consumer price index was somewhat higher than expected due to a spurt in energy prices. Overall, the CPI remains in check, but improving capacity utilization trends suggest that the CPI could start accelerating within the coming year.
Fed officials are certain to be monitoring these trends, although they are also keeping watch on the employment situation. Weekly jobless claims fell back in the week ended February 14 after rising in the two previous weeks. Claims have remained well below 380,000 in the past 16 weeks, better even than the 400,000 level that economists believe must be pierced to achieve solid monthly gains in nonfarm payrolls. Yet, payroll growth is nothing to speak of yet. So the Fed probably won't be raising rates soon to ward off future inflation. But continued declines in weekly claims will eventually lead to payroll hikes, or the data are askew.

Looking Ahead: Week of February 23 to February 27
Tuesday
The Conference Board's consumer confidence index jumped five points in January to reach 96.8, its highest reading since July 2002. Since the Conference Board's index is based primarily on consumers' assessment of the labor market situation, it isn't surprising that the index hasn't shown more marked improvement. The University of Michigan's consumer sentiment index fell sharply at the mid-month reading in February, suggesting a dip in the Conference Board's index as well.
Consumer confidence index Consensus Forecast for Feb 04: 94
Range: 89 to 97
Wednesday
Existing home sales jumped 6.9 percent in December to a 6.47 million unit rate after declining an average 4.8 percent per month in each of the two previous months. Despite the December spurt, sales are still down from the September high at a 6.68 million unit rate. Mortgage rates remain low, but extraordinary frigid temperatures in January might have stalled sales for the month.
Existing home sales Consensus Forecast for Jan 04: 6.25 million unit rate
Range: 6.00 to 6.70 million unit rate
Thursday
New jobless claims declined 24,000 in the week ended February 14 to 344,000. This was the first drop after two straight weekly gains. Despite the improvement, the 4-week moving average rose again. Next week's figures will include a shortened week due to the Presidents' holiday. After that, calendar effects on the data won't reappear until Memorial Day in May.
Jobless Claims Consensus Forecast for 2/21/04: 345,000 (1,000)
Range: 340,000 to 350,000
Durable goods orders rose 0.3 percent in December after dropping 2.4 percent in December. While orders for machinery jumped 3.5 percent in December, the fourth straight monthly rise and the largest in four months, most other components (except transportation) declined in December. November and December declines in computers and electronic products were particularly large.
Durable goods orders Consensus Forecast for Jan 04: 1.5 percent
Range: 0.4 to 3.0 percent
New single family home sales declined 5.1 percent in December to a 1,060,000 unit rate, after declining 2.8 percent in November as well. Indeed, new single family home sales are 11.7 percent below the June peak of a 1,200,000 unit rate. Low mortgage rates could continue to help spur housing activity but temperatures were particularly frigid across the country in January.
New home sales Consensus Forecast for Jan 04: 1,060,000 unit rate
Range: 980,000 to 1,160,000 unit rate
Friday
The Commerce Department will revise their advance estimate of 4 percent real GDP growth. Early calls suggest that a downward revision is in order as December figures are coming in slightly below expectations. While the downward revision may be disappointing to market players, keep in mind that the average growth rate for the second half of 2003 remains hefty by any measure.
Real GDP Consensus Forecast for Q4-03: 3.6 percent
Range: 3.3 to 4.3 percent
GDP deflator Consensus Forecast for Q4-03: 1.1 percent
Range: 1.0 to 2.0 percent
The NAPM-Chicago business barometer jumped nearly 5 points in January to 65.9 percent after a brief dip in December. Business activity in the Chicago region has increased significantly in the past three months. Keep in mind that this index covers manufacturing as well as non-manufacturing activity.
NAPM-Chicago Consensus Forecast for Feb 04: 63
Range: 60 to 66
The University of Michigan's consumer sentiment index plummeted more than 10 points at the mid-February reading to reach 93.1 from the final January figures of 103.8. Given that the mid-February figures are more in line with November and December levels, it is possible that January was the outlier.
Consumer sentiment index Consensus Forecast for Feb 04: 93.1
Range: 92.5 to 94

