Recap of US Markets
STOCKS FALL IN MARCH
Stock prices, as measured by five indexes in the chart below, were generally higher in the first week of March before sliding downhill over the course of the month. The Nasdaq composite is the only one to decline for two straight months, while the Russell 2000 is the only that posted an increase in March. Small-caps and mid-caps outperformed large-caps and high techs in March. The Dow Jones Industrials and the Nasdaq composite are the only two that are down from year-end 2003 (-0.9 and -0.5 percent, respectively). The best performer to date is the Russell 2000 with a 6 percent improvement from year-end. The Wilshire 5000, which measures the entire domestic market, is up 2.2 percent from year-end and the S&P 500 up 1.3 percent.

STOCKS: THE EMPLOYMENT EFFECT
What a great day in the equity markets! Already market players were anticipating friendly employment news after getting positive results on the ISM survey on Thursday. The strong nonfarm payroll report spurred a rally in the equity market with the Dow rising 1 percent on Friday and the Nasdaq jumping 2 percent on the day. A good beginning to a new month - and it was no April Fool's joke either!
BOND YIELDS DECLINE IN MARCH
Not surprisingly, yields were higher at the beginning of the month when stock prices were rising. As stock prices fell, so did Treasury yields. On the economic front, Treasury investors were primarily concerned that labor market conditions remained stagnant. On the political front, terrorist attacks once again were at the forefront with bombings in Spain, the Middle East and Iraq. Yields were down across the maturity spectrum with the largest drop in 3-year note yields (-17 basis points) followed by 5-year notes (-16 basis points) and 10-year notes (-13 basis points). Yields on 2-year notes fell 7 basis points while the 30-year bond yield fell 6 basis points in March.

BONDS: THE EMPLOYMENT EFFECT
In this case, what is good for the equity market is bad for the bond market. A strong employment report in March caused a rout in the Treasury market with yields increasing more than 25 basis points in the 2-year, 5-year and 10-year maturities. While the Fed is not likely to raise its fed funds rate target at the May 4 meeting, it will start thinking about a rate hike. Bond market players like to anticipate the future.
Markets at a Glance

Weekly percent change column reflects percent changes for all components except interest rates. Interest rate changes are reflected in simple differences.
The Economy
Nonfarm payrolls spurt
Nonfarm payroll employment jumped 308,000 in March after upwardly revised gains of 46,000 in February and 159,000 in January. Wow! We have an upward trend at last. Grocery workers who had been on strike in California were finally back on the job, but this did not significantly skew the data higher since temporary workers at these same grocery stores lost their jobs. Gains in the payroll report looked solid. Construction payrolls jumped 71,000 in March, more than reversing February's 21,000 loss and pointing to continued strength in the housing market. After years of declines, factory payrolls were unchanged. Going from a 10,000 drop in January to a 4,000 drop in February to unchanged in March looks promising even on that front.

Service sector jobs were particularly improved with a 230,000 payroll gain, the largest monthly rise since May 2000. Gains were registered across the board, except for temporary workers, where payrolls were reduced by 2,000.
While nonfarm payrolls surged in March, the average workweek decreased 6 minutes to 33.7 hours after running at 33.8 hours in January and February. The slight dip, still keeps hours at a higher pace than at the end of 2003.
In contrast to the spurt in nonfarm payrolls, the household survey was not as perky. Household employment fell 3,000 in March after a 265,000 dip in February. At the same time, the labor force increased 179,000 in March, reversing about half of the 392,000 drop in February. This put the unemployment rate at 5.7 percent, up a tick from the two previous months. Frankly, a rising unemployment rate accompanied by a growing labor force at this stage of the cycle is encouraging. Labor force growth has been meager lately. It is disconcerting, however, to see another downtick in the employment-to-population ratio in March to 62.1 percent from January's near-term high of 62.4 percent. There is no question that labor market problems haven't disappeared with the 308,000 hike in nonfarm payrolls. However, the combination of the rise in payrolls and the sluggish household employment figure puts these two series in better alignment. While these two series aren't intended to move in tandem each and every month, over the long run, they should move in the same general direction by similar magnitude.

Clearly, it is too soon to determine whether the upward trend in payroll employment will continue unabated. Thus, Fed officials are not likely to raise the federal funds rate target at the next meeting on May 4 because they would probably like to see at least one, if not two or three more good employment reports. The next employment situation won't be released until May 7, a few days after the next FOMC meeting. But it certainly puts a summer rate hike back on the table. FOMC meetings are scheduled for June 29-30 and August 10.
Quiescent inflation
The producer price index rose 0.1 percent in February after a 0.6 percent hike in January. Excluding food and energy prices, the PPI also increased 0.1 percent for the month. Among capital goods, computers and light truck prices fell. Among consumer goods, prices were roughly unchanged on most key items. The chart below, depicting monthly changes in the total and core PPI, does reveal that prices have been up more often than they've been down in the past year. This is in contrast to 2001 and 2002 when the opposite was true.

Intermediate and crude materials prices are on a sharply rising trend when looking at the total figures as well as the core (excluding food and energy). Crude goods prices were up 10.7 percent in February from a year ago; crude goods excluding food and energy prices were up a whopping 26.2 percent. The rise in crude goods prices at this stage of the business cycle is not unusual. Typically the crude goods index will move up with industrial production. These price hikes are not always passed along to the consumer at this stage of the game, but continued increases of this magnitude eventually cause inflationary pressures to accelerate along the higher stages of processing.
Incidentally, the Bureau of Labor Statistics remains behind schedule on their PPI releases. Their conversion to NAICS (pronounced "nakes") has been tougher than they expected. They already announced that the originally scheduled April 8 report for March is postponed to a later, to-be- announced, date.
Consumers and confidence
Many financial market investors closely monitor the confidence surveys believing that changes in confidence closely mirror consumer spending plans. Over time, there is no question that consumers who are more optimistic about economic conditions (and their jobs) are more likely to increase retail purchases. But the two series don't always move in tandem. Consumer confidence was about unchanged in March from the February level.

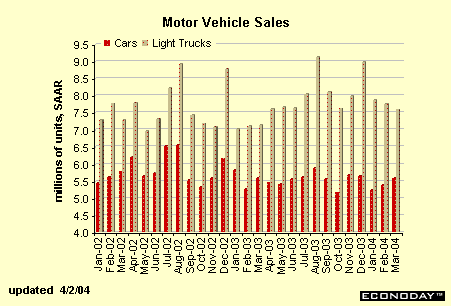
Oddly enough, this time motor vehicle sales are moving in the same direction as confidence: sideways. We consider motor vehicle sales a much better indicator of confidence since buyers actually plunk down money and won't purchase such a large-ticket item when they face an uncertain financial future. Light truck sales fell for the third straight month. Moreover, not only are these sales down from the December outlying pace of 9 million units, but also down from November's 8 million unit pace. In contrast, domestic auto sales are up for the second straight month as at least some consumers appear to have substituted cars for SUVs. But the rise in car sales is small. This is less than favorable news for manufacturers since they tend to have higher profit margins on light trucks than cars.

Manufacturing activity still going strong
The ISM manufacturing index increased more than one percentage point in March to 62.5 percent. Between November 2003 and March 2004, the ISM index has managed to remain well above 60 percent suggesting that manufacturing activity is percolating along at a healthy pace. The price index jumped to 86 in March, its highest level in more than 20 years. Rising prices are partly a result of higher energy prices, but also other commodity prices, especially steel, have increased steadily in the past several months. This typically happens when industrial activity is growing at a healthy rate.

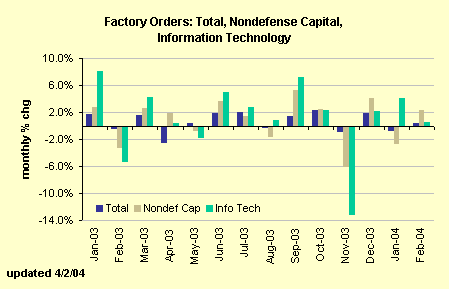
The ISM manufacturing survey has improved more dramatically in the past six months than factory orders. Factory orders inched up 0.3 percent in February after declining 0.9 percent in January. Nondefense capital goods orders, a barometer for capital goods spending, increased 2.3 percent in February and information technology goods rose 0.5 percent during the month, its weakest showing since a 13.3 percent drop in November. The ISM survey suggests that the outlook for factory orders is favorable in the next few months.

The Bottom Line
All in all, economic figures were generally healthy this week and the frosting on the cake was the spurt in nonfarm payrolls (along with upward revisions). This bodes well for many of the economic indicators that will be reported over the next month.
The rising employment figures are clearly good for equity investors who were concerned that the labor market would remain stagnant and not allow consumers to earn additional income that would promote spending. Eventually, though, rising employment will allow the Fed to start raising its federal funds rate target. After all, the 1 percent rate was never sustainable and was held far longer than many observers considered.
Looking Ahead: Week of April 5 to April 9
Monday
The business activity index from the ISM non-manufacturing survey dropped about five percentage points in February to 60.8 percent from a level of 65.7 in January. The drop was somewhat disconcerting to market players last month, but there is no question that the overall level of activity remains high.
ISM non-manufacturing survey Consensus Forecast for Mar 04: 61.5
Range: 58.5 to 65.3
Wednesday
Consumer installment credit expanded by a whopping $14.3 billion in January after growing $8.2 billion in December. February credit growth should diminish slightly as motor vehicle sales have moderated significantly from the December pace.
Consumer credit Consensus Forecast for Feb 04: $6.5 billion
Range: $2.0 to $10.0 billion
Thursday
New jobless claims fell 3,000 in the week ended March 27 to 342,000, after an upwardly revised gain of 12,000 to 345,000 in the previous week. The four-week moving average was 340,250, down about 15,000 from the February average.
Jobless Claims Consensus Forecast for 4/3/04: 340,000 (-2,000)
Range: 335,000 to 340,000


